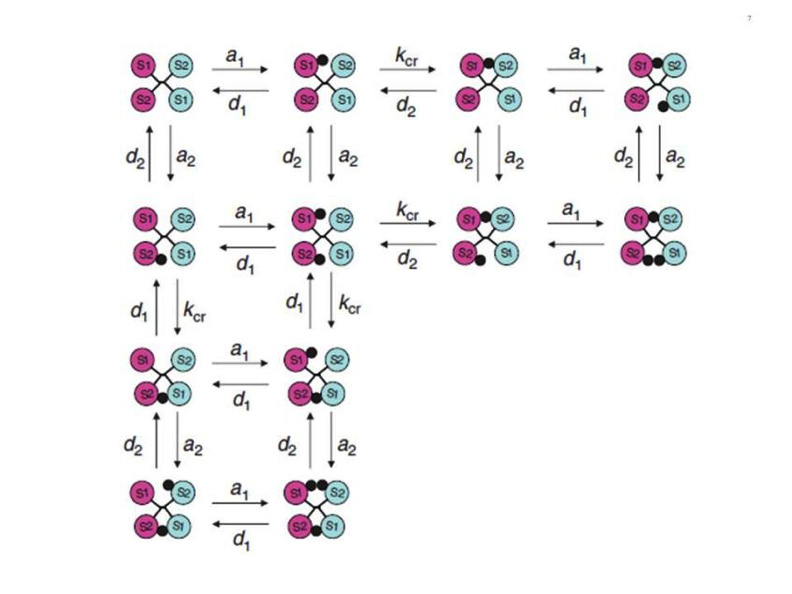
Figure 7. Simplified scheme of the intermediary binding reactions in the harmonic oscillator model. The circles marked S1 and S2 symbolize the two insulin receptor binding sites, in a symmetrical antiparallel disposition. The insulin molecule is symbolized by a black dot. a1 and a2: association rate constants for sites 1 and 2 respectively. d1 and d2: dissociation rate constants for sites 1 and 2 respectively. kcr: crosslinking constant. see text for explanations. From reference 64, used with permission.
Figure 7. Simplified scheme of the intermediary binding reactions in the harmonic oscillator model. The circles marked S1 and S2 symbolize the two insulin receptor binding sites, in a symmetrical antiparallel disposition. The insulin molecule is symbolized by a black dot. a1 and a2: association rate constants for sites 1 and 2 respectively. d1 and d2: dissociation rate constants for sites 1 and 2 respectively. kcr: crosslinking constant. see text for explanations. From reference 64, used with permission.