Archives

Non-Exercise Activity Thermogenesis in Human Energy Homeostasis

ABSTRACT


Low levels of physical activity combined with food intake in excess of daily energy expenditure over extended time periods precede weight gain and promote increases in body fat. Obesity and related insulin resistance are common sequelae of a chronically positive energy balance, potentially resulting in type 2 diabetes (T2D) and nonalcoholic/metabolic dysfunction associated fatty liver disease (NAFLD/MAFLD). The percentage of individuals considered as obese and morbidly obese is continuously rising and developing countries are catching up quickly as compared to industrialized nations. If the observed trend continues, global obesity prevalence will prospectively reach more than 21% in women and 18% in men by 2025. In addition to poor dietary habits, physical activity levels have decreased in recent decades in parallel with an increase in sedentary behavior. Given the technological advances in domestic, community, and working spaces in the last century it is not uncommon for people in industrialized countries to spend one half of their day sitting. As well, for a majority of people, voluntary physical exercise remains of minor importance. Non-Exercise Activity Thermogenesis (NEAT) refers to that portion of daily energy expenditure resulting from spontaneous physical activity that is not specially the result of voluntary exercise. Levels of NEAT ranges widely, with variance of up to 2000 kilocalories per day between two individuals of similar size. These differences are related to complex interactions of environmental and biological factors, including people’s differing occupations, leisure-time activities, individual molecular and genetic factors, and evidence that food intake has independent effects on spontaneous physical activity. Available data support the hypothesis that targeting NEAT could be an essential tool for body weight control. This comprehensive review systematically describes the definition, evaluation methods, and environmental and biological factors involved in the regulation of NEAT. It further emphasizes the association with obesity and related disorders and suggests practical relevant implications, but also potential limitations for the integration of NEAT in daily life.


INTRODUCTION


The prevalence of obesity and resultant adverse health implications continues to rise in both sexes in the United States and worldwide (1). In 2011 Finucane et al. estimated international trends of mean, age-standardized, body mass index (BMI) and suggested that an estimated 1.46 billion adults worldwide had BMI of 25 kg/m² or greater, of these 205 million men and 297 million women were considered obese (2). Indeed, between 1980 and 2008 the prevalence of adult obesity (BMI ≥ 30 kg/m2) has risen in every sub-region of the world except for Central Africa and South Asia (2). The mean BMI increase was reported to be 0.4 kg/m2 per decade for men and 0.5 kg/m2 for women (2). Comparable data have been presented by the NCD Risk Factor Collaboration Trial (3). With a focus on industrialized countries, the most prominent increases of mean BMI have been observed in the United States, followed by the United Kingdom and Australia. The United States had the highest BMI of all studied high-income countries, recent data from the U.S. National Health and Nutrition Examination Survey indicate that obesity affects approximately 35% of the male and 40% of the female population (1, 4, 5). Similarly, populations of European and Eastern Mediterranean countries show an overweight prevalence of up to 50% (6). Further data indicate that compared to 1975, childhood obesity is much more common in 2016, with one obesogenic key driver in this group representing reduced physical activity (3, 7). This continuous rise in the incidence and prevalence of overweight and obesity in children, adolescents, and adults in the past century has created major burdens for national health care systems worldwide.


Obesity-related diseases are typically of chronic nature and include type 2 diabetes mellitus (T2D), nonalcoholic/metabolic dysfunction associated fatty liver disease (NAFLD/MAFLD), peripheral artery and cardiovascular disease, sleep apnea, hypertension, as well as various cancers. In the United States, seven out of the leading ten causes of premature death and disability are represented by chronic diseases related to obesity (8). In fact, obesity is one of the most important avoidable risk factors for significant morbidity and premature mortality, leads to impaired quality of life, can elevate disability rates, and statistically reduces expected life span by seven years (9, 8, 10, 11).


The etiology of obesity is multifactorial, resulting from genetic and epigenetic, physiological, behavioral, sociocultural, and environmental factors leading to an imbalance between energy intake and expenditure (12). To this end excess body fat consistently results from a period of sustained net-positive energy balance, followed by homeostatically regulated weight maintenance. The roles of diet and caloric intake in these processes have been the principal focus of most mechanistic studies. In countries with high obesity prevalence rates, nutritional quality is mostly poor, but there is a controversy as to whether increased energy intake alone can explain the obesity epidemic. Trends for improved dietary quality and reduced energy intake have been observed in recent decades in the United Kingdom and among parts of the U.S.-population (13–15). For instance, since the 1980s obesity prevalence has substantially risen in Great Britain, while caloric intake appeared to decline on a population level (12). In order to explain such findings it was hypothesized that if physical activity decreases, body weight may increase if energy intake is not altered (16). Therefore, under conditions of unchanged caloric intake, the amount of daily physical activity emerged as major predictor (1, 17). Accordingly, the National Weight Control Registry of the United States has identified strategies for maintaining weight loss, which include engagement in higher levels of physical activity (1). Therefore, greater attention has been paid to addressing the energy expenditure side of the caloric balance equation, in particular with regards to prevention of body weight regain after successful weight loss.


NON-EXERCISE ACTIVITY THERMOGENESIS: A SIGNIFICANT COMPONENT OF DAILY ENERGY EXPENDITURE


Daily total energy expenditure (TEE) is the net amount of energy utilized by animals and humans to maintain core physiological functions and locomotion. Three main components of energy balance determine TEE: Basal metabolic rate (BMR), the thermic effect of food (TEF), also called diet-induced thermogenesis, and the energy expended for physical activity (18). Additional components may exist (e.g. energy costs of emotion), but apparently play a minor role with respect to energy balance (19–22). Multiple factors significantly affect our daily energy needs, including age, body composition, thyroid hormone status, catecholamine levels/sympathoadrenergic activity, ambient and body temperature, disease states, and certain medications (19, 18).


Basal Metabolic Rate


Basal metabolic rate (BMR) represents the minimal amount of energy expended to maintain all the body’s vital processes at rest (the basal state). BMR is essentially a function of lean body mass (LBM), which is estimated to account for 80% of BMR within and across species (23–29) . BMR is sometimes misinterpreted to imply the lowest level of energy expenditure during the day. This is, however, not true, since during sleep or undernutrition metabolic functions may be lower than that observed under basal conditions (27). In free-living individuals, BMR accounts for the main percentage of TEE (Figure 1), in healthy subjects with mainly sedentary occupations it predicts around 60% of the variance (22). Otherwise it is proportionally larger in individuals with minimal physical activity (e.g., in sedated and ventilated patients on an intensive care unit) (30).


Of note, it is not uncommon that the term resting energy expenditure (REE) is synonymously interchanged with BMR. However, BMR is measured in completely rested subjects, both before and during the measurements. Therefore, measurements are classically taken in the morning after 8 hours of sleep. Subjects should be lying supine, fully awake, and be fasted for at least 10-12 hours. The environment in which the measurements are taken should be thermo-neutral (22–26 °C) so that no thermoregulatory effect on heat production biases the results (19); and subjects should be free from emotional stress and familiar with the measurement apparatus (27). By contrast, REE is equivalent to postabsorptive energy expenditure at complete rest at any time of the day and can vary as much as 10% from BMR (21).


Some studies suggest BMR is reduced in those prone to become obese (31–33). It is, however, a matter of controversy as to whether a reduction of energy expenditure due to a decrease in BMR sufficiently explains the positive net energy balance that contributes to excess weight gain in the majority of subjects who become obese (34–36). On the other hand, LBM can be enlarged or even preserved by means of regular physical activity, which in turn can favorably modulate BMR (1, 37–39).


Thermic Effect of Food


Thermic effect of food (TEF) is the increment of energy expenditure above REE following meal ingestion that reflects the energy cost (burned) during food digestion, absorption, and storage. It is a relatively stable component of total energy expenditure (Figure 1). Thermic effect of food typically ranges between 8-15% of TEE and the variance of TEF has been associated with nutrient composition and energy content of consumed foods (40).


Physical Activity: EAT and NEAT


Physical activity is the second most significant contributor to TEE in most people (Figure 1). It is defined as the additional energy expenditure above REE and TEF that is required for performing daily activities and therefore also called physical activity-related or simply activity-related energy expenditure (PEE/AEE). PEE/AEE can be categorized into exercise-related activity thermogenesis (EAT) and non-exercise activity thermogenesis (NEAT). Both vary widely within and between individuals.


For the majority of subjects in industrialized countries, exercise is believed to be negligible (20). According to NHANES data, 36.1% of the studied US population was categorized as sedentary, while a further 47.6% were physically active at low levels (40, 41). Remarkably, only around 16% of subjects in NHANES met recommended guidelines for physical activity or were highly active. Even so, the latter subjects did not necessarily exercise (42, 43, 41). Thus, it is reasonable to conclude that on a population level the percentage of subjects engaging in regular, intense physical exercise is low. In those who habitually participate in purposeful physical training, EAT is believed to maximally account for 15-30% of TEE (18, 44). Other authors suggest that the majority of subjects undergoing regular physical training, defined as “bodily exertion for the sake of developing and maintaining physical fitness,” do not exercise more than two hours a week, accounting for an average energy expenditure of 100 kilocalories (kcal) per day(45).  Such expenditure would contribute to only 1-2% to the variance of TEE. Taken together, for most human subjects EAT seems to not be a major contributor to TEE variance.
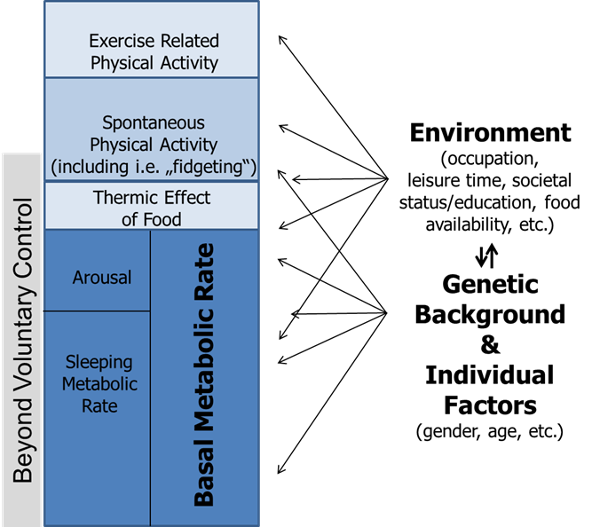
 

Figure 1. Model of human energy expenditure components (adapted from (46)). Exercise-related physical activity is comparable to exercise-related activity thermogenesis (EAT), while spontaneous physical activity is comparable to non-exercise activity thermogenesis (NEAT); for further explanations see text. Note that parts of spontaneous physical activity are beyond voluntary control, also called “fidgeting.” Arrows symbolize the multiple and varying impacts of individual factors, genetic background, and environment.


In contrast, NEAT comprises the largest share of daily activity-related thermogenesis, including for most subjects engaging in regular physical training. It is important to note that both NEAT and spontaneous physical activity are not interchangeable but represent complementary concepts (47): NEAT refers to energy expenditure, while spontaneous physical activity describes the types of bodily activity that are not defined as purposeful movements but still contribute to NEAT. Some authors categorize NEAT into three main subcomponents comprising body posture, ambulation, and all other spontaneous movements including “fidgeting” (48). Accordingly, a certain percentage of spontaneous physical activity (and therefore NEAT) is beyond voluntary control (e.g., “fidgeting”).


NEAT corresponds to all the energy expended with occupation, leisure time activity, sitting, standing, stair climbing, ambulation, toe-tapping, shoveling snow, playing the guitar, dancing, singing, cleaning, and more (20, 22). These activities do not characteristically involve moderate- to vigorous-intensity activities in comparable manner as voluntary exercise, but occur at a low energy workload for minutes and up to hours (12).


The importance of NEAT becomes apparent when considering the following points: The variability in BMR between individuals of similar age, BMI and of equal gender ranges around 7-9% (49), while the contribution of TEF is maximally 15%. Thus, BMR and TEF are relatively fixed in amount and account for approximately three quarters of daily TEE variance. As EAT is believed to be negligible on a population level, NEAT consequently represents the most variable component of TEE within and across subjects. It is responsible for 6-10% of TEE in individuals with a mainly sedentary lifestyle and for 50% or more in highly active subjects (47, 22, 29).


Taken together, with respect to body mass regulation and modification of energy balance, NEAT must be considered as a factor with potentially major impact. This is of particular interest in terms not only of developing therapeutic strategies for the patient with obesity, but also for designing obesity-prevention strategies for populations. The following sections will focus on these issues, including the environmental and biological modification of NEAT.


Measurement of NEAT


For a better understanding of the potential role of NEAT in the context of obesity it is essential to recognize the strengths and limitations of available techniques used for the quantification of NEAT.


NEAT can be principally measured by two approaches: 1) by assessing total NEAT, and 2) by using the factorial approach (for extensive reviews of available techniques see (50, 51)).


TOTAL NEAT


Assuming that EAT is negligible, total NEAT can be calculated by subtracting BMR and TEF from TEE (16):


Equation 1:                 NEAT = TEE – (BMR + TEF)


To complete equation 1, TEE, BMR and TEF need to be measured. Under free-living conditions TEE can be reliably measured by using the doubly-labeled water method (16). This approach requires the application of stable isotopes (deuterium/2H2 and O18) containing water (2H2O18). The difference in the clearance rate of the two isotopes equals carbon dioxide (CO2) production generated during energy production and thus represents quantification of TEE (52)(Figure 2).


One necessary precondition of the doubly-labeled water method is that the O2 of expired CO2 is in equilibrium with the O2 in body water. Once ingested, O18 will be readily distributed in the systemic H2O, H2CO3 and CO2 pools. 2H2 will be dispensed in body water and the H2CO3 pool (equation 2).


Equation 2:                  CO2 + H2O ↔ H2CO3


The concentration of labeled O2 in body water will then decrease over time due to a loss of CO2 with expiration, perspiration, and in excreted body water (urine).  2H2 is mainly lost through excreted body fluids, yet a small percentage can be incorporated into body fat or protein. Since body water becomes tagged with known amounts of tracers at the same time at the beginning of the measurement period, the difference of elimination rates of both tracers equals CO2 excretion.


Doubly labeled water is usually administered at baseline after samples of blood, urine and saliva have been collected (21). Subsequent sample collections occur within 7-21 days after administration, when the isotopes are completely dispersed within body compartments. Isotope-ratio mass spectroscopy is used to measure 2H2 and O18 enrichments in collected samples, which are needed to finally calculate CO2 production. Thereby, TEE can be ascertained under free-living conditions with an error of about 6-8%. This error can be minimized by repeatedly gathering samples over the measurement period rather than relying on only two time points.
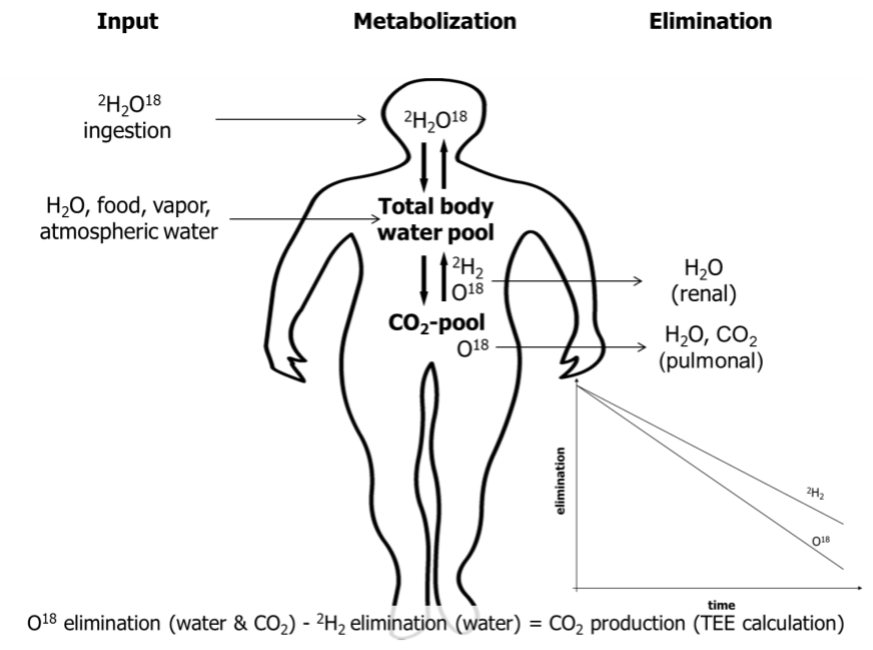
 

Figure 2. Schematic picture of the doubly labeled water method. CO2, carbon dioxide; 2H2, deuterium; O18, labeled oxygen.

It should be mentioned that the study of TEE classically relied on direct calorimetry (49, 18). Direct calorimetry, or direct measurement of heat loss from a subject, is achieved by using well-controlled environmental chambers. However, this requires participants to be confined to small rooms, which fails to capture the enormous variety of NEAT components in free-living individuals (21, 22).


By contrast, indirect calorimetry is an easily accessible and portable method commonly used to assess BMR, RMR and TEF. Indirect calorimetry is based on the principle that by measuring oxygen consumption (VO2), CO2 excretion (VCO2), or both over a defined time span, the metabolic conversion of fats, carbohydrates, and proteins into energy can be calculated using established formulae (18). The net energy released is typically expressed as kcal or Kilojoule (kJ). The small percentage of physiological protein oxidation can be estimated by nitrogen excretion in urine, or can be neglected without adding a substantial error in subjects who are in stable nitrogen balance (18).


Indirect calorimetry is accordingly one of the most commonly used approaches in clinical investigations, either in controlled metabolic-ward studies or in field settings. For instance, Levine et al. in their study on human NEAT applied indirect calorimetry to measure BMR and TEF (53). To measure TEF they provided participants with a meal containing a third of the subject’s daily weight maintenance energy needs. To estimate TEF over 24 hours, the measured energy expenditure area-under-the-curve obtained when they ate the standardize meal was multiplied by three (16). Alternatively, study protocols may ignore TEF as a non-substantial variable, or simply multiply TEE by 0.1 to yield a crude estimate.


When sensitive techniques are not available, BMR can be alternatively estimated by using validated age-, gender- and population-specific equations. For instance, the Harris-Benedict equation is widely used in clinical settings (18). However, this equation was derived from about 300 healthy, normal-weight Caucasian adults between 1907 and 1917 and its application, therefore, has limitations (18). Substantial error could be introduced by applying it to an inappropriate collective, including subjects who are with obesity, which is also true for other validated equations estimating BMR (18).


The physical activity level (PAL) is frequently used in studies to provide an index of activity when measurement of total NEAT is not possible. It is calculated by expressing TEE relative to BMR (15). Sedentary subjects in industrialized countries typically have a PAL of approximately 1.5 (see Table 1). The PAL rises to values of 2.0-2.4 with strenuous work and under certain conditions it can increase to values up to 3.5-4.5 (22). Using PAL, however, can also introduce significant bias in the assessment of NEAT, as under free-living conditions the cumulative error of PAL measurements can be as high as 7% (21).


Table 1. Physical Activity Levels (PAL) Predicted From Lifestyle (from 16).

Chair or bed bound

1.2

Seated work with no option of moving around and little or no strenuous leisure activity

1.4 – 1.5

Seated work with discretion and requirement to move around but little or no strenuous leisure activity

1.6 – 1.7

Standing work (e.g., homemaker, shop assistant)

1.8 – 1.9

Strenuous work or highly active leisure

2.0 – 2.4


THE FACTORIAL APPROACH OF NEAT MEASUREMENT


Measuring total NEAT or using PAL provides no information regarding the individual components contributing to PEE/AEE. Therefore, the factorial approach is widely used to estimate NEAT constituents. Accordingly, all physical activities of a subject of interest are recorded over a defined time span, typically seven days. The energy equivalent of each activity is determined, and these equivalents are then apportioned according to the time spent by the individual with the respective activities. Finally, the data is totaled to get an estimate of the energy expenditure attributable to NEAT (21, 22). The first step when using the factorial approach is the quantification of a subject’s physical activities. Several methods are available to obtain such information, including questionnaires, interviews, and activity diaries. These approaches might be useful for estimates of particular activities, such as those related to occupational duties. Otherwise, they have substantial limitations, including inadequate or incomplete data recording, alteration of habits during assessment periods, and others (21, 22).


Measuring NEAT is a complex task when intensities of transition movements and fidgeting-like activities are the matter of research interest. By applying a combination of direct calorimetry and motion detectors, Ravussins’s group have shown that there is a considerable inter-person variability of daily energy expenditure, even after adjustment for differences in LBM (29). A large percentage of this variability among individuals was due to variability in the degree of e.g., "fidgeting." Thus, estimation of fidgeting-like activities represents a substantial subcomponent under conditions of NEAT measurement. However, subcomponents such as “fidgeting” might not be captured by many methods. Levine et al. proposed an accelerometer method that could predict 86% of activity related energy expenditure for the posture and locomotion component of NEAT compared with a room calorimeter, but predicted only 50% of the variance in fidgeting and did not discriminate various types of fidgeting (50). Therefore, more technically advanced approaches have been developed. Among these are motion detectors, floor-pressure-pad displacement, cine photography, pedometers, accelerometers, and global positioning systems (GPS) (21, 22). Recently, portable intelligent devices for energy expenditure and activity assessment were used to study subtypes of NEAT by the method of mechanical modeling (54).


However, depending on the degree of sophistication, all these approaches have limitations. While data obtained from triaxial accelerometers typically found in wearable activity monitors is often used as an estimate of activity-related energy expenditure, they only measure actual movements (not energy expended), and a combination of methods probably yields the most appropriate estimates (21, 22). For example, energy costs of single NEAT components are typically measured by means of indirect calorimetry, for which highly sophisticated portable systems are now available. Alternatively, tables with listed energy costs of NEAT activities may be used. This latter method is convenient and inexpensive, but for similar reasons as pointed out for PAL, substantial systematic errors can be introduced (21). Similar problems will arise when NEAT is assessed by multiple linear regression approaches at a population level (55).


Furthermore, principal problems ascend with the NEAT measurement per se, as little validated information is available concerning the time necessary to representatively assess spontaneous physical activity. Many studies report extrapolation of measured results of an individual’s energy expenditure obtained during a limited timeframe to longer intervals. In this regard, experienced investigators believe that measurements of approximately seven days will likely provide a representative assessment regarding a 2-4 month time span (21).


Taken together, the difficulty of getting true estimates under free-living conditions is a major reason why available information on human NEAT physiology is limited. Representative studies are needed that are conducted over appropriate time spans (months) and utilize a combination of the factorial approach and total NEAT measurement to overcome major limitations in current estimates.


INDIVIDUAL AND ENVIRONMENTAL DETERMINANTS OF NEAT


There is a close interplay between environmental factors and individual characteristics with respect to NEAT as discussed below.


Effects of Occupation, Gender, and Age


Highly physically-active individuals expend up to three times more energy in 24-hours than subjects with negligible bodily activity (56). As previously discussed, NEAT accounts for a significant proportion of the observed differences at the population level TEE. Thereby, occupation clearly represents the key determinant of NEAT (45). Indeed, NEAT can vary by as much as 2000 Kcal per day when comparing two adults of similar body size, lean body mass, age and gender (Figure 3).


For an average worker spending most of her/his time in a seated position, occupational NEAT is relatively low and associated energy costs range at a maximum of 700 kcal per day (Figure 3). A comparable person working mainly in a standing position can increase their occupational NEAT to up to 1400 kcal per day, while an agricultural occupation would theoretically result in NEAT categories ranging around 2000 kcal per day or more (Figure 3) (45). Thus, occupations relying on intense physical activity can expend 1500 kcal per day more than a sedentary job.
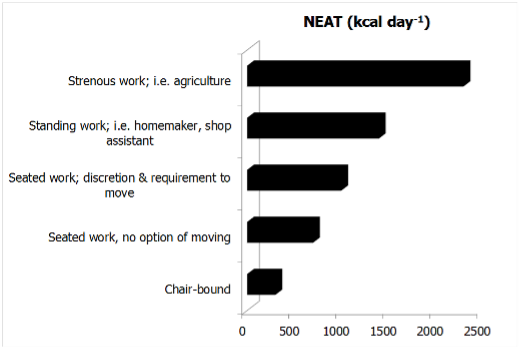
 

Figure 3. The effect of occupational intensity on NEAT (adapted from (45)). The data assume a BMR of 1600 kcal per day.


This variation in daily NEAT between individuals and populations becomes even more accentuated when considering research from non-industrialized countries (57, 58). For instance, a study by Levine and colleagues included more than 5000 inhabitants of agricultural regions of the Ivory Coast of Africa (Figure 4).
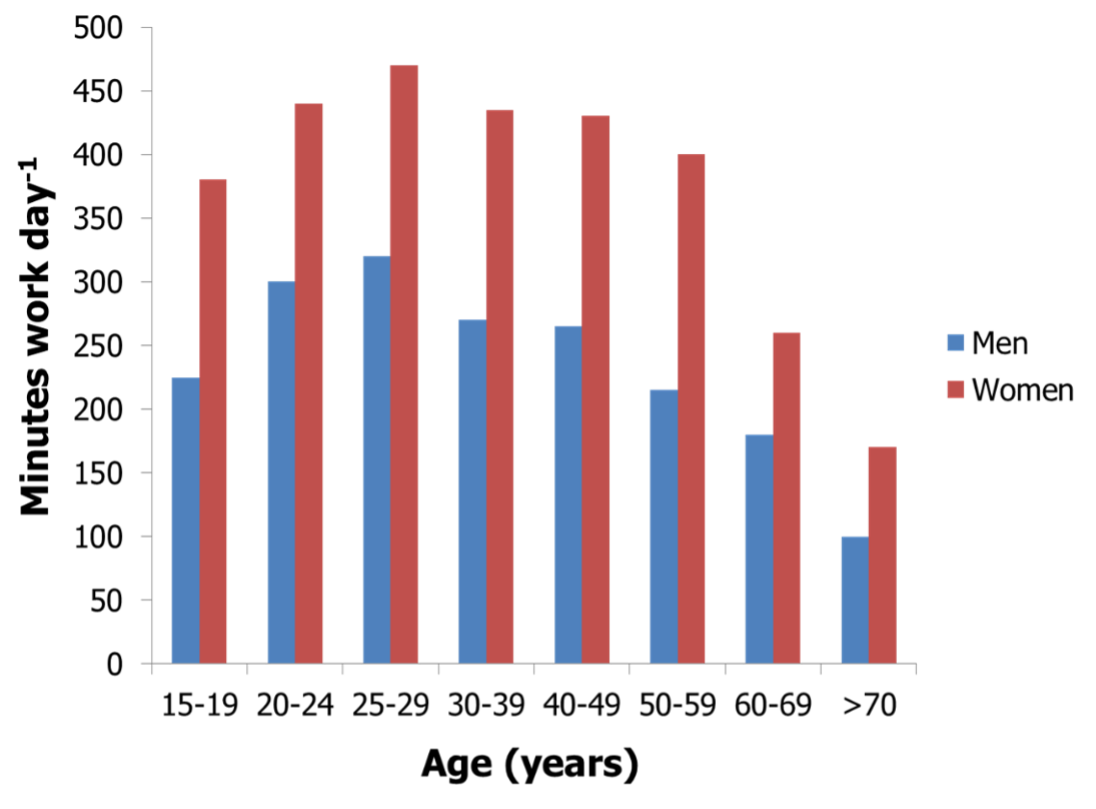
 

Figure 4. Gender- and age-dependent physical activity levels (time engaged in work activities) of people living in agricultural communities of the Ivory Coast in Africa (adapted from reference (58)).


Each subject was studied over seven days and all of their daily tasks were recorded by a trained evaluator (58). Several lines of available evidence regarding NEAT were established from this study. First, a substantial effect of gender was observed as women apparently worked more than men in these societal constructs. Women were responsible for more than 95% of domestic and for an additional 30% of agricultural tasks. Otherwise, men exclusively worked in agricultural occupations and had more leisure time, resulting in substantially lower NEAT than women (45, 58). In contrast, men in Canada, Australia or the United Kingdom are reported to be up to three times more physically active than females, while data from the United States indicate comparable activity levels of genders (59, 60). Even less data is available on NEAT in children, but in general boys seem to be reproducibly more active than girls (61, 62).


A second important observation from the study of Levine et al. is the fact that decreased occupational NEAT was observed with aging (Figure 4) (58). An age-related decline of NEAT had been previously reported across species (63). The underpinnings for this age-effect on NEAT in free-living humans has been reported by Harris et al. (64), who showed that the substantial decrease in elderly as compared to younger subjects was mainly attributable to the ambulation subcomponent of NEAT. Elderly subjects walked less distance despite having a comparable number of daily walking periods compared to their younger counterparts. Indeed, elderly subjects performed 29% less non-exercise activity, corresponding to three miles less ambulation per day (64).


A further factor that should be considered to potentially impact NEAT could be sleep restriction. It was shown that subjects with 5.5 compared to 8.5 hours nighttime sleep opportunity had 31% fewer daily activity counts, spent 24% less time engaged in moderate plus vigorous physical activity and became more sedentary (65). However, the significance of these findings is currently limited to time spans over few weeks and it remains therefore unclear as to whether the results are also valid in terms of common problems, such as chronic sleep insufficiency or shift working. Although, some short-term experiments support the latter findings, conflicting data have also been reported on that matter (66–69). Future research will need to validate these associations and, if true, better understand mechanisms underlying restricted sleep time and alterations in PEE/AEE. Sleep restriction should be nevertheless regarded as potential biasing factor in future research projects on NEAT.


Industrialization and Societal Status


Industrialization and societal status are distinctive factors affecting NEAT. Urban environment and mechanization are associated with a decrease in daily physical activity. For example, it was shown that sales of labor-saving domestic machines (e.g. washing machines) and obesity rates are closely correlated in the U.S. population, while this association was not present with respect to energy intake (20, 22). Furthermore, it is known that poverty and societal aspects comprising neighborhood and educational status are associated with increased consumption of energy-dense foods, which is thought to contribute to higher obesity rates reported in lower socioeconomic groups (70, 71). Highly educated individuals report more leisure-time physical activity and are three times more likely to be physically active as compared to less educated individuals (20, 22).


Seasonal Effects


Seasonal variations also play a role for NEAT. Time spent in activity is twice as likely during the summer as compared to winter months and contributions to activity from agricultural or construction work plays a greater role in the summer season (20).


Together, available data indicate close relationships between environmental conditions and biological aspects of NEAT. Evidence suggests that the contribution of occupational activity to NEAT can vary by 2000 kcal per day. Since the accumulation of excess body fat is a result of positive energy balance, subtle perturbations of energy balance over sustained time periods are theoretically capable of contributing to unwanted weight gain. But once weight stability is again established at a higher weight, energy expenditure and energy intake need to be precisely matched to achieve a long-term persistency of body mass, as an error of 1% would lead to a gain or loss of 1 kg per year or some 40 kg between the ages of 20-60 years. Therefore, small alterations of energy balance by means of NEAT could theoretically result in significant effects with respect to severity of obesity in an individual and the prevalence of obesity in a population. Consequently, when considering how to influence NEAT as a strategy for the treatment or prevention of obesity, a central question arises: In what fashion does NEAT interact with another environmentally-influenced factor involved in energy balance, that of energy intake?


Alteration of NEAT with Varying Energy Availability from Foods


Alteration of energy balance is followed by multiple adaptations, but relatively few studies have addressed modulation of spontaneous physical activity and NEAT by variations in nutritional energy intake. The latter is part of the concept of adaptive thermogenesis (72).


Adaptive thermogenesis refers to changes in REE, EAT and NEAT, which are independent of changes in LBM and are, instead, modulated by other factors, including increased or decreased caloric intake (72). With caloric restriction, both REE and non-resting energy expenditure substantially contribute to changes in adaptive thermogenesis (72). Interestingly, in most studies, alterations in adaptive thermogenesis in response to overfeeding are in large part explained by raised non-resting energy expenditure (e.g., NEAT). However, the individual ability to adapt NEAT to manipulations of energy balance is highly variable between subjects and situations, particularly with respect to overfeeding (39). But if an individual is able to generate a significant upregulation of NEAT in the face of positive energy balance brought about by an increase in food intake, they may be more able to prevent obesity (34).


 NEAT UNDER CONDITIONS OF OVERFEEDING


As discussed above, by using a combination of direct calorimetry and motion detectors, Ravussin et al. have shown that the inter-person variability of TEE is considerable and remains significant even after adjustment for LBM (29). A substantial percentage of this variability is explained by differences in spontaneous physical activity including “fidgeting” (29). Fidgeting-like activities accounted for a range in energy expenditure of 100-800 kcal per day in the subjects. Interestingly, the researchers observed elevated spontaneous physical activity levels in subjects with obesity as compared to those who were lean, indicating a positive relationship with elevated body mass. However, the latter study was performed under isocaloric conditions and over a short observation period. Therefore, the importance of this report was to establish the significance of spontaneous physical activity for energy balance, but whether acute variability in energy intake affects NEAT was not addressed. In their “weight clamping” study, Leibel et al. (73) overfed adults who were lean and overweight/obese by 10%, or approximately with 5000-8000 kcal per day over 4-10 weeks, followed by a weight maintenance period. Body composition, fecal caloric loss, TEE, REE, TEF and spontaneous physical activity were measured using multiple technical approaches including indirect calorimetry, the doubly labeled water method, and activity trackers in a subgroup (73). They showed that maintaining a 10% elevated body mass induced a significant increase of TEE by 9±7 kcal per kg LBM per day in subjects who had not been previously obese and by 8±4 kcal per kg LBM per day in those who had formerly been obese (73). The majority of this rise in TEE was attributable to non-resting energy expenditure. The magnitude of this effect was comparable in those who had previously not been obese and those who had been overweight or obese, indicating similar adaptations to overfeeding conditions (73). However, a related review pointed out the large inter-individual variability regarding the capability to adjust energy expenditure with overfeeding in the “weight clamping” experiments (46) and emphasized that in other human over-feeding studies there is a wide range of individual weight gain per unit of excessively consumed energy. Therefore, it can be proposed that some individuals show a remarkable capacity to increase energy expenditure in response to overfeeding, while others do not (46). It was further suggested that spontaneous physical activity, and accordingly NEAT, likely play an important role regarding the impact on body weight under such conditions.

Levine’s group was the first to systematically investigate the effect of overfeeding on the individual ability to adapt NEAT in free-living subjects (53). Using sophisticated methods and measuring NEAT over a representative time span, the authors overfed 16 volunteers (12 males, 4 females; age ranging from 25-36 years) by 1000 kcal per day over their weight maintenance requirements (20% of the calories came from protein, 40% from fat, 40% from carbohydrates). The energy surplus was paralleled by a mean TEE increment of 554 kcal per day. In this study 14% of this TEE increase was attributable to a rise in REE, approximating by 79 kcal per day. A further 25% of the TEE increment (136 kcal per day) corresponded to an increase in TEF, probably due to the relatively high percentage of protein intake. The most prominent effect was, however, attributable to enhanced physical activity thermogenesis, corresponding to around 336 kcal per day. As volitional exercise of the study subjects remained at a constant low level and since the authors did not detect changes in exercise efficiency, they concluded that about 60% of the increase in TEE due to overfeeding was attributable to NEAT (53). Again, however, the change in NEAT varied remarkably between subjects, ranging from -98 to +692 kcal per day. The maximal individual increase of NEAT constituted 69% of the excessively consumed 1000 kcal per day in this study (74). Moreover, the change in NEAT was directly predictive of the individual vulnerability or resistance to body fat accumulation (53).


A recent randomized study enrolled young aged female and male participants with variable BMI (19-30 kg/m2) and used gold standard methods to investigate not just the effect of caloric overfeeding, but also of protein intake on PEE/AEE (75). 140% of caloric needs including 5, 15, or 25% of energy from protein was fed for 56 days. Caloric overfeeding resulted in increased physical activity and correspondingly PEE/AEE including NEAT, even after adjustment for changes in body composition. By contrast, changes in physical activity were not related to protein intake. The authors concluded that increased PEE/AEE in response to weight gain might be one mechanism of modulating adaptive thermogenesis (75). But the results indicate also that the observed increase in activity was not likely effective at attenuating weight gain.


Other recent reports have failed to detect compensatory increases in spontaneous physical activity during short-term overfeeding in humans (76–80). While in several cases, methodological differences make them less directly comparable to Levine’s study, (76, 56, 77, 79), a study by Siervo et al. used state-of-the-art methods and applied a highly standardized 17-week protocol with progressive overfeeding from 20-60% energy in excess of maintenance needs (81) in lean, healthy men. Three sequential intervals of stepwise overfeeding were each separated by one week of ad libitum energy intake. In agreement with previous findings, between-subject variability concerning weight change during ad libitum phases was high (63). However, in contrast to Levine’s study (53), Siervo et al. failed to detect a significant systematic change in spontaneous physical activity (81). The authors therefore concluded that systematic elevations in energy intake induce very limited counter-regulatory responses in energy expenditure (63).


In summary, these data underscore the highly individual compensatory response regarding adaptive thermogenesis to overfeeding. From Levine and Apolzan et al., supportive evidence is provided for the susceptibility to gain body mass under standardized overfeeding conditions and identifies an individual’s ability to adapt NEAT as a potential modulator (75, 53, 20, 34). In accordance with findings of other overfeeding studies (reviewed in (74)), adaptations in thermogenesis by changes in NEAT observed between individuals may explain why some individuals are particularly susceptible or resistant to weight gain. The potential impact of age on these adaptational mechanisms remains unclear and should be addressed by future research.


THE IMPACT OF CALORIC DEPRIVATION ON NEAT 


While evidence with respect to systematic NEAT upregulation under overfeeding conditions remains somewhat controversial, TEE and spontaneous physical activity are consistently influenced with energy deprivation in the majority of available studies (72, 80). This is of importance as most subjects who are overweight or have obesity try to lose body mass through various calorie-restricted dietary strategies.


The first study to quantitatively investigate adaptive thermogenesis under conditions of food restriction was the Minnesota Starvation Experiment (reviewed in (46, 49, 72)). This evaluation showed a marked reduction in TEE that was later reproduced by numerous studies, independent of pre-starvation BMI or method used to induce weight loss (reviewed in (72)). For instance, Leibel et al. in a second arm of their “weight clamping” experiment evaluated the effect of a 10% body mass reduction, followed by weight maintenance at this level (73). While overfeeding was accompanied by a 16% increase of adjusted TEE, weight reduction from underfeeding induced a 15% decrement (57). As compared to overfeeding, it is well accepted that both REE and non-resting energy expenditure are affected by energy deprivation in humans and animal models (82, 72, 80).


These findings are supported by results from the so-called Biosphere 2 experiment, where the authors demonstrated a major reduction of TEE and spontaneous physical activity with body mass reduction over a two-year time period, which persisted after six months of body weight regain (46, 83). Demonstrated TEE reductions by adaptive thermogenesis in weight-regainers has been reproduced in other human studies (72). Of note, when subjects recover from starvation they spontaneously overeat and, moreover, if weight loss-induced adaptive thermogenesis persists (e.g. reduced NEAT), there is a significant risk of regaining weight and “overshooting” pre-starvation body mass (72). Thus, changes in non-resting energy expenditure with underfeeding (or overfeeding) appear to occur in a direction tending to return subjects to their initial body mass and to conserve body energy as recently described in humans as so-called “thrifty phenotype” compared to a “spendthrift phenotype” (84).


Regarding this, findings from a recent study in sedentary overweight females are of potential practical relevance (85). In this investigation, 140 pre-menopausal females reduced their body mass by an average of ~11 kg while undergoing a total of 800 kcal per day diet. Subjects were randomly assigned to one of three groups: no exercise, a structured aerobic training schedule, or an exercise program incorporating resistance training. Body composition, strength, TEE, REE and NEAT were measured using various approaches. One main finding was that TEE, REE and NEAT all declined with weight loss in the no-exercise group. Non-exercise activity thermogenesis was reduced by 150 kcal per day, which was equivalent to 27% compared to baseline levels. However, in subjects undergoing the exercise regimens only REE was reduced, while NEAT remained unaffected. Thus, since caloric deprivation appears to consistently decrease spontaneous physical activity, untrained subjects with obesity who plan to lose body mass by means of dietary intervention alone would be advised to engage in a concomitant exercise program so as to avoid negative effects on NEAT and mitigate weight cycling after reaching a lower body weight. Of note, the authors of this study emphasized that, consistent with the concept that “more is not always better,” exercising two days a week was capable of increasing NEAT but, paradoxically, an intense three days weekly schedule was followed by a substantial decrement in NEAT (85).


At this end, one further study of Levine’s group should be considered (78). NEAT as measured by gold standard methods and posture allocation was evaluated in mildly obese subjects and normal weight controls over a period of ten days. This baseline evaluation showed a 164 minute per day longer seated time in obese compared to lean subjects. A subset of eight obese subjects then underwent an intentional weight loss program over a time span of eight weeks and thereby lost significant body weight. Posture allocation was measured for another ten days after intervention. Interestingly, the weight losing obese subjects did not further reduce their NEAT in this experiment (78). The latter study has several limitations, e.g., the small number of enrolled subjects and the relatively short intervention period when compared to some of the above-mentioned trials. Levine and colleagues themselves emphasized that it was a pilot experiment (78). The data otherwise suggest that interindividual differences in posture allocation could at least in part be biologically determined and are therefore not necessarily influenced in every individual by e.g., reduced energy intake over short time periods. Over- and underfeeding studies in identical twins indeed suggest an important role of genetics regarding the variability underlying body mass regulation (86, 87). Specifically regarding NEAT, it is likely that due to the polygenetic nature of obesity, numerous pathways are involved in the regulation of spontaneous physical activity, as the latter has multiple environmental cues and affects a multitude of behaviors (8, 88). Zurlo et al. have shown that spontaneous physical activity levels cluster in families and could prospectively help to explain the propensity for weight gain (89). Moreover, according to a recent review up to 57% of the variability of spontaneous activity has been attributed to inheritance (90).


Otherwise, biological and genetic determinants can only partially explain NEAT variance. Models of human energy budgets related to exercise can provide a conceptual framework to better understand NEAT regulation in humans (reviewed in (39)). For instance, the so-called independent model predicts that changes in basal TEE have no impact on the energy budgeted for behavior, e.g., spontaneous physical activity. This model is analogous to the factorial model of exercise in humans that assumes that exercise has an additive effect on TEE (39). In contrast, the allocation model suggests that the total energy budget is constrained, and therefore, an increase in the energy cost related to maintaining basal functions will reduce the amount of available energy to support other functions, finally altering an individual’s behavior (39). The independent model would for example predict that exercise additively increases TEE, while the allocation model predicts that exercise leads to a reduction in some components, e.g., NEAT. Indeed there is evidence that each of these models is evident in different human populations, although studies suggest that e.g. allocation may be affected by confounders such as age (older more likely to reallocate), sex (males more likely to reallocate), and exercise volume (allocation more likely with higher volumes)  (39). Such aspects have to be considered and could help to integratively explain the contradictory findings of Levine et al. and from other researchers.


In summary, an integrative view of existing human overfeeding studies proposes that the magnitude of adaptations regarding energy expenditure varies largely between individuals. Subjects capable of responding with increased spontaneous physical activity to overfeeding can be categorized as “compensators” and are therefore less susceptible to obesity (“spendthrift phenotype”). Subjects unable to respond to a continued energy surplus with increased NEAT (e.g., “non-compensators” or “thrifty phenotype”) seemingly represent the majority of subjects on a population level, of which a major percentage will attempt dietary weight-loss strategies at some time in their lives. However, REE and non-resting energy expenditure including NEAT are reduced with underfeeding in the majority of subjects. They therefore represent a risk factor for weight regain after dietary intervention. Mild voluntary exercise during and maybe shortly after periods of dietary weight loss could be a promising strategy to avoid decreases in NEAT, although this alone will probably not fully compensate for the obligate decline in REE. Whether the majority of dieting subjects with obesity will continuously adhere to a structured exercise program during extended periods of weight maintenance as suggested by current recommendations is also uncertain (and unlikely) (42, 8, 43, 41). 


Therefore, to advance anti-obesity strategies that systematically increase or even conserve NEAT it is essential to understand the mechanisms contributing to regulation of spontaneous physical activity.


PHYSIOLOGICAL AND MOLECULAR DETERMINANTS OF NEAT


Principles of NEAT Regulation


The ability to adapt thermogenesis, and specifically NEAT, presupposes existing mechanisms in the body that sense, accumulate, and integrate internal and external directionality signals with respect to energy balance (20). Figure 5shows a proposed model of the principal regulation of spontaneous physical activity and correspondingly NEAT. In this model, physiological data regarding caloric intake, energy depots and energy expenditure are compiled centrally by the brain. These signals converge at the data acquisition center, are rectified to a common signal, and directed to a NEAT accumulator, which is constantly summing the net amount of NEAT per unit of time. The latter continuously refers to the energy balance integrator, which, in turn, modulates spontaneous physical activity in response to changes in energy intake. Thereby, energy balance resulting from these three components is in constant flux.
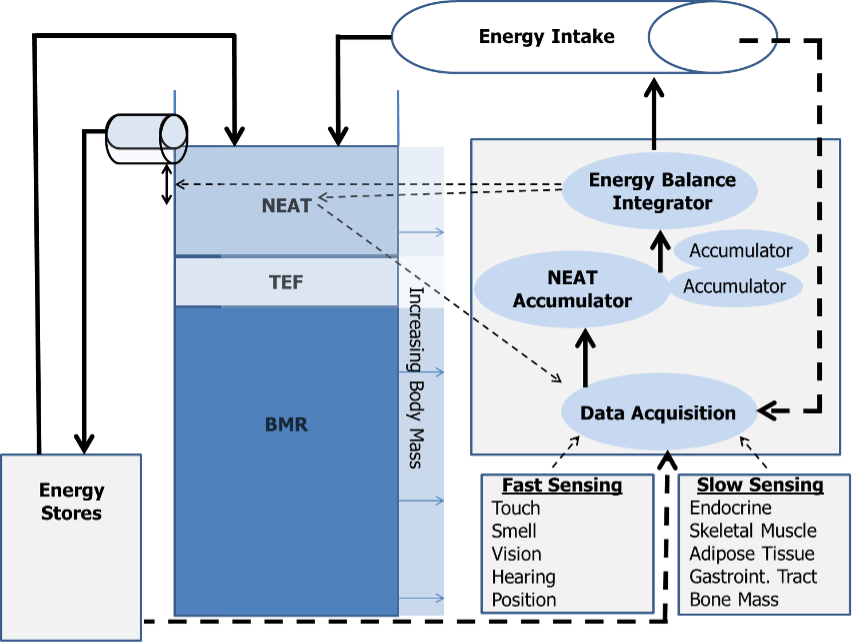
 

Figure 5. The NEAT hypothesis of energy balance (adapted from (20)).


Continuous arrows represent energy flow through the system, broken arrows stand for putative signaling pathways. BMR, basal metabolic rate; NEAT, non-exercise activity thermogenesis; TEF, thermic effect of food.


For example, under circumstances of positive energy balance during increased food intake, the energy balance integrator may mediate deposition of the caloric surplus in energy stores (adipose tissue) or alternatively dissipate the excess energy in the form of NEAT. More likely, since BMR is essentially fixed, some energy will be spent on food digestion and absorption (increased TEF), some will be deposited as body fat or in other depots, and the rest will be dissipated as NEAT (20). This model also supports the observation that although BMI and energy balance are continuously oscillating around a weight set point (or “set range”) under daily life conditions, body mass is remarkably stable in the long term. This is exemplified by data from the Framingham Study showing a mean body mass increase of only 10% over a 20 year time span in average adults (cited in (91, 92)).


Thus, it appears that the regulation of energy balance and body mass is realized by a complex network of precisely working auto-regulatory structures controlling effector systems, one of which being spontaneous physical activity. However, while ample available data detail the regulation of food intake, there is lack of information concerning the biological mechanisms driving NEAT (34). Most animal evidence supports the concept that NEAT can help to protect against obesity (93). Therefore, spontaneous physical activity has certainly potential for impacting body mass and energy balance. It is very likely that many of the biological systems involved in the regulation of energy intake are also involved in gathering and integrating information regarding NEAT and determining NEAT adaptation in humans (34).


Tissues, Organs, and Central Mechanisms Involved in NEAT Regulation


Several well-described central neuroendocrine systems are thought to regulate NEAT through interactions with peripheral tissues/organs known to affect energy balance (Figure 6).


Figure 6. Model for the neuroendocrine regulation of NEAT in the service of energy balance (adapted from (34)). Multiple external and internal signals are sensed and integrated, whereby defined brain structures (e.g., arcuate nucleus of the hypothalamus, area postrema and nucleus of the solitary tract of the hindbrain, dopamine pathway of the mesolimbic system) interpret a multitude of sensory cues of energy availability. The involved brain systems have multiple ascending and descending projections affecting the amount of physical activity through arousal and limbic pathways, and descending neural projections and endocrine signals to modulate the energy efficiency of physical activity. Thereby, the central nervous system could adapt NEAT to adjust energy balance under conditions of caloric excess or starvation. Ach, acetylcholine; AgRP, agouti-related peptide; CART, cocaine- and amphetamine-regulated transcript; CCK, cholecystokinin; LC, locus ceruleus; MCH, melanin-concentrating hormone; NPY, neuropeptide Y; POMC, pro-opiomelanocortin; (P)SNS, (para-)sympathetic nervous system; SNS, sympathetic nervous system; TMN, tuberomammilary nucleus; VP, ventral pallidum


These associated neural mechanisms of brain regions involve a multitude of neurotransmitters and neuropeptides (for extensive review see (34) and (94)). While all are important, this section will focus on the biological role of central orexin peptides as promising and potentially targeted regulators of spontaneous physical activity (for extensive review see (47)).


Experimental data indicate that injections of orexin A into defined brain regions reproducibly induce a dose dependent increase in spontaneous physical activity along with significant increments in NEAT. Moreover, current knowledge suggests a role for the orexin system in the control of arousal and sleep, and for reward and stress reactions. This has led to conduction of extensive research showing that the orexins A and B are produced by cleavage from a single pro-peptide (44). The majority of orexin A is synthesized in the lateral hypothalamus and perifornical area. Orexin A binds to two G protein-coupled receptors, namely orexin receptor type 1 (OXR1) and 2 (OXR2). OXR1 has high affinity for orexin A, while OXR2 has equal affinity for the A and B peptide. Receptor binding of orexin A is associated with increased intracellular calcium levels and followed by enhanced neuronal signaling (44).


Physiologically, orexin A is capable of modulating spontaneous physical activity, food intake, and sleep as evidenced by an obesity-resistant rat model with high orexin A activity (34). These animals show more ambulatory and vertical movement, independent of age or food availability (34). Intriguingly, this rat model exhibits lower body weight gain when fed a high-fat diet, despite consuming significantly more kcal per gram body mass. From this study, it appears that orexin A simultaneously enhances feeding behavior and induces physical activity, but the consumed calories are outweighed by those expended with spontaneous physical activity (47, 34). These data were confirmed by a mouse model with postnatal loss of orexin neurons (47). These mice exhibit hypophagia, decreased spontaneous physical activity, and develop spontaneous-onset obesity while consuming a regular chow-diet. Furthermore, in recent years so called DREADDs (Designer Receptors Exclusively Activated by Designer Drugs) have been developed and were applied to manipulate orexin neuron activity in specific animal models. Compared with previous work of targeted infusions of orexin and/or orexin agonists into the brain, the use of DREADDs allows for the sustained activation of the neurons of interest without needing to inject directly into the brain (95).


A high-fat diet model was used to evaluate the effect of DREADDs on NEAT, since spontaneous physical activity can be decreased under such circumstances. It was shown that NEAT was decreased in animals on the high-fat diet, and was increased to the NEAT level of control animals following activation of orexin neurons with DREADDs (95). Thus, these preliminary results clearly support the hypothesis that the orexin signaling system could be a promising target of modulation by drugs.


However, from the perspective of humans, data on orexin are currently scarce. Otherwise it was recently shown in a pilot study that plasma levels of orexin A correlated with physical activity levels including many NEAT features (96). Therefore, plasma orexin A could be considered as a biomarker of NEAT in future studies. Furthermore, the orexin system has been shown to be defective in the sleep disorder narcolepsy. Since obesity is a recognized comorbidity of narcolepsy in both animal models and humans (47), regulation of this signaling system has the potential to impact clinical endpoints, probably including the development of overweight and obesity.


The Role of Peripheral Tissues for NEAT Regulation: Adipose Tissue and Adipokines


Peripheral tissues are also believed to contribute to NEAT regulation (Figure 6). That NEAT can be influenced by over- and underfeeding has been extensively discussed in earlier sections; but it is essential to also reconsider that longitudinal studies of fasting humans show significant decreases in adaptive thermogenesis with starvation, while refeeding may induce a variable elevation (72). These adaptations are likely the result of feedback mechanisms between thermogenesis regulation and energy depots (Figures 5 and 6). It can be further hypothesized that adaptations of thermogenesis in response to fasting or overfeeding result, at least in part, from an adipose tissue-specific impact on thermogenesis (reviewed in (46)). Indeed, studies of white adipose tissue (WAT) have led to the recognition that this energy store represents an important endocrine organ communicating with the brain through secretion of so-called “adipokines.” Accordingly, adipokines could play a role for NEAT regulation (Figure 7) (97).
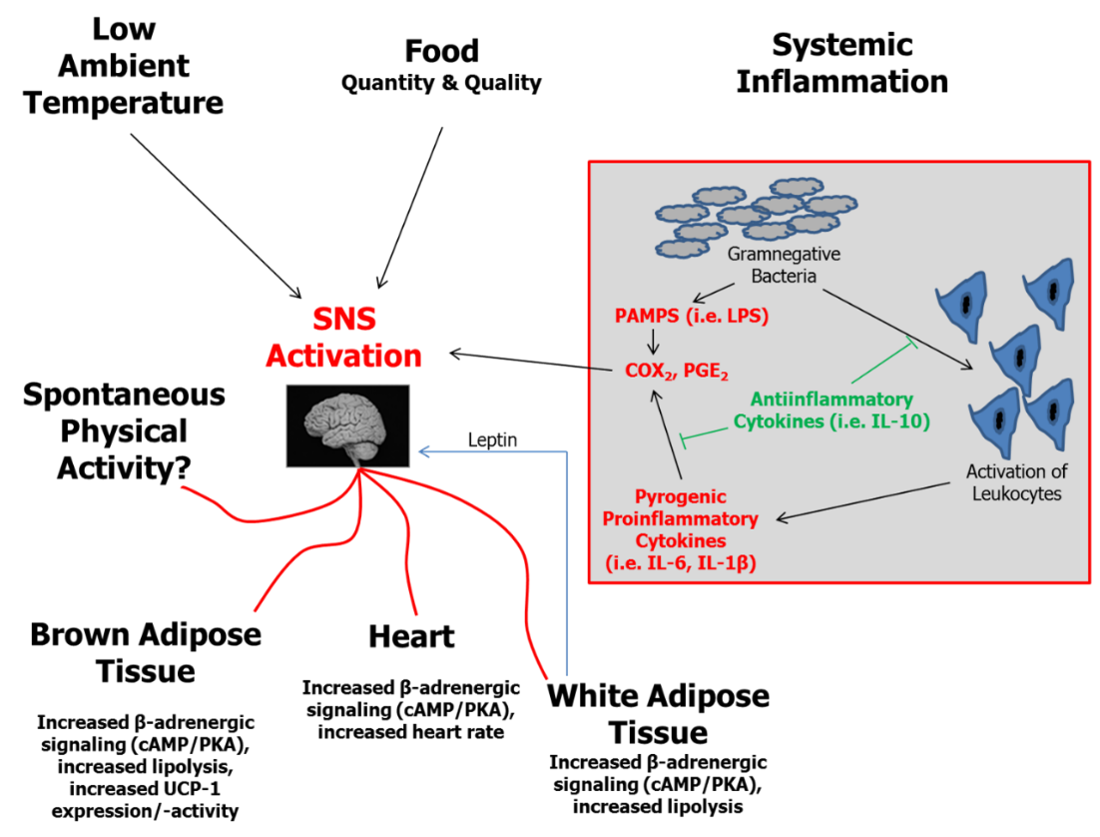
 

Figure 7. Essential elements in the regulation of thermogenesis including effects of WAT (adapted from (34, 98)). BAT, brown adipose tissue; cAMP, cyclic 5” adenosine monophosphate; COX, cyclooxygenase; IL, interleukin; LPS, lipopolysaccharide; PAMPs, pathogen associated molecular pattern; PGE, prostaglandin E; PKA, protein kinase A; SNS, sympathetic nervous system; UCP, uncoupling protein; WAT, white adipose tissue.


Leptin is such an adipokine signal that is the product of the rodent obese (ob) gene and human homolog (LEP) first characterized in 1995 (99). Due to its role regarding the sensing of energy stores and regulation of food intake, it was also suggested as an important signal with respect to adaptive thermogenesis (reviewed in (34, 98)). For instance, Dauncey and Brown studied ob⁄ob mice lacking leptin production and their lean littermates at comparable body weights (100). Leptin-deficient mice expended less energy and showed less motor activity as compared to control animals. The energy expended relative to metabolic size was greater in lean littermates, who were also more active than the ob⁄ob mice. It was calculated that activity-related energy expenditure accounted for at least part of the body mass difference observed between ob⁄ob and wild-type mice (100, 101). A central mediator of leptin action on NEAT partly includes the orexin signaling system, since the activity of orexin neurons has been shown to be modulated by leptin among other metabolic indicators (reviewed in (93)).


With respect to humans, Franks et al. have shown that fasting leptin levels were significantly associated with physical activity-related energy expenditure (101). Moreover, it was pointed out in a recent review that replacement of leptin in weight-reduced subjects was capable of reversing neuroendocrine adaptations that accompany caloric reduction as evidenced by an increase in SNS activity, suggesting that this component of the non-resting energy expenditure and adaptive thermogenesis is at least in part under endocrine control (72). In response to caloric restriction, the authors therefore suggest an adaptation model where in an initial fast “first set,” reduced insulin secretion and glycogen stores are accompanied by a reduction of both REE and non-resting energy expenditure within days, while in the long term, with maintenance of reduced body weight, a “second set” mediated by a drop in leptin levels becomes active that keeps energy expenditure low so as to preserve fat depots and maintain reproductive function (72). This endocrine action resulting from the drop in leptin levels with related activation of multiple pathways then enhances the risk of weight regain (72).


Overall, available data suggest that leptin’s central actions include not only reducing food intake but potentially also increasing energy expenditure mediated, in part, through increasing physical activity levels (reviewed in (34)). The potential role of leptin on NEAT in human obesity is of particular interest given the phenomenon of central leptin insensitivity under conditions of overfeeding and related obesity (102, 103). However, it must be also kept in mind that the leptin system represents only one component of peripheral tissue signaling that impacts NEAT. Other endocrine systems, such as thyroid hormone status, also have major influences on energy expenditure. For example, hyperthyroid rats have been shown to have significantly increased NEAT (104).


Energy availability from food and internal energy stores, ambient and body temperature, and systemic inflammation are further determinants of thermogenesis regulation. In WAT, two relevant factors converge: WAT represents the principal energy storage depot and, under conditions of significant obesity, WAT is a site of low-grade inflammatory activity that contributes to systemic inflammation. Recent epidemiological data from humans support this hypothesis (105). It was shown that levels of systemic low-grade inflammation (e.g., circulating interleukin-6 and interleukin-1β) were related to non-exercise physical activity. Although no causal relationship can be drawn from these findings, inflammation is theoretically one signaling system involved in NEAT regulation.


Signals from WAT can induce enhanced sympathetic nervous system (SNS) activity and affect downstream regulators of adaptive thermogenesis (Figure 7). Indeed, experimental data indicate that NEAT is one component affected by WAT signaling (93). Related to the hypothesis of “adaptive thermogenesis”, Dulloo et al. in their review regarding human starvation and overfeeding suggest SNS as key regulatory effector mechanism (46). Of note, activation of brown adipose tissue, which has recently gained a lot of interest with respect to human obesity (106–108), is suggested to be an additional site of adaptive thermogenesis.


Skeletal Muscle as Peripheral NEAT Modulator


Skeletal muscle is a major contributor not only to REE, but also to spontaneous physical activity and has been newly recognized as important NEAT effector. Human subjects maintaining a 10% weight loss in response to caloric restriction have increased skeletal muscle work efficiency (92, 109). This mechanism is believed to be responsible for the phenomenon that, even after adjustment for the reduced body mass, weight-loss maintaining subjects need proportionally fewer calories for performing comparable physical-activity tasks compared to before weight loss (92, 109). Therefore, adaptations of skeletal muscle work efficiency can contribute to reduced NEAT after low-calorie induced weight loss. Several recent animal models are in line with this hypothesis (82, 110). For example, a recent study in rats investigated the contribution of REE and non-resting energy expenditure to reduced TEE observed after three weeks of 50% energy deprivation (82). They reported a 42% reduction in TEE, even after correction for the loss in body weight and LBM (82). Moreover, 48% of the detected TEE reduction was explained by a significant decline in non-resting energy expenditure, e.g. spontaneous physical activity (82). Reduced baseline and activity-related muscle thermogenesis was also found in this study. Reduced skeletal muscle norepinephrine turnover as a surrogate of SNS drive and increased expression of the more energy “economic” myosin heavy chain (MHC) 1 isoform were identified potential mechanisms for the observed changes (82, 92, 109). Thus, according to these findings, restriction of caloric intake apparently not only suppresses spontaneous physical activity, but in addition reduces related caloric demand, which is mediated by reduced SNS activity to skeletal muscle and altered expression of MHC isoforms. These findings are supported by data from another recent animal study investigating rodents with “high intrinsic physical activity” and counterparts with “low intrinsic running capacity” under eucaloric conditions (87). It was found that animals with high intrinsic physical activity were lean, had lower skeletal muscle economy along with increased skeletal muscle heat dissipation during activity. This resulted in higher TEE and NEAT and was related to increased activation of skeletal muscle by SNS (110).


Taken together, skeletal muscle is an intrinsic site for NEAT and not only of great importance quantitatively, but also represents an important effector system for NEAT mediated through modifications on the level of SNS activity and gene expression, particularly under conditions of altered caloric intake. Therefore, evidence indicates that NEAT is modified by a complex network regulation of central and peripheral systems. The latter involve a variety of redundantly organized immediate and delayed mechanisms, including central neuropeptides and signaling systems to and from peripheral tissues. Involvement of such biochemical signaling systems identifies spontaneous physical activity and NEAT as a potential site for pharmaceutical targeting. Pharmaceutical manipulation of such a system could be envisioned to either increase the amounts of activities people undertake, or elevate activity-related energy expenditure.


As stated in the introduction, obesity is associated with a many adverse health outcomes (1, 111). Energy expenditure in occupational activities has declined by a mean of 140 kcal/d since 1960 in the United States and this reduction is thought to account for a significant portion of the observed increase in mean BMI (reviewed in (1)).The latter hypothesis is supported by observational data showing that reduced energy expenditure of 100 kcal/d below expected values corresponds to a 0.2 kg/year weight gain, of which 0.1 kg/year are fat mass (112). In addition there is ample evidence from epidemiological, cross-sectional, and longitudinal studies showing that individuals with higher physical activity levels have lower mean body weight, gain less weight and fat mass over time, and show reduced weight regain after intended loss in body mass (113–117). Moreover, regular physical activity can moderate or even eliminate weight gain among those carrying a risk at the FTO (fat mass and obesity associated) gene variants ((118), reviewed in (93)). It has further been evidenced that  levels of habitual or spontaneous physical activity are positively related to reduced risk of major cardiovascular disease and premature mortality, while an increase of sitting time correlates with a raise in complications (119–123).


Associations of NEAT with Type 2 Diabetes Mellitus and NAFLD/MAFLD as Common Sequelae of Obesity


In industrialized countries the daily time spent sitting is estimated to be 6-7 hours per day, which is closely correlated not only with obesity rates but also with the incidence of T2D (120, 124). A plethora of data suggest, on the other hand, beneficial effects of lifestyle interventions on insulin resistance, metabolic control, pain and clinical endpoints in these patients (e.g. (125, 126), reviewed in (127)). In subjects with impaired glucose tolerance or prediabetes, lifestyle interventions have proven to decrease the incidence of T2D, of which prominent examples comprise the DaQuing Study, the Finish Diabetes Prevention Study, the Diabetes Prevention Program and others (128–131). This was newly confirmed by the lifestyle intervention and impaired glucose tolerance Maastricht (SLIM) trial, which has shown to impact clinical endpoints even four years after stopping the intervention (132, 133).


The prevalence of NAFLD/MAFLD parallels the pandemic rise in T2D. A recent meta-analysis indicates that on a global perspective more than 55% of T2D patients suffer from bland liver steatosis, while a further 37% show signs of non-alcoholic steatohepatitis (NASH) (reviewed in (127)). “NAFLD” was defined in the 1980s to describe excess hepatocellular lipid accumulation in absence of significant alcohol intake, autoimmune, or viral liver disease, and the course of this pathology was long believed to follow the so-called “two-hit hypothesis” (134). Manifestation of bland steatosis was defined as first hit, while histological signs of liver inflammation, fibrosis and hepatocyte injury were proposed as succeeding second hit (NASH). Insulin resistance has now been recognized as the most valid predictive parameter of NAFLD/MAFLD progression to NASH. Moreover, presence of insulin resistance puts these patients to an elevated risk of morbidity and mortality, while sedentary behavior constitutes a complementary risk factor and correlates with clinical outcomes (reviewed in (135, 127)).


Since physical exercise is capable of improving and maybe reversing insulin resistance, while short term decreases in physical activity reduce multiorgan insulin-sensitivity and in parallel increase liver fat (reviewed in (127)), it is reasonable to assume that physical activity represents a potent treatment modality for NAFLD/MAFLD. There is indeed some evidence from prospective controlled randomized intervention studies that liver fat can be reduced independently from changes in body weight by structured exercise regimens in a limited, yet significant manner, while effects on liver inflammation and fibrosis remain to be investigated (extensively reviewed in (127)). Although no direct research of NEAT effects on NAFLD/MAFLD is currently available, one well-designed study using brisk walking as an intervention has shown reduced liver fat after 6 and 12 months (136). This suggests that low to moderate intensity activities potentially impact hepatic steatosis, which should be further evaluated.


For weight maintenance purposes, current recommendations encourage subjects with obesity to engage in 200-300 minutes per week in activities as e.g. walking (8). Yet, patients with T2D show markedly reduced TEE (< 300 kcal per day), number of steps taken (<1500 per day), physical activity duration (<130 min per day), and activity related energy expenditure (<300 kcal per day) as compared to subjects without diabetes (137). Accordingly, only 28% of patients with T2D in the U.S. achieve the recommended physical activity levels and less than 40% engage in regular voluntary exercise (120, 138, 139). In line with this, recent observational studies have shown that reduced NEAT is related to measures of insulin resistance, glycated hemoglobin A1c, and other features of the metabolic syndrome, consistent with the hypothesis that increasing spontaneous physical activity could be beneficial for those with T2D and NAFLD/MAFLD (140–142). This is supported by data coming from the Nurses’ Health Study showing that regular walking at normal pace (e.g. 3.2-4.8 km h-1) was associated with a 20-30% relative risk reduction of T2D, while in another study, frequent walking was correlated with an equally remarkable risk reduction of mortality in T2D (120, 143, 144).


On the other hand, it must be acknowledged that data on NEAT, T2D and NAFLD/MAFLD are limited. First, evidence suggests interindividual differences in the response to a standardized exercise schedule at a given dose and there is, moreover, strong indication of genetic components to the variation in human trainability (reviwed in (145)). Second, available evidence almost exclusively comes from observational and cross-sectional studies. Furthermore, the data on lifestyle interventions on sequalae of insulin resistance and manifest T2D also have limitations (146). For instance the 10-year prospective randomized LookAHEAD study in T2D patients was stopped early based on a futility analysis, since the trial was unable to detect substantial effects on cardiovascular events, although the intervention group experienced significant weight loss (147). Otherwise, secondary analyses of this hallmark study were able to show that the magnitude of weight loss may be predictive of outcome measures (148). In more detail, obese and overweight subjects suffering from T2D were examined regarding the association of the magnitude of fitness change (n=4406 and weight loss (n=4834) over a median of 10 years of follow-up for the primary outcome. The primary outcome was a composite of death, cardiovascular disease, myocardial infarction, hospitalization for angina, and stroke. Subjects losing more than 10% of body mass in the first year of the intervention had a 21% lower risk of the primary outcome relative to participants with stable body mass or weight gain. Interestingly, achieving a > 2 metabolic equivalents (MET) fitness change was not significantly associated with the primary, but with the secondary endpoint (composite of coronary–artery bypass grafting, carotid endartectomy, percutaneous coronary intervention, hospitalization for congestive heart failure, peripheral vascular disease, or total mortality (148). Therefore, it appears that life style modifications are principally capable of beneficially modulating clinical endpoints in, while the optimal exercise (and lifestyle intervention) therapy for individuals with T2D, particularly with co-existing complications, remains unknown (120). These findings suggest that priority should be made for subjects who are obese to engage in any type of regular physical activity before T2D and NAFLD/MAFLD become manifest ((144), reviewed in (120, 8)). Accordingly, the “Step It Up! (The Surgeon General’s Call to  Action to Promote Walking and Walkable Communities)” program was recently released, focusing on promoting optimal health before disease occurs (149).


In summary, since EAT is negligible in the vast majority of subjects and NEAT represents the main contributor to daily PEE/AEE and therefore TEE in Western populations NEAT can be recognized as a major potential target for lifestyle modification in subjects suffering from T2D and probably also under conditions of NAFLD/MAFLD.


Personalized Approaches versus Environmental Re-engineering for Promoting NEAT


In free-living individuals, counterbalancing effects of an obesity-promoting environment involves addressing several central questions:


  • How can the amount of NEAT be increased or preserved under conditions of caloric restriction?


  • What are realistic goals for daily spontaneous physical activity and what are appropriate activities for increasing NEAT?


When aiming to prevent or treat obesity, it can be argued that in an obesogenic environment each person needs to increase physical activity levels (45). Alternatively, it could be argued that the epidemic of obesity needs to be addressed at the population level, since obesity has emerged as a result of environmental pressures that have led to decreased population-wide activity levels (e.g., more sedentary jobs, more time at work and less in leisure) (45). In reality, these contributors are not mutually exclusive. However, in order to substantially increase NEAT it is useful to categorize these perspectives as the “individualized approach” versus the “environmental re-engineering approach”(45). Accordingly, Levine and Kotz have developed the “egocentric” and the “geocentric” models, which provide a theoretical framework to understand important environmental determinants of NEAT from these two perspectives (20).The egocentric model focuses on a single person. Accordingly, environmental factors that impact a particular person’s spontaneous physical activity levels are considered, such as “my occupation”, “my transportation to work”, or “my leisure time activities” (Figure 8) (20). By contrast, the geocentric model is focused on how the environment impacts NEAT of multiple subjects, such as city planning to ensure walk-friendly or bike-accessible environments (Figure 8) (20). These models may help to elucidate how NEAT can be effectively modulated. 
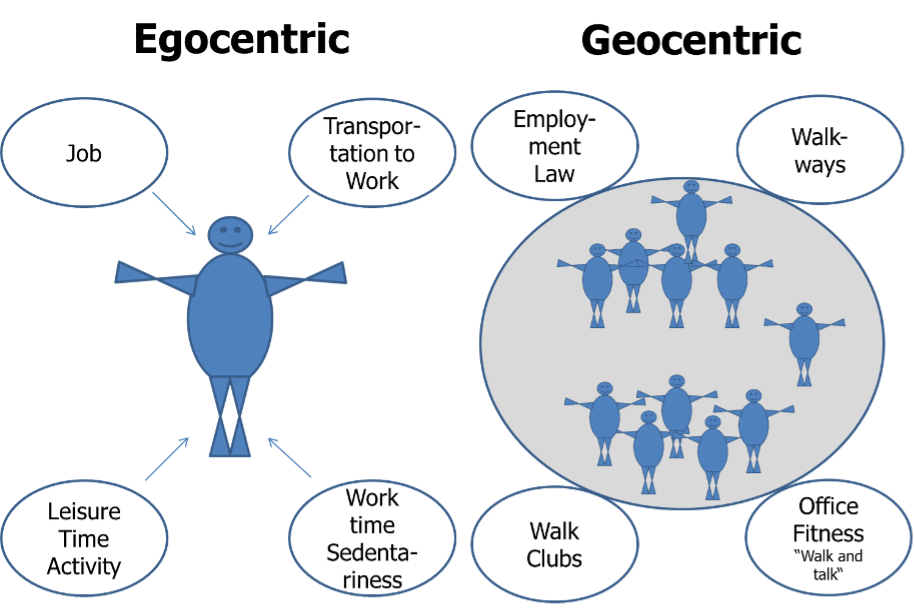
 

Figure 8. Environmental determinants of NEAT – the egocentric versus the geocentric model (adapted from (20)).


In the geocentric model a variety of environmental factors impact spontaneous physical activity. The most prominent negative influences on NEAT are represented by urbanization and mechanization, which are largely a phenomenon of high- and middle-income countries. Examples include televisions, drive-through restaurants, clothes washing machines, motorized walkways, and others (20).


Accordingly, when comparing daily energetic costs of mechanized tasks with the same tasks performed manually a century ago, the difference in daily energy costs approximates 111 kcal, or more than 40,000 kcal per year (150). Evidence such as this has been used in support of the proposal that urbanization and mechanization have likely had a dramatic impact on energy balance (20). Hence, proposals to increase NEAT on a population level have included environmental “re-engineering,” including provisions for adequate walkways, to build schools within walking distance, and to adapt employment laws for promoting office fitness. The problem with this argument is that it includes imposing high economic costs on business and localities without agreed upon standards for success (45).


It is self-evident that to intentionally increase NEAT over a protracted time period presupposes a significant amount of self-discipline. To facilitate behavior modification Levine has published approaches for promoting NEAT that focus on behavioral economic theory (for extensive review see (45)). Behavioral economic theory is a framework for conceptualizing how people make behavioral choices based upon their perceived relative value. When applied to NEAT, behavioral economic theory is concerned with how people choose between various activity/inactivity options. Consequently, Levine proposes four key elements (45): 1) It is critical to provide individuals with free-choice. By contrast, forcing a subject to choose a specific NEAT-promoting activity is likely to have the opposite to the intended effect. Otherwise, if an activity is self-selected, it is likely to be more reinforcing and consequently self-selected more often; 2) The delay between performing a NEAT-promoting behavior and the outcome needs to be minimized. While sedentary behaviors that people enjoy have immediately reinforcing consequences, health benefits of standing or ambulation may take longer to manifest. Therefore, it is important to choose NEAT-promoting physical activities; that are pleasing. For example, walking while listening to music or walk-and-talk with a friend. 3) Behavioral “costs” determine which sorts of activity/inactivity become selected. If a person has to work strenuously to participate in a given activity, they will be less likely to do it. For example, it is unlikely that many people will drive 40 minutes to the gym long-term just to engage in fitness training. People are more likely to choose physical activities that are easily accessible, such as home- or even office-based activities that do not require changing location or clothes; and 4) For an individual to choose a NEAT-promoting activity, it has to be more attractive than available alternatives. For example, behavior will change when providing a competing behavior that is more valued: a given person may prefer to surf the internet while seated rather than visiting the gym for a fitness workout. If, however, walk-and-talk with a friend was an option, the individual could choose that instead of internet-surfing. These behavioral components have been synthesized into a simplified approach termed, STRIPE (45): STRIPE is an acronym that represents S = Select a NEAT-activity that is enjoyed and start it; T = targeted, specific individual goals must be defined; R = rewards need to be identified for reaching the defined goals; I = identify barriers and remove them; P = plan NEAT-activity sessions; E = evaluate adherence and efficacy.


Overall, to increase NEAT in the prevention and treatment of obesity, egocentric and geocentric approaches should be considered. Occupation and leisure time are the two principal time frames that have to be targeted for promoting individual NEAT. To increase NEAT by means of changing behavior, the STRIPE approach is considered as safe and well-grounded in conceptual evidence. Unfortunately, there is no evidence as to whether an individualized or the population-based approach is more effective in terms of increasing physical activity levels and/or to affect body mass. Despite this, however, it is our opinion that both approaches should be still considered when counseling patients regarding ways they can improve their daily life conditions (45).


Increasing NEAT: Realistic Goals, Pitfalls and Appropriate Activities


Obesity is not a problem in only one component of energy balance and food restriction alone is surely not the complete answer on a long-term perspective. Hill et al. hypothesized that a person who is physically highly active could maintain energy balance and a healthy body weight by eating and expending at, say, an estimated 3000 kcal per day. This person, if adopting a sedentary lifestyle, could alternatively maintain energy balance and consequently body weight by eating and expending 2000 kcal per day. If, however, this sedentary person fails to strictly keep energy intake at 2000 kcal per day to match reduced energy expenditure over time, experiencing weight gain would be the unavoidable consequence (16). In other words, for a majority of subjects in a given population, maintaining energy balance at substantial higher levels by increasing NEAT could be in the long term much more realistic under free-living conditions (e.g. in an environment with high access to energy dense foods), than maintaining caloric intake at lower levels (16). Therefore, when attempting to increase NEAT, it is important to establish what goals have to be addressed for prevention or treatment of obesity. According to a review, the amount of physical activity necessary for weight loss approximates 2000-2500 kcal per week or about 2 ½ hours of additional daily ambulation, which is considered realistic for a majority of subjects with obesity (45). This is in line with current recommendations, suggesting ≥ 150 minutes per week of aerobic exercise in combination with a hypocaloric diet (8).


However, evidence is lacking from randomized, controlled studies as to whether strategies to promote NEAT in absence of dietary manipulation are effective for obesity prevention or treatment. Moreover, some lines of evidence suggest a compensatory upregulation of energy intake with rising physical activity energy expenditure, especially at higher workloads and energy expenditure levels (reviewed in (90, 112, 151, 80). Therefore, it remains unclear whether substantially increasing NEAT for body mass control under free-living conditions will be capable of inducing weight loss without caloric restriction. Probably this shows large inter-individual variability, since it was recently shown that subjects losing weight over a two year time span increased their daily activity by about 35 minutes, while subjects gaining weight showed a reciprocal decrease (113). Energy intake was comparable in both of these groups. Contrasting with that, subjects either losing body weight or weight maintainers did not show alterations in daily activity as compared to weight gainers in another study (152). Thus, even under real life conditions there might be “responders” and “non-responders” in terms of daily activity/NEAT and body weight control. These groups remain, however, to be better defined.


Recent work could help to better categorize “responders” and “non-responders” by applying the above mentioned constrained energy expenditure model (153). The authors hypothesized that total energy expenditure would increase with physical activity at low levels, while plateauing at higher activity levels. It was found that after adjusting for body size and composition, TEE is indeed positively associated with PEE/AEE, but the relationship was markedly stronger over the lower range of physical activity. For subjects in the upper range TEE plateaued (Figure 9). According to the author’s hypothesis, body fat and activity intensity appeared to modulate the metabolic response to physical activity (153). In other words, subjects who maintain high levels of physical activity in their daily lives could show a smaller response to attempts of further increasing NEAT as it contributes to TEE increment, while subjects with habitually low activity levels could increase NEAT contribution and can therefore possibly be categorized as “responders”.
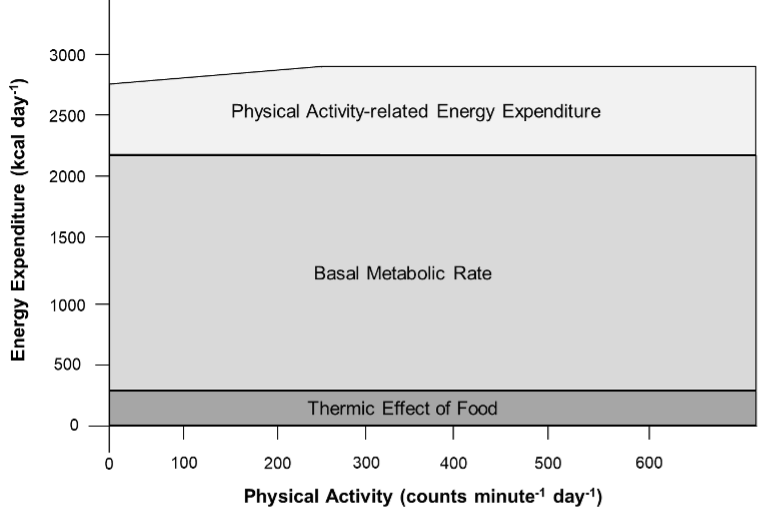
 

Figure 9. Effects of physical activity on PEE/AEE and its components (adapted from (153)).


Since hypocaloric diets can significantly reduce NEAT (see previous sections), a major goal has to include prevention of this reduction in NEAT. There is strong evidence that physical activity is essential for the prevention of weight regain after weight loss, and for weight maintenance (16, 80). For instance, it was shown that low physical activity levels are related to significant weight regain at follow up after hypocaloric diets (154). Furthermore, when subjects gaining weight under free-living conditions are compared to weight stable counterparts, the “weight gainers” demonstrated markedly lower physical activity related energy expenditure and less muscle strength (155). Of note, after a one year period, lower physical activity energy expenditure explained approximately 77% of body mass increase in the “weight gainers” as compared to “weight maintainers” (155). A recent meta-analysis on weight loss maintenance shows that physical activity has a significant treatment effect of approximately 1.6 kg in the short term (156). However, long term this effect was lost, probably due to reduced compliance since effects of voluntary physical exercise were examined (156).


As discussed above, for prevention of a decrease in NEAT resulting from hypocaloric dieting, an effective strategy could therefore be to recommend moderate voluntary exercising during weight reduction, and then to engage in NEAT-enhancing activities at the initiation of weight maintenance. This strategy could mitigate poor long-term compliance and substantially contribute to lower body mass preservation. However, when purposeful training is initiated in combination with a hypocaloric diet, the exercise schedule must be moderate as too intense of an exercise regimen during caloric restriction can disproportionally reduce NEAT rather than stabilize it (157, 85). Otherwise, even purposeful exercise training cannot completely overcome hypocaloric diet-induced reductions of TEE, as the REE-component remains largely unaffected by this kind of intervention even when LBM is preserved (85, 72, 36, 80).


From a practical point of view this is a central issue, as after weight loss reduced TEE will persist over years. This was recently shown by a follow up study on participants of the “The Biggest Loser” televised weight loss competition in the U.S.(158). Fourteen subjects who were severely obese lost approximately 59 kg during a 30 week period of strenous physical exercise in combination with dieting. Fat mass was primarily lost, while LBM was largely preserved (158). Compared to baseline, by the end of the 30-week competition TEE decreased significantly by 800 kcal per day, which was mainly explained by the decline in RMR, approximating 600 kcal per day (158).  Unfortunately, NEAT was not directly measured. However, keeping in mind that subjects underwent an intense physical exercise schedule it can be hypothesized that the observed difference of TEE and RMR (e.g. 200 kcal per day) was contributed to by a decline in spontaneous physical activity, which is comparable to earlier studies (157, 39, 72). After six years, the participants had regained 41 kg, TEE was reduced by roughly 400 kcal day-, and in spite of the significant weight regain, RMR remained reduced by 600 kcal per day (158). Therefore, after six years, “The Biggest Loser” televised weight loss competition resulted in a total weight loss of approximately 12 kg in subjects who were previously severely obese. The data indicate that these individuals will have to live with remarkably reduced dietary energy needs, even after adjustment for body weight and age (158) that contributes to their ongoing weight regain. Remarkably, the fact that after six years the reductions in RMR were lower than TEE indicates that some form of compensation is occuring, but it is unclear which component of daily energy needs is accounting for it (Figure 1). From the previously reported findings it can surmised that decreased NEAT was one of the factors contributing to the large weight regain (158, 39). Indeed, it was shown that participants of the “The Biggest Loser” television show with high levels of physical activity over years had significantly lower body mass regain compared to subjects with low physical activity levels. Weight loss maintainers had physical activity thermogenesis of roughly 12 kcal/kg/d as compared to weight regainers with approximately 8 kcal/kg/d, which was reflectetd by a significant negative correlation of body mass regain and physical activity levels (114).


Overall, moderate voluntary exercise results in significantly preserved weight loss during hypocaloric dieting (159, 160), which can be a helpful tool for preventing significant decreases in NEAT that will later help to stabilize body weight loss. With initiation of weight maintenance, subjects should be encouraged to engange in actvities increasing NEAT, to compensate at least in part for the obligatory weight loss-induced reduction in RMR. As stated previously, additional voluntary exercise is a useful tool for weight maintenance, but engagement in NEAT-related activities can be more easiliy integrated in daily life and will therefore likely result in higher adherence and compliance rates.


In terms of appropriate activities, it can be relatively easy to increase NEAT (Figure 10). Standing instead of sitting burns three times more kcal per hour, gum chewing increases energy expenditure four times, and stair climbing more than 40 times above resting levels (45). Ambulation (e.g., walking) in particular can raise NEAT and is easily performed at almost any place and at any time. But how can a goal of 2.5 hours of additional daily ambulation/standing time be realistically be integrated into daily routine? A key problem is that people’s occupations and personal lives regularly contribute to prohibit this degree of adaptation (45). As one’s occupation is the principal determinant of NEAT in adulthood and can represent an efficient means of promoting physical activity (45), how NEAT can be primarily integrated at the site of occupation needs examining. One important issue in this context addresses transportation to work. Similar to the NHANES data for the United States (42, 43, 41), recent results from the English and Welsh 2011 Census show that among the 23.7 million adult commuters, approximately 67% used private motorized transport as their usual main commute mode, while about 18% used public transport (161). In contrast, only 10.9% walked and 3.1% cycled (161). Thus, the majority of subjects rely on motorized transport. Promoting cycling or walking as a daily routine, not only with regard to transportation to work but also with respect to other daily needs (such as going to the grocery store), could represent a promising and realistic way for a majority of subjects to increase individual NEAT levels.
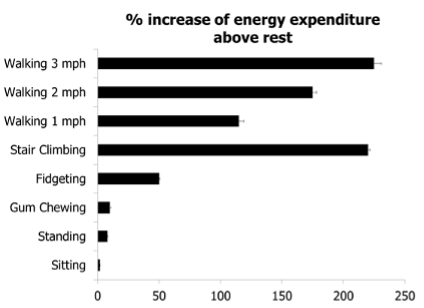
 

Figure 10. Effects of physical activity on PEE/AEE and its components (adapted from (153)).


Together, 2.5 hours of additional ambulation and standing time per day are proposed as goals for those considering weight loss. However, potential beneficial effects on weight loss could be at least partially compensated for by increasing energy intake from food. Increasing NEAT as an adjunct for weight maintenance could overcome potential compensatory effects to the low-calorie state and hypothetically represent an alternative strategy for body mass control.


Limitations to Increasing NEAT


A number of factors potentially affect time spent in NEAT, of which some (sociological and environmental factors) can be influenced, while others cannot (genetic and endocrine factors) (Figure 11). Two points are important to make. First, as was shown previously in this chapter, skeletal muscle can increase in fuel economy and work efficiency not only in response to the loss of body mass, but also so that benefits of NEAT may be diminished. Moreover, it has also been reported that under weight-loss conditions, subjects with obesity oxidize proportionally more carbohydrates and less fat as compared to lean counterparts, and that differences in skeletal muscle metabolism and SNS activity underlie some of the observed differences between subjects who are and are not obese (reviewed in (21)). And second, even though regular physical activity can increase the capacity of skeletal muscle to oxidize lipids and to store glycogen (85), regular physical activity can also increase work efficiency and thereby possibly reduce the energetic costs of NEAT (85). Even so, given the known contribution of physical activity to body weight maintenance, the recommendation to patients who are overweight and with obesity to increase NEAT-related activities such as ambulation or bicycling is logical, even before definitive evidence is reported.
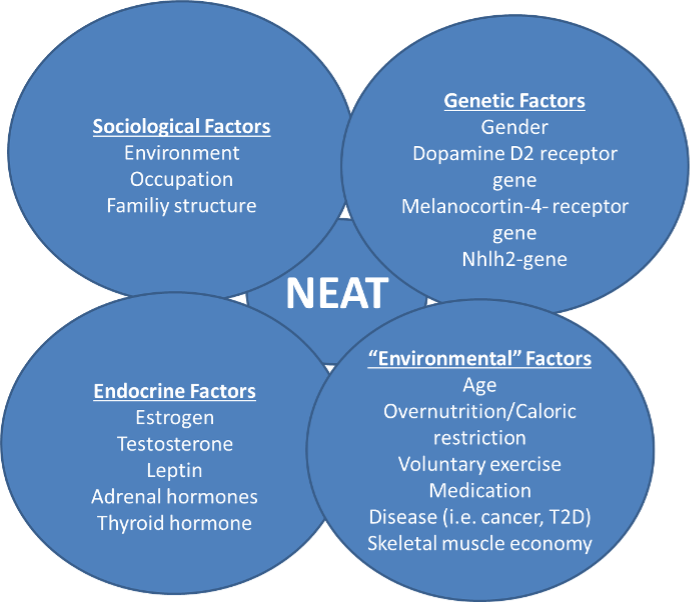
 

Figure 11. Factors interfering with spontaneous physical activity and NEAT (adapted from (120)).


CONCLUSION


The epidemic of worldwide obesity in past decades is contributing to serious health concerns. Apart from poor diet, reduced physical activity and increased sedentary behavior contribute to the pathogenesis of obesity. Non-exercise activity thermogenesis is a highly variable component of daily total energy expenditure and essentially a function of environmental and individual factors. Whether caloric overfeeding systematically affects non-exercise activity thermogenesis is a matter of debate, while a negative energy balance due to voluntary caloric restriction and/or exercise can decrease it. As physical activity contributes to weight maintenance and prevention of body mass regain after hypocaloric dietary interventions, overcoming current obesogenic environmental pressures and increasing non-exercise activity thermogenesis could holds tremendous promise as a tool for body weight control.


REFERENCES


  1. Bray GA, Heisel WE, Afshin A, Jensen MD, Dietz WH, Long M, Kushner RF, Daniels SR, Wadden TA, Tsai AG, Hu FB, Jakicic JM, Ryan DH, Wolfe BM, Inge TH. The Science of Obesity Management: An Endocrine Society Scientific Statement, Endocr Rev. 2018; 39:79–132
  2. Finucane MM, Stevens GA, Cowan MJ, Danaei G, Lin JK, Paciorek CJ, Singh GM, Gutierrez HR, Lu Y, Bahalim AN, Farzadfar F, Riley LM, Ezzati M. National, regional, and global trends in body-mass index since 1980: systematic analysis of health examination surveys and epidemiological studies with 960 country-years and 9·1 million participants, Lancet. 2011; 377:557–567
  3. Worldwide trends in body-mass index, underweight, overweight, and obesity from 1975 to 2016: a pooled analysis of 2416 population-based measurement studies in 128·9 million children, adolescents, and adults,Lancet. 2017; 390:2627–2642
  4. Flegal KM, Carroll MD, Kit BK, Ogden CL. Prevalence of obesity and trends in the distribution of body mass index among US adults, 1999-2010, JAMA. 2012; 307:491–497
  5. Flegal KM, Kruszon-Moran D, Carroll MD, Fryar CD, Ogden CL. Trends in Obesity Among Adults in the United States, 2005 to 2014, JAMA. 2016; 315:2284–2291
  6. Pérez Rodrigo C. Current mapping of obesity, Nutr Hosp. 2013; 28 Suppl 5:21–31
  7. Di Cesare M, Sorić M, Bovet P, Miranda JJ, Bhutta Z, Stevens GA, Laxmaiah A, Kengne A-P, Bentham J. The epidemiological burden of obesity in childhood: a worldwide epidemic requiring urgent action, BMC Med. 2019; 17:212
  8. Heymsfield SB, Wadden TA. Mechanisms, Pathophysiology, and Management of Obesity, N Engl J Med. 2017; 376:254–266
  9. Heo M, Allison DB, Faith MS, Zhu S, Fontaine KR. Obesity and quality of life: mediating effects of pain and comorbidities, Obes Res. 2003; 11:209–216
  10. Olshansky SJ, Passaro DJ, Hershow RC, Layden J, Carnes BA, Brody J, Hayflick L, Butler RN, Allison DB, Ludwig DS. A potential decline in life expectancy in the United States in the 21st century, N Engl J Med. 2005; 352:1138–1145
  11. Vita AJ, Terry RB, Hubert HB, Fries JF. Aging, health risks, and cumulative disability, N Engl J Med. 1998; 338:1035–1041
  12. Chung N, Park M-Y, Kim J, Park H-Y, Hwang H, Lee C-H, Han J-S, So J, Park J, Lim K. Non-exercise activity thermogenesis (NEAT): a component of total daily energy expenditure, J Exerc Nutrition Biochem. 2018; 22:23–30
  13. Johnston R, Poti JM, Popkin BM. Eating and aging: trends in dietary intake among older Americans from 1977-2010, J Nutr Health Aging. 2014; 18:234–242
  14. Popkin BM, Siega-Riz AM, Haines PS. A comparison of dietary trends among racial and socioeconomic groups in the United States, N Engl J Med. 1996; 335:716–720
  15. Slining MM, Mathias KC, Popkin BM. Trends in food and beverage sources among US children and adolescents: 1989-2010, J Acad Nutr Diet. 2013; 113:1683–1694
  16. Hill JO, Wyatt HR, Peters JC. Energy balance and obesity, Circulation. 2012; 126:126–132
  17. Hamman RF, Wing RR, Edelstein SL, Lachin JM, Bray GA, Delahanty L, Hoskin M, Kriska AM, Mayer-Davis EJ, Pi-Sunyer X, Regensteiner J, Venditti B, Wylie-Rosett J. Effect of weight loss with lifestyle intervention on risk of diabetes, Diabetes Care. 2006; 29:2102–2107
  18. Psota T, Chen KY. Measuring energy expenditure in clinical populations: rewards and challenges, Eur J Clin Nutr. 2013; 67:436–442
  19. Chen KY, Brychta RJ, Abdul Sater Z, Cassimatis TM, Cero C, Fletcher LA, Israni NS, Johnson JW, Lea HJ, Linderman JD, O'Mara AE, Zhu KY, Cypess AM. Opportunities and challenges in the therapeutic activation of human energy expenditure and thermogenesis to manage obesity, J Biol Chem. 2020; 295:1926–1942
  20. Levine JA, Kotz CM. NEAT--non-exercise activity thermogenesis--egocentric & geocentric environmental factors vs. biological regulation, Acta Physiol Scand. 2005; 184:309–318
  21. Levine JA. Non-exercise activity thermogenesis (NEAT), Best Pract Res Clin Endocrinol Metab. 2002; 16:679–702
  22. Levine JA. Non-exercise activity thermogenesis (NEAT), Nutr Rev. 2004; 62:S82-97
  23. Daan S, Masman D, Strijkstra A, Verhulst S. Intraspecific allometry of basal metabolic rate: relations with body size, temperature, composition, and circadian phase in the kestrel, Falco tinnunculus, J Biol Rhythms. 1989; 4:267–283
  24. Dériaz O, Fournier G, Tremblay A, Després JP, Bouchard C. Lean-body-mass composition and resting energy expenditure before and after long-term overfeeding, Am J Clin Nutr. 1992; 56:840–847
  25. Donnelly JE, Pronk NP, Jacobsen DJ, Pronk SJ, Jakicic JM. Effects of a very-low-calorie diet and physical-training regimens on body composition and resting metabolic rate in obese females, Am J Clin Nutr. 1991; 54:56–61
  26. Ford LE. Some consequences of body size, Am J Physiol. 1984; 247:H495-507
  27. Henry CJK. Basal metabolic rate studies in humans: measurement and development of new equations, Public Health Nutr. 2005; 8:1133–1152
  28. Ravussin E, Burnand B, Schutz Y, Jéquier E. Twenty-four-hour energy expenditure and resting metabolic rate in obese, moderately obese, and control subjects, Am J Clin Nutr. 1982; 35:566–573
  29. Ravussin E, Lillioja S, Anderson TE, Christin L, Bogardus C. Determinants of 24-hour energy expenditure in man. Methods and results using a respiratory chamber, J Clin Invest. 1986; 78:1568–1578
  30. Kreymann G, Adolph M, Mueller MJ. Energy expenditure and energy intake - Guidelines on Parenteral Nutrition, Chapter 3, Ger Med Sci. 2009; 7:Doc25
  31. Ravussin E, Lillioja S, Knowler WC, Christin L, Freymond D, Abbott WG, Boyce V, Howard BV, Bogardus C. Reduced rate of energy expenditure as a risk factor for body-weight gain, N Engl J Med. 1988; 318:467–472
  32. Roberts SB, Savage J, Coward WA, Chew B, Lucas A. Energy expenditure and intake in infants born to lean and overweight mothers, N Engl J Med. 1988; 318:461–466
  33. Saltzman E, Roberts SB. The role of energy expenditure in energy regulation: findings from a decade of research, Nutr Rev. 1995; 53:209–220
  34. Novak CM, Levine JA. Central neural and endocrine mechanisms of non-exercise activity thermogenesis and their potential impact on obesity, J Neuroendocrinol. 2007; 19:923–940
  35. Weinsier RL, Nelson KM, Hensrud DD, Darnell BE, Hunter GR, Schutz Y. Metabolic predictors of obesity. Contribution of resting energy expenditure, thermic effect of food, and fuel utilization to four-year weight gain of post-obese and never-obese women, J Clin Invest. 1995; 95:980–985
  36. Weinsier RL, Hunter GR, Zuckerman PA, Darnell BE. Low resting and sleeping energy expenditure and fat use do not contribute to obesity in women, Obes Res. 2003; 11:937–944
  37. Dolezal BA, Potteiger JA. Concurrent resistance and endurance training influence basal metabolic rate in nondieting individuals, J Appl Physiol (1985). 1998; 85:695–700
  38. Glowacki SP, Martin SE, Maurer A, Baek W, Green JS, Crouse SF. Effects of resistance, endurance, and concurrent exercise on training outcomes in men, Med Sci Sports Exerc. 2004; 36:2119–2127
  39. Melanson EL. The effect of exercise on non-exercise physical activity and sedentary behavior in adults, Obes Rev. 2017; 18 Suppl 1:40–49
  40. Kinabo JL, Durnin JV. Thermic effect of food in man: effect of meal composition, and energy content, Br J Nutr. 1990; 64:37–44
  41. Sisson SB, Camhi SM, Tudor-Locke C, Johnson WD, Katzmarzyk PT. Characteristics of step-defined physical activity categories in U.S. adults, Am J Health Promot. 2012; 26:152–159
  42. Barreira TV, Harrington DM, Katzmarzyk PT. Cardiovascular health metrics and accelerometer-measured physical activity levels: National Health and Nutrition Examination Survey, 2003-2006, Mayo Clin Proc. 2014; 89:81–86
  43. Loprinzi PD, Smit E, Mahoney S. Physical activity and dietary behavior in US adults and their combined influence on health, Mayo Clin Proc. 2014; 89:190–198
  44. Segal KR, Pi-Sunyer FX. Exercise and obesity, Med Clin North Am. 1989; 73:217–236
  45. Levine JA. Nonexercise activity thermogenesis--liberating the life-force, J Intern Med. 2007; 262:273–287
  46. Dulloo AG, Seydoux J, Jacquet J. Adaptive thermogenesis and uncoupling proteins: a reappraisal of their roles in fat metabolism and energy balance, Physiol Behav. 2004; 83:587–602
  47. Kotz C, Nixon J, Butterick T, Perez-Leighton C, Teske J, Billington C. Brain orexin promotes obesity resistance,Ann N Y Acad Sci. 2012; 1264:72–86
  48. McManus AM. Physical activity - a neat solution to an impending crisis, J Sports Sci Med. 2007; 6:368–373
  49. Elia M, Stratton R, Stubbs J. Techniques for the study of energy balance in man, Proc Nutr Soc. 2003; 62:529–537
  50. Levine J, Melanson EL, Westerterp KR, Hill JO. Measurement of the components of nonexercise activity thermogenesis, Am J Physiol Endocrinol Metab. 2001; 281:E670-5
  51. Levine JA. Measurement of energy expenditure, Public Health Nutr. 2005; 8:1123–1132
  52. Diaz EO, Prentice AM, Goldberg GR, Murgatroyd PR, Coward WA. Metabolic response to experimental overfeeding in lean and overweight healthy volunteers, Am J Clin Nutr. 1992; 56:641–655
  53. Levine JA, Eberhardt NL, Jensen MD. Role of nonexercise activity thermogenesis in resistance to fat gain in humans, Science. 1999; 283:212–214
  54. Sun S, Tang Q, Quan H, Lu Q, Sun M, Zhang K. Energetic Assessment of the Nonexercise Activities under Free-Living Conditions, Biomed Res Int. 2016; 2016:8465976
  55. Jung W-S, Park H-Y, Kim S-W, Kim J, Hwang H, Lim K. Prediction of non-exercise activity thermogenesis (NEAT) using multiple linear regression in healthy Korean adults: a preliminary study, Phys Act Nutr. 2021; 25:23–29
  56. Black AE, Coward WA, Cole TJ, Prentice AM. Human energy expenditure in affluent societies: an analysis of 574 doubly-labelled water measurements, Eur J Clin Nutr. 1996; 50:72–92
  57. Coward WA. Contributions of the doubly labeled water method to studies of energy balance in the Third World,Am J Clin Nutr. 1998; 68:962S-969S
  58. Levine JA, Weisell R, Chevassus S, Martinez CD, Burlingame B, Coward WA. The work burden of women,Science. 2001; 294:812
  59. Caspersen CJ, Merritt RK. Physical activity trends among 26 states, 1986-1990, Med Sci Sports Exerc. 1995; 27:713–720
  60. United States. Public Health Service. Office of the Surgeon General., National Center for Chronic Disease Prevention and Health Promotion (U.S.), President's Council on Physical Fitness and Sports (U.S.). Physical activity and health : a report of the Surgeon General. Atlanta, Ga., Washington, D.C., Pittsburgh, PA: U.S. Dept. of Health and Human Services, Centers for Disease Control and Prevention, President's Council on Physical Fitness and Sports; 1996
  61. Livingstone B. Epidemiology of childhood obesity in Europe, Eur J Pediatr. 2000; 159 Suppl 1:S14-34
  62. Pratt M, Macera CA, Blanton C. Levels of physical activity and inactivity in children and adults in the United States: current evidence and research issues, Med Sci Sports Exerc. 1999; 31:S526-33
  63. Westerterp KR. Daily physical activity and ageing, Curr Opin Clin Nutr Metab Care. 2000; 3:485–488
  64. Harris AM, Lanningham-Foster LM, McCrady SK, Levine JA. Nonexercise movement in elderly compared with young people, Am J Physiol Endocrinol Metab. 2007; 292:E1207-12
  65. Bromley LE, Booth JN, Kilkus JM, Imperial JG, Penev PD. Sleep restriction decreases the physical activity of adults at risk for type 2 diabetes, Sleep. 2012; 35:977–984
  66. Bosy-Westphal A, Hinrichs S, Jauch-Chara K, Hitze B, Later W, Wilms B, Settler U, Peters A, Kiosz D, Muller MJ. Influence of partial sleep deprivation on energy balance and insulin sensitivity in healthy women, Obes Facts. 2008; 1:266–273
  67. Brondel L, Romer MA, Nougues PM, Touyarou P, Davenne D. Acute partial sleep deprivation increases food intake in healthy men, Am J Clin Nutr. 2010; 91:1550–1559
  68. Roehrs T, Turner L, Roth T. Effects of sleep loss on waking actigraphy, Sleep. 2000; 23:793–797
  69. Schmid SM, Hallschmid M, Jauch-Chara K, Wilms B, Benedict C, Lehnert H, Born J, Schultes B. Short-term sleep loss decreases physical activity under free-living conditions but does not increase food intake under time-deprived laboratory conditions in healthy men, Am J Clin Nutr. 2009; 90:1476–1482
  70. Drewnowski A, Specter SE. Poverty and obesity: the role of energy density and energy costs, Am J Clin Nutr. 2004; 79:6–16
  71. Ludwig J, Sanbonmatsu L, Gennetian L, Adam E, Duncan GJ, Katz LF, Kessler RC, Kling JR, Lindau ST, Whitaker RC, McDade TW. Neighborhoods, obesity, and diabetes--a randomized social experiment, N Engl J Med. 2011; 365:1509–1519
  72. Müller MJ, Enderle J, Bosy-Westphal A. Changes in Energy Expenditure with Weight Gain and Weight Loss in Humans, Curr Obes Rep. 2016; 5:413–423
  73. Leibel RL, Rosenbaum M, Hirsch J. Changes in energy expenditure resulting from altered body weight, N Engl J Med. 1995; 332:621–628
  74. Vanltallie TB. Resistance to weight gain during overfeeding: a NEAT explanation, Nutr Rev. 2001; 59:48–51
  75. Apolzan JW, Bray GA, Smith SR, Jonge L de, Rood J, Han H, Redman LM, Martin CK. Effects of weight gain induced by controlled overfeeding on physical activity, Am J Physiol Endocrinol Metab. 2014; 307:E1030-7
  76. Apolzan JW, Bray GA, Hamilton MT, Zderic TW, Han H, Champagne CM, Shepard D, Martin CK. Short-term overeating results in incomplete energy intake compensation regardless of energy density or macronutrient composition, Obesity (Silver Spring). 2014; 22:119–130
  77. He J, Votruba S, Pomeroy J, Bonfiglio S, Krakoff J. Measurement of ad libitum food intake, physical activity, and sedentary time in response to overfeeding, PLoS One. 2012; 7:e36225
  78. Levine JA, Lanningham-Foster LM, McCrady SK, Krizan AC, Olson LR, Kane PH, Jensen MD, Clark MM. Interindividual variation in posture allocation: possible role in human obesity, Science. 2005; 307:584–586
  79. Schmidt SL, Harmon KA, Sharp TA, Kealey EH, Bessesen DH. The effects of overfeeding on spontaneous physical activity in obesity prone and obesity resistant humans, Obesity (Silver Spring). 2012; 20:2186–2193
  80. Westerterp KR. Physical activity, food intake, and body weight regulation: insights from doubly labeled water studies, Nutr Rev. 2010; 68:148–154
  81. Siervo M, Frühbeck G, Dixon A, Goldberg GR, Coward WA, Murgatroyd PR, Prentice AM, Jebb SA. Efficiency of autoregulatory homeostatic responses to imposed caloric excess in lean men, Am J Physiol Endocrinol Metab. 2008; 294:E416-24
  82. Almundarij TI, Gavini CK, Novak CM. Suppressed sympathetic outflow to skeletal muscle, muscle thermogenesis, and activity energy expenditure with calorie restriction, Physiol Rep. 2017; 5
  83. Weyer C, Walford RL, Harper IT, Milner M, MacCallum T, Tataranni PA, Ravussin E. Energy metabolism after 2 y of energy restriction: the biosphere 2 experiment, Am J Clin Nutr. 2000; 72:946–953
  84. Reinhardt M, Thearle MS, Ibrahim M, Hohenadel MG, Bogardus C, Krakoff J, Votruba SB. A Human Thrifty Phenotype Associated With Less Weight Loss During Caloric Restriction, Diabetes. 2015; 64:2859–2867
  85. Hunter GR, Fisher G, Neumeier WH, Carter SJ, Plaisance EP. Exercise Training and Energy Expenditure following Weight Loss, Med Sci Sports Exerc. 2015; 47:1950–1957
  86. Bouchard C, Tremblay A, Després JP, Nadeau A, Lupien PJ, Thériault G, Dussault J, Moorjani S, Pinault S, Fournier G. The response to long-term overfeeding in identical twins, N Engl J Med. 1990; 322:1477–1482
  87. Hainer V, Stunkard A, Kunesová M, Parízková J, Stich V, Allison DB. A twin study of weight loss and metabolic efficiency, Int J Obes Relat Metab Disord. 2001; 25:533–537
  88. McCarthy MI. Genomics, type 2 diabetes, and obesity, N Engl J Med. 2010; 363:2339–2350
  89. Zurlo F, Ferraro RT, Fontvielle AM, Rising R, Bogardus C, Ravussin E. Spontaneous physical activity and obesity: cross-sectional and longitudinal studies in Pima Indians, Am J Physiol. 1992; 263:E296-300
  90. Drenowatz C. Reciprocal Compensation to Changes in Dietary Intake and Energy Expenditure within the Concept of Energy Balance, Adv Nutr. 2015; 6:592–599
  91. Leibel RL, Rosenbaum M, Hirsch J. Changes in energy expenditure resulting from altered body weight, N Engl J Med. 1995; 332:621–628
  92. Rosenbaum M, Leibel RL. Models of energy homeostasis in response to maintenance of reduced body weight,Obesity (Silver Spring). 2016; 24:1620–1629
  93. Kotz CM, Perez-Leighton CE, Teske JA, Billington CJ. Spontaneous Physical Activity Defends Against Obesity,Curr Obes Rep. 2017; 6:362–370
  94. Teske JA, Billington CJ, Kotz CM. Neuropeptidergic mediators of spontaneous physical activity and non-exercise activity thermogenesis, Neuroendocrinology. 2008; 87:71–90
  95. Bunney PE, Zink AN, Holm AA, Billington CJ, Kotz CM. Orexin activation counteracts decreases in nonexercise activity thermogenesis (NEAT) caused by high-fat diet, Physiol Behav. 2017; 176:139–148
  96. Hao Y-Y, Yuan H-W, Fang P-H, Zhang Y, Liao Y-X, Shen C, Wang D, Zhang T-T, Bo P. Plasma orexin-A level associated with physical activity in obese people, Eat Weight Disord. 2017; 22:69–77
  97. Trayhurn P, Bing C, Wood IS. Adipose tissue and adipokines--energy regulation from the human perspective, J Nutr. 2006; 136:1935S-1939S
  98. Solinas G. Molecular pathways linking metabolic inflammation and thermogenesis, Obes Rev. 2012; 13 Suppl 2:69–82
  99. Pelleymounter MA, Cullen MJ, Baker MB, Hecht R, Winters D, Boone T, Collins F. Effects of the obese gene product on body weight regulation in ob/ob mice, Science. 1995; 269:540–543
  100. Dauncey MJ, Brown D. Role of activity-induced thermogenesis in twenty-four hour energy expenditure of lean and genetically obese (ob/ob) mice, Q J Exp Physiol. 1987; 72:549–559
  101. Franks PW, Farooqi IS, Luan J, Wong M-Y, Halsall I, O'Rahilly S, Wareham NJ. Does physical activity energy expenditure explain the between-individual variation in plasma leptin concentrations after adjusting for differences in body composition?, J Clin Endocrinol Metab. 2003; 88:3258–3263
  102. Levin BE, Dunn-Meynell AA. Reduced central leptin sensitivity in rats with diet-induced obesity, Am J Physiol Regul Integr Comp Physiol. 2002; 283:R941-8
  103. Wang J, Obici S, Morgan K, Barzilai N, Feng Z, Rossetti L. Overfeeding rapidly induces leptin and insulin resistance, Diabetes. 2001; 50:2786–2791
  104. Levine JA, Nygren J, Short KR, Nair KS. Effect of hyperthyroidism on spontaneous physical activity and energy expenditure in rats, J Appl Physiol (1985). 2003; 94:165–170
  105. Wu SH, Shu XO, Chow W-H, Xiang Y-B, Zhang X, Li H-L, Cai Q, Milne G, Ji B-T, Cai H, Rothman N, Gao Y-T, Zheng W, Yang G. Nonexercise physical activity and inflammatory and oxidative stress markers in women, J Womens Health (Larchmt). 2014; 23:159–167
  106. Herzig S, Wolfrum C. Brown and white fat: from signaling to disease, Biochim Biophys Acta. 2013; 1831:895
  107. Klingenspor M, Herzig S, Pfeifer A. Brown fat develops a brite future, Obes Facts. 2012; 5:890–896
  108. Virtanen KA, van Marken Lichtenbelt WD, Nuutila P. Brown adipose tissue functions in humans, Biochim Biophys Acta. 2013; 1831:1004–1008
  109. Rosenbaum M, Vandenborne K, Goldsmith R, Simoneau J-A, Heymsfield S, Joanisse DR, Hirsch J, Murphy E, Matthews D, Segal KR, Leibel RL. Effects of experimental weight perturbation on skeletal muscle work efficiency in human subjects, Am J Physiol Regul Integr Comp Physiol. 2003; 285:R183-92
  110. Gavini CK, Mukherjee S, Shukla C, Britton SL, Koch LG, Shi H, Novak CM. Leanness and heightened nonresting energy expenditure: role of skeletal muscle activity thermogenesis, Am J Physiol Endocrinol Metab. 2014; 306:E635-47
  111. Loeffelholz C von, Coldewey SM, Birkenfeld AL. A Narrative Review on the Role of AMPK on De Novo Lipogenesis in Non-Alcoholic Fatty Liver Disease: Evidence from Human Studies, Cells. 2021; 10
  112. Piaggi P, Thearle MS, Bogardus C, Krakoff J. Lower energy expenditure predicts long-term increases in weight and fat mass, J Clin Endocrinol Metab. 2013; 98:E703-7
  113. Drenowatz C, Hill JO, Peters JC, Soriano-Maldonado A, Blair SN. The association of change in physical activity and body weight in the regulation of total energy expenditure, Eur J Clin Nutr. 2017; 71:377–382
  114. Kerns JC, Guo J, Fothergill E, Howard L, Knuth ND, Brychta R, Chen KY, Skarulis MC, Walter PJ, Hall KD. Increased Physical Activity Associated with Less Weight Regain Six Years After "The Biggest Loser" Competition, Obesity (Silver Spring). 2017; 25:1838–1843
  115. Nicklas BJ, Gaukstern JE, Beavers KM, Newman JC, Leng X, Rejeski WJ. Self-monitoring of spontaneous physical activity and sedentary behavior to prevent weight regain in older adults, Obesity (Silver Spring). 2014; 22:1406–1412
  116. Shook RP, Hand GA, Drenowatz C, Hebert JR, Paluch AE, Blundell JE, Hill JO, Katzmarzyk PT, Church TS, Blair SN. Low levels of physical activity are associated with dysregulation of energy intake and fat mass gain over 1 year, Am J Clin Nutr. 2015; 102:1332–1338
  117. Zhu W, Cheng Z, Howard VJ, Judd SE, Blair SN, Sun Y, Hooker SP. Is adiposity associated with objectively measured physical activity and sedentary behaviors in older adults?, BMC Geriatr. 2020; 20:257
  118. Rampersaud E, Mitchell BD, Pollin TI, Fu M, Shen H, O'Connell JR, Ducharme JL, Hines S, Sack P, Naglieri R, Shuldiner AR, Snitker S. Physical activity and the association of common FTO gene variants with body mass index and obesity, Arch Intern Med. 2008; 168:1791–1797
  119. Chipperfield JG. Everyday physical activity as a predictor of late-life mortality, Gerontologist. 2008; 48:349–357
  120. Hamasaki H. Daily physical activity and type 2 diabetes: A review, World J Diabetes. 2016; 7:243–251
  121. Lear SA, Hu W, Rangarajan S, Gasevic D, Leong D, Iqbal R, Casanova A, Swaminathan S, Anjana RM, Kumar R, Rosengren A, Wei L, Yang W, Chuangshi W, Huaxing L, Nair S, Diaz R, Swidon H, Gupta R, Mohammadifard N, Lopez-Jaramillo P, Oguz A, Zatonska K, Seron P, Avezum A, Poirier P, Teo K, Yusuf S. The effect of physical activity on mortality and cardiovascular disease in 130 000 people from 17 high-income, middle-income, and low-income countries: the PURE study, The Lancet. 2017; 390:2643–2654
  122. Stamatakis E, Gale J, Bauman A, Ekelund U, Hamer M, Ding D. Sitting Time, Physical Activity, and Risk of Mortality in Adults, J Am Coll Cardiol. 2019; 73:2062–2072
  123. Visseren FLJ, Mach F, Smulders YM, Carballo D, Koskinas KC, Bäck M, Benetos A, Biffi A, Boavida J-M, Capodanno D, Cosyns B, Crawford C, Davos CH, Desormais I, Di Angelantonio E, Franco OH, Halvorsen S, Hobbs FDR, Hollander M, Jankowska EA, Michal M, Sacco S, Sattar N, Tokgozoglu L, Tonstad S, Tsioufis KP, van Dis I, van Gelder IC, Wanner C, Williams B. 2021 ESC Guidelines on cardiovascular disease prevention in clinical practice, Eur Heart J. 2021; 42:3227–3337
  124. Skyler JS, Bakris GL, Bonifacio E, Darsow T, Eckel RH, Groop L, Groop P-H, Handelsman Y, Insel RA, Mathieu C, McElvaine AT, Palmer JP, Pugliese A, Schatz DA, Sosenko JM, Wilding JPH, Ratner RE. Differentiation of Diabetes by Pathophysiology, Natural History, and Prognosis, Diabetes. 2017; 66:241–255
  125. Boulé NG, Weisnagel SJ, Lakka TA, Tremblay A, Bergman RN, Rankinen T, Leon AS, Skinner JS, Wilmore JH, Rao DC, Bouchard C. Effects of exercise training on glucose homeostasis: the HERITAGE Family Study,Diabetes Care. 2005; 28:108–114
  126. Eitner A, Pester J, Vogel F, Marintschev I, Lehmann T, Hofmann GO, Schaible H-G. Pain sensation in human osteoarthritic knee joints is strongly enhanced by diabetes mellitus, Pain. 2017; 158:1743–1753
  127. Loeffelholz C von, Roth J, Coldewey SM, Birkenfeld AL. The Role of Physical Activity in Nonalcoholic and Metabolic Dysfunction Associated Fatty Liver Disease, Biomedicines. 2021; 9
  128. Eriksson KF, Lindgärde F. No excess 12-year mortality in men with impaired glucose tolerance who participated in the Malmö Preventive Trial with diet and exercise, Diabetologia. 1998; 41:1010–1016
  129. Knowler WC, Barrett-Connor E, Fowler SE, Hamman RF, Lachin JM, Walker EA, Nathan DM. Reduction in the incidence of type 2 diabetes with lifestyle intervention or metformin, N Engl J Med. 2002; 346:393–403
  130. Lindström J, Louheranta A, Mannelin M, Rastas M, Salminen V, Eriksson J, Uusitupa M, Tuomilehto J. The Finnish Diabetes Prevention Study (DPS): Lifestyle intervention and 3-year results on diet and physical activity,Diabetes Care. 2003; 26:3230–3236
  131. Pan XR, Li GW, Hu YH, Wang JX, Yang WY, An ZX, Hu ZX, Lin J, Xiao JZ, Cao HB, Liu PA, Jiang XG, Jiang YY, Wang JP, Zheng H, Zhang H, Bennett PH, Howard BV. Effects of diet and exercise in preventing NIDDM in people with impaired glucose tolerance. The Da Qing IGT and Diabetes Study, Diabetes Care. 1997; 20:537–544
  132. Boer AT den, Herraets IJT, Stegen J, Roumen C, Corpeleijn E, Schaper NC, Feskens E, Blaak EE. Prevention of the metabolic syndrome in IGT subjects in a lifestyle intervention: results from the SLIM study, Nutr Metab Cardiovasc Dis. 2013; 23:1147–1153
  133. Roumen C, Corpeleijn E, Feskens EJM, Mensink M, Saris WHM, Blaak EE. Impact of 3-year lifestyle intervention on postprandial glucose metabolism: the SLIM study, Diabet Med. 2008; 25:597–605
  134. Day CP, James OF. Steatohepatitis: A tale of two “hits”?, Gastroenterology. 1998; 114:842–845
  135. Cormier T. Exercise Programming for Nonalcoholic Fatty Liver Disease, Strength & Conditioning Journal. 2019; 41:89–93
  136. Zhang H-J, He J, Pan L-L, Ma Z-M, Han C-K, Chen C-S, Chen Z, Han H-W, Chen S, Sun Q, Zhang J-F, Li Z-B, Yang S-Y, Li X-J, Li X-Y. Effects of Moderate and Vigorous Exercise on Nonalcoholic Fatty Liver Disease: A Randomized Clinical Trial, JAMA Intern Med. 2016; 176:1074–1082
  137. Fagour C, Gonzalez C, Pezzino S, Florenty S, Rosette-Narece M, Gin H, Rigalleau V. Low physical activity in patients with type 2 diabetes: the role of obesity, Diabetes Metab. 2013; 39:85–87
  138. Peyrot M, Rubin RR, Lauritzen T, Snoek FJ, Matthews DR, Skovlund SE. Psychosocial problems and barriers to improved diabetes management: results of the Cross-National Diabetes Attitudes, Wishes and Needs (DAWN) Study, Diabet Med. 2005; 22:1379–1385
  139. Resnick HE, Foster GL, Bardsley J, Ratner RE. Achievement of American Diabetes Association clinical practice recommendations among U.S. adults with diabetes, 1999-2002: the National Health and Nutrition Examination Survey, Diabetes Care. 2006; 29:531–537
  140. Hamasaki H, Ezaki O, Yanai H. Nonexercise Activity Thermogenesis is Significantly Lower in Type 2 Diabetic Patients With Mental Disorders Than in Those Without Mental Disorders: A Cross-sectional Study, Medicine (Baltimore). 2016; 95:e2517
  141. Hamasaki H, Noda M, Moriyama S, Yoshikawa R, Katsuyama H, Sako A, Mishima S, Kakei M, Ezaki O, Yanai H. Daily Physical Activity Assessed by a Triaxial Accelerometer Is Beneficially Associated with Waist Circumference, Serum Triglycerides, and Insulin Resistance in Japanese Patients with Prediabetes or Untreated Early Type 2 Diabetes, J Diabetes Res. 2015; 2015:526201
  142. Uemura H, Katsuura-Kamano S, Yamaguchi M, Nakamoto M, Hiyoshi M, Arisawa K. Abundant daily non-sedentary activity is associated with reduced prevalence of metabolic syndrome and insulin resistance, J Endocrinol Invest. 2013; 36:1069–1075
  143. Hu FB, Sigal RJ, Rich-Edwards JW, Colditz GA, Solomon CG, Willett WC, Speizer FE, Manson JE. Walking compared with vigorous physical activity and risk of type 2 diabetes in women: a prospective study, JAMA. 1999; 282:1433–1439
  144. Tanasescu M, Leitzmann MF, Rimm EB, Hu FB. Physical activity in relation to cardiovascular disease and total mortality among men with type 2 diabetes, Circulation. 2003; 107:2435–2439
  145. Sarzynski MA, Rice TK, Després J-P, Pérusse L, Tremblay A, Stanforth PR, Tchernof A, Barber JL, Falciani F, Clish C, Robbins JM, Ghosh S, Gerszten RE, Leon AS, Skinner JS, Rao DC, Bouchard C. The HERITAGE Family Study: A Review of the Effects of Exercise Training on Cardiometabolic Health, with Insights into Molecular Transducers, Med Sci Sports Exerc. 2022; 54:S1-S43
  146. Hemmingsen B, Gimenez-Perez G, Mauricio D, Roqué I Figuls M, Metzendorf M-I, Richter B. Diet, physical activity or both for prevention or delay of type 2 diabetes mellitus and its associated complications in people at increased risk of developing type 2 diabetes mellitus, Cochrane Database Syst Rev. 2017; 12:CD003054
  147. Wing RR, Bolin P, Brancati FL, Bray GA, Clark JM, Coday M, Crow RS, Curtis JM, Egan CM, Espeland MA, Evans M, Foreyt JP, Ghazarian S, Gregg EW, Harrison B, Hazuda HP, Hill JO, Horton ES, van Hubbard S, Jakicic JM, Jeffery RW, Johnson KC, Kahn SE, Kitabchi AE, Knowler WC, Lewis CE, Maschak-Carey BJ, Montez MG, Murillo A, Nathan DM, Patricio J, Peters A, Pi-Sunyer X, Pownall H, Reboussin D, Regensteiner JG, Rickman AD, Ryan DH, Safford M, Wadden TA, Wagenknecht LE, West DS, Williamson DF, Yanovski SZ. Cardiovascular effects of intensive lifestyle intervention in type 2 diabetes, N Engl J Med. 2013; 369:145–154
  148. Gregg E, Jakicic J, Blackburn G, Bloomquist P, Bray G, Clark J, Coday M, Curtis J, Egan C, Evans M, Foreyt J, Foster G, Hazuda H, Hill J, Horton E, van Hubbard, Jeffery R, Johnson K, Kitabchi A, Knowler W, Kriska A, Lang W, Lewis C, Montez M, Nathan D, Neiberg R, Patricio J, Peters A, Pi-Sunyer X, Pownall H, Redmon B, Regensteiner J, Rejeski J, Ribisl P, Safford M, Stewart K, Trence D, Wadden T, Wing R, Yanovski S. Association of the magnitude of weight loss and changes in physical fitness with long-term cardiovascular disease outcomes in overweight or obese people with type 2 diabetes: a post-hoc analysis of the Look AHEAD randomised clinical trial, Lancet Diabetes Endocrinol. 2016; 4:913–921
  149. US Department of Health and Human Services. Step It Up! The Surgeon General’s Call to Action to Promote Walking and Walkable Communities. Washington (DC); 2015
  150. Lanningham-Foster L, Nysse LJ, Levine JA. Labor saved, calories lost: the energetic impact of domestic labor-saving devices, Obes Res. 2003; 11:1178–1181
  151. Piaggi P, Thearle MS, Krakoff J, Votruba SB. Higher Daily Energy Expenditure and Respiratory Quotient, Rather Than Fat-Free Mass, Independently Determine Greater ad Libitum Overeating, J Clin Endocrinol Metab. 2015; 100:3011–3020
  152. Elbelt U, Schuetz T, Knoll N, Burkert S. Self-Directed Weight Loss Strategies: Energy Expenditure Due to Physical Activity Is Not Increased to Achieve Intended Weight Loss, Nutrients. 2015; 7:5868–5888
  153. Pontzer H, Durazo-Arvizu R, Dugas LR, Plange-Rhule J, Bovet P, Forrester TE, Lambert EV, Cooper RS, Schoeller DA, Luke A. Constrained Total Energy Expenditure and Metabolic Adaptation to Physical Activity in Adult Huumans, Curr Biol. 2016; 26:410–417
  154. Schoeller DA, Shay K, Kushner RF. How mch physical activity is needed to minimize weight gain in previously obese women?, Am J Clin Nutr. 1997; 66:551–556
  155. Weinsier RL, Hunter GR, Desmond RA, Byrne NM, Zuckerman PA, Darnell BE. Free-living activity energy expenditure in women successful and unsuccessful at maintaining a normal body weight, Am J Clin Nutr. 2002; 75:499–504
  156. Johansson K, Neovius M, Hemmingsson E. Effects of anti-obesity drugs, diet, and exercise on weight-loss maintenance after a very-low-calorie diet or low-calorie diet: a systematic review and meta-analysis of randomized controlled trials, Am J Clin Nutr. 2014; 99:14–23
  157. Hunter GR, Bickel CS, Fisher G, Neumeier WH, McCarthy JP. Combined aerobic and strength training and energy expenditure in older women, Med Sci Sports Exerc. 2013; 45:1386–1393
  158. Fothergill E, Guo J, Howard L, Kerns JC, Knuth ND, Brychta R, Chen KY, Skarulis MC, Walter M, Walter PJ, Hall KD. Persistent metabolic adaptation 6 years after "The Biggest Loser" competition, Obesity (Silver Spring). 2016; 24:1612–1619
  159. Kempen KP, Saris WH, Westerterp KR. Energy balance during an 8-wk energy-restricted diet with and without exercise in obese women, Am J Clin Nutr. 1995; 62:722–729
  160. Wu T, Gao X, Chen M, van Dam RM. Long-term effectiveness of diet-plus-exercise interventions vs. diet-only interventions for weight loss: a meta-analysis, Obes Rev. 2009; 10:313–323
  161. Goodman A. Walking, cycling and driving to work in the English and Welsh 2011 census: trends, socio-economic patterning and relevance to travel behaviour in general, PLoS One. 2013; 8:e71790

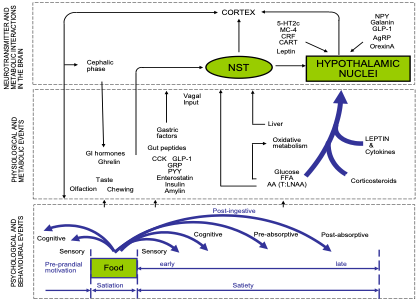
 

The Control of Food Intake in Humans

ABSTRACT


Knowledge of the factors influencing food intake is crucial to form an understanding of energy balance and obesity. Classical physiological feedback models propose that eating behavior is stimulated and inhibited by internal signaling systems (for the drive and suppression of eating, respectively) to maintain stability of the internal environment (usually energy or nutrient stores). However day-to-day food intake involves complex interactions of both internal and external inputs coordinated through homeostatic, hedonic, and cognitive processes in the brain. Twenty-five years ago, the term ‘obesogenic environment’ entered into scientific discourse and implies that prompts, cues, and triggers from the external environment are largely responsible for the increases in food intake that underlie the epidemic of obesity. This approach revitalized interest in the sensory and external stimulation of food intake and has drawn attention to the hedonic dimension of appetite. There is now a very strong current of thought that energy balance regulation is asymmetric and excess food intake is due to poor homoeostatic defense against positive energy balances in an environment rich in available, accessible, and readily assimilated food energy. This does not mean that regulatory signals concerned with energy balance regulation are unimportant. Indeed, they appear to be of incremental importance in prolonged negative energy balances and help explain control and loss of control of food intake as a dynamic continuum.


INTRODUCTION


Traditionally food intake has been researched within the homeostatic approach to physiological systems pioneered by Claude Bernard (1), Walter Cannon (2) and others, and because eating is a form of behavior, it forms part of what Curt Richter referred to as the behavioral regulation of body weight (or behavioral homeostasis) (3). This approach views food intake as the vehicle for energy supply whose expression is modulated by the metabolic requirement to replenish energy stores. The idea was that eating behavior is stimulated and inhibited by internal signaling systems (for the drive and suppression of eating, respectively) in order to maintain stability in the internal environment (energy stores, tissue needs). Since this time, it has become clear that energy intake is not as tightly regulated under modern environmental conditions as symmetrical negative feedback models initially suggested. Compensatory changes in physiology and behavior are more pronounced in response to negative than positive energy balances. Furthermore, energy intake is determined by eating behavior, which itself, may be determined by a number of complex physiological, environmental, social, and cultural factors. One should not perhaps expect to see strict regulation of food or energy intake on a day-to-day basis in modern environments.


IS EATING BEHAVIOUR REGULATED?


The control of appetite is often viewed to operate within an energy balance model of body weight regulation, but this should not lead to the view that appetite is controlled simply as an outcome of energy balance. Eating (food, energy, and nutrient intake) is a form of behavior, and like many aspects of volitional behavior, the factors leading to changes in that behavior are complex and are the outcome of factors which can be described by behavior change models. Using a COM-B model of behavior (Capability, Opportunity, Motivation, Behavior) (4), these factors include capability (psychological or physical ability to enact the behavior), motivation (reflective and automatic mechanisms activate or inhibit behavior), opportunity (physical and social environments that enables the behavior). Given the interacting and complex nature of these influences it is to be expected that unless homeostatic or other physiological feedback signals are particularly powerful, their effects on eating behavior would be difficult to detect. It is often implied (but not explicitly stated) that eating behavior is part of a feedback loop that is subsumed to the regulation of energy balance, but under the conditions of modern environments, there is little rationale for why eating behavior per se should be a regulated phenomenon as described by classic homeostatic models. Eating behavior may show repeated patterns which are stable over time, but these patterns may be quite different from the concept of regulation described in typical homeostatic models of blood glucose regulation or thermoregulation for example.


While eating behavior is influenced by a number of factors, it is reasonable to argue that some of those factors may become particularly salient under specific physiological or environmental circumstances. This is important as energy balance regulation appears asymmetric, with compensatory changes in physiology and behavior more pronounced in response to negative than positive energy balances. The exact mechanisms that oppose energy deficits are complex, inter-related, and individually subtle (5, 6). While energy expenditure and its components change in response to energy deficits in a quantitatively important manner, it is likely that changes in energy intake (EI) have a greater capacity to produce relatively large alterations in energy balance and body composition (7). The physiological and psychological impacts of weight loss likely occur on a continuum, with the point on this continuum influenced by (i) the degree of energy deficit, (ii) its duration, (iii) body composition at the onset of the energy deficit, and (iv) the psychosocial environment in which it occurs (8). In contrast, as weight is progressively gained there is very little evidence of physiological or behavioral systems exerting negative feedback to actively limit further weight gain. However, there is considerable heterogeneity in the rate of weight gain during overfeeding (9), which may in part, reflect inter-individual variations in physical activity and/or partitioning the excess energy between fat mass (FM) and fat-free mass (FFM) (10, 11).


The implication of asymmetric energy balance regulation would be that appetite is under stronger physiological control in relation to negative energy balances, whereas in a state of energy balance or positive energy balances weak linkages (negative feedback) exist between physiological functioning, food intake, and the motivation to eat. If energy balance regulation is asymmetric and modern environments are spatially and temporally rich in energy dense foods, it is logical to assume that many of the factors that shape eating behavior and energy intake are due to environmental influences such as sensory and environmental cues for food intake (which are presumably mediated through hedonic and other affective mechanisms). There is now a strong current of thought that a major cause of an increase in food intake associated with the rise of obesity resides in the hedonic rather than the homeostatic system. Some authors argue that in the resource limiting environments in which we evolved, hedonic and homeostatic systems functioned in a synchronized manner to facilitate over consumption during relatively brief periods of food abundance. In an environment where food resources are unpredictable and finite, overconsumption would have been an adaptive behavior limited (capability, opportunity) by environmental uncertainty. Natural selection would favor such behaviors. There would have been little need to evolve systems that protect against weight gain as it would be an improbable outcome in resource limited environments. This does not mean that the so-called ‘energy homeostasis system’ is no longer important in modern environments. Modern day environments have changed very rapidly and radically relative to the environment shaping energy balance regulation. Therefore, to understand how homeostasis and hedonics may influence food intake in modern environments requires an appreciation of the asymmetry of energy balance regulation, the time course over which such regulation may operate, and the very rapid time-course over which the modern food environment has changed.


FOOD INTAKE AND APPETITE CONTROL


The Motivation to Eat


Within the COM-B model of behavior, motivation is an important factor influencing behavior if capability and opportunity do not constrain behavior (as is the case in today’s so called ‘obesogenic’ environment). In the field of ingestive behavior, motivation to eat usually refers to reflective processes that are subjectively experienced or expressed. They are often believed to relate to underlying physiological or external environmental influences, but have the status of a self-reported, subjectively expressed psychological construct. Appetite has been defined as the subjective expression of willingness or motivation associated with qualitative selection and quantitative consumption of specific foods during an ingestive event (12). Appetite is not necessarily solely related to situations of nutritional depletion and can be influenced by a number of physiological and non-physiological factors. Appetites are specific to certain foods, often learned and frequently sensory specific (13). Unfortunately, the term appetite control is often used without specifying what is being controlled. Does eating behavior change to maintain some constancy and motivation to eat? Does appetite change in order to control food intake around some central tendency? Does appetite change with the aim of changing food intake to regulate energy balance? Often it is the latter view that is implied but not clearly articulated.


Table 1. Key Psychobiological Components of Appetite (14, 15)

COMPONENT OF APPETITE

DEFINITION

Hunger

The subjective sensation described as the primary motivation to eat. An increase in subjective hunger usually predicts meal initiation under ad libitum feeding situation. It does not necessarily predict type or amount of food eaten.

Satiation

The process during a meal that generates the negative feedback leading to its termination (within-meal inhibition).

Satiety

The degree of satisfaction and/or fullness following food consumption. This bears some reciprocal relationship to hunger and inhibits further motivation to eating.

Liking

The sensory pleasure elicited by contact with food contributing to the hedonic motivation to consume (wanting).

Wanting

The motivation to consume a specific food, manifesting explicitly (desire to eat) or implicitly.


Because a great deal of human behavior is both reactive and learned, it is possible that the environment can produce prompts, cues, and stimuli that influence learned patterns of motivation to eat. Because eating behavior is a significant determinant of energy balance it is often argued that manipulation or control of motivation to eat (commonly termed appetite control) can be used as a means to prevent excess energy intake and obesity, usually via putative mechanisms of satiety. This is a logical proposition particularly if appetite is not actually very tightly controlled with reference to overconsumption and the development of obesity. Some characteristics of the expression of appetite do appear to render individuals vulnerable to over-consumption of food - these characteristics can be regarded as risk factors that vary between individuals (16). Other significant and salient environmental, acquired, and inherited influences on eating behavior aside, there has been considerable work dedicated to trying to conceptualize and understand putative mechanisms that may link motivation to eat to food and energy intake.


A CONCEPTUAL THEORETICAL MODEL LINKING PHYSIOLOGY, MOTIVATION, AND BEHAVIOR TO FOOD INTAKE


One of the most commonly accepted theoretical models for the control of appetite is the satiety cascade, a putative network of interactions between physiological, psychological, and behavioral factors which form a psychobiological system. The term psychobiological assumes that physiological functions provide internal cues that may impact motivation to eat, and can be conceptualized on three levels (Figure 1). These are the levels of psychological events (hunger perception, cravings, and hedonic sensations) and behavioral operations (meals, snacks, energy, and macronutrient intakes); the level of peripheral physiology and metabolic events; and the level of neurotransmitter and metabolic interactions in the brain (17) (see for Andermann & Lowell (18) for a review of the central control of food intake). Appetite reflects the synchronous operation of events and processes in the three levels. Implicit in this theoretical model is the notion that the physiological signaling systems influence motivation to eat and that motivation to eat shapes eating behavior. The model suggests that neural events trigger and guide behavior, but each act of behavior involves a response in the peripheral physiological system. In turn, these physiological events are translated into brain neurochemical activity that is related to the strength of motivation to eat and the willingness to refrain from eating. In this model it is assumed that motivations to eat change with the aim of changing food intake to regulate energy balance. The lower part of the psychobiological system (Figure 1) illustrates the satiety cascade links motivation and behavior to peripheral and central signals related to eating. It also includes those behavioral actions which actually form the structure of eating, and those processes which follow the termination of eating and which are referred to as post-ingestive or post-prandial events.

Figure 1. The satiety cascade, as originally presented (17), showing the expression of appetite as the relationship between three levels of operations: the behavioral pattern, peripheral physiology and metabolism, and brain activity. See for Andermann & Lowell (18) for a more recent review of the central control of food intake. PVN, paraventricular nucleus; NST, nucleus of the tractus solitarius; CCK, cholecystokinin; FFA, free fatty acids; T: LNAA, tryptophan: large neutral amino acids.

EPISODIC AND TONIC SIGNALS OF APPETITE CONTROL


Traditionally a distinction has been drawn between episodic and tonic signals in the control of appetite (19). Episodic signals are mainly inhibitory (but can be excitatory) and are usually generated by episodes of eating. These signals oscillate in accordance with the pattern of eating, and most are closely associated with the signaling of satiety. Tonic signals arise from tissue energy stores such as adipose tissue and metabolically active tissues to exert some degree of feedback on the expression of appetite to match day-to-day food intake with longer-term energy needs. These two sets of signals, one set responding sharply to nutrient flux and the other providing a slow modulation of appetite and food intake, are integrated within complex brain networks that control the overall expression of appetite. Examination of these putative mechanisms tend to be more common in acute or short-term studies of ingestive behavior in which the primary change is motivation to eat or eating behavior rather than longer term studies. Short-term experiments are valuable for mechanistic understanding, but such studies often make the assumption that changes in the motivation to eat or eating behavior will translate in the long term into aspect of energy balance regulation. However, concentrating only on short-term effects without considering the longer-term time scale may fail to reveal the way that food intake is affected or energy balance is regulated as the experimental time window is much narrower than is relevant for such regulation to occur (e.g., weeks and months rather than minutes, hours or days). Put simply, many investigators may be looking for evidence of regulation over a period where no such regulation is likely to occur. It is therefore important to distinguish between longer term (tonic) mechanisms of putative energy balance regulation and shorter term (acute, episodic) mechanisms that may affect motivation to eat or EI.


Episodic Appetite Signals


Episodic signals are those physiological events that are triggered as responses to the ingestion of food. These form the inhibitory processes which first of all stop eating and then prevent its re-occurrence and are therefore termed satiety signals. The types of signals involved in terminating a meal (satiation) and preventing further consumption (post meal satiety) can be represented by the satiety cascade. Initially the brain is informed about the amount of food ingested and its nutrient content via sensory input. The gastrointestinal tract is equipped with specialized chemo- and mechano-receptors that monitor physiological activity and pass information to the brain mainly via the vagus nerve (20). This afferent information constitutes one class of ‘satiety signals and forms part of the pre-absorptive control of appetite. It is usual to identify a postabsorptive phase that arises when nutrients have undergone digestion and have crossed the intestinal wall to enter the circulation. These products, constitute the flux of energy and nutrients into the circulation, may be metabolized in the peripheral tissues or organs, or may enter the brain directly via the circulation. In either case, these products constitute a further class of metabolic satiety signals. Additionally, products of digestion and agents responsible for their metabolism may reach the brain and bind to specific chemoreceptors, influence neurotransmitter synthesis or alter some aspect of neuronal metabolism. In each case the brain is informed about some aspects of the metabolic state resulting from food consumption. It seems likely that chemicals released by gastric stimuli or by food processing in the gastro-intestinal tract are involved in the control of appetite (21). Many of these chemicals are peptide neurotransmitters, and many peripherally administered peptides cause changes in food consumption (22). (Please refer to ENDOTEXT chapter ‘Endocrinology of The Gut and the Regulation of Body Weight and Metabolism’ by Andrea Pucci and Rachel L. Batterham for additional information on gut hormones physiology).


Cholecystokinin


Cholecystokinin (CCK) is a hormone released in the proximal small intestine mediating meal termination (satiation) and possibly early phase satiety. CCK reduces meal size and also suppresses hunger before the meal; these effects do not depend on the nausea that sometimes accompanies an IV infusion (23). Food consumption (mainly protein and fat) stimulates the release of CCK (from duodenal mucosal cells), which in turn activates CCK-A type receptors in the pyloric region of the stomach. Fat in the form of free fatty acids (FFA) of carbon chain lengths C12 and above produce pronounced CCK releases (24, 25). This signal is transmitted via afferent fibers of the vagus nerve to the nucleus tractus solitarius (NTS) in the brain stem. From here the signal is relayed to the hypothalamic region where integration with other signals occurs.


Animal data suggest that endogenous CCK release mediates the pre-absorptive satiating effect of intestinal fat infusions, and may in turn be critical in regulating the intake of fat (26). As in rats, intestinal infusions of fat produce a reduction in food intake and promote satiety in humans (27). In humans the satiety effect of fat infused directly into the duodenum can be blocked by the CCKA receptor antagonist loxiglumide (28). High-fat breakfasts have been shown to produce both greater feelings of satiety (signified by reduced levels of hunger, desire to eat and prospective consumption) and elevated endogenous plasma CCK levels. Collectively, these studies support the theory that CCK plasma levels are a potent fat (or fatty acid) -stimulated endogenous satiety factor, whose effects on food intake and eating behavior are mediated by CCKA receptors.


It has also been shown that synthetic CCK-A type agonists suppress food intake in humans. A drug, known by the number ARL1718, caused a significant reduction in meal size and had a longer duration of action than observed after infusions of CCK itself. A number of other CCK analogues / CCK 1 receptor agonist treatments have been developed including most recently GW181771 (GlaxoSmithKline) and SR146131 (Sanofi-Aventis). Studies with such drugs, together with those on the peptide hormone itself, do suggest that CCK has the properties of a true satiation signal which contributes, under normal circumstances, to the termination of a meal. However, CCK is not uniquely involved in the expression of satiety and is also involved in a spectrum of physiological responses generated following nutrient consumption. The action of CCK certainly acts in concert with other meal-related events, such as gastric distention for example.


Glucagon-Like-Peptide-1


Glucagon-like peptide (GLP)-1 is an incretin hormone, released from the gut into the blood stream in response to intestinal nutrients. Endogenous GLP-1 levels increase following food intake, particular of carbohydrate (29, 30). These studies suggest a role for GLP-1 in mediating the effects of carbohydrate (specifically glucose) on appetite. In healthy men of normal weight, infusions of synthetic human GLP-1 (7-36) during the consumption of a fixed breakfast test meal, enhanced ratings of fullness and satiety when compared to the placebo infusion (31). During a later ad libitum lunch, food intake is also significantly reduced by the earlier GLP-1 infusion. Intravenous GLP-1 also dose-dependently reduces spontaneous food intake and adjusts appetite in healthy weight male volunteers. This marked reduction in food intake and enhancement in satiety is also observed in male patients living with overweight or obesity and type 2 diabetes. In men living with obesity, intravenous GLP-1 potently reduces food intake either during or post-infusion (32) and, at lower sub-anorectic doses, slows gastric emptying. Reductions in intake and slowed gastric emptying are accompanied by decreased feelings of hunger, desire to eat and prospective consumption, and a prolonged period of post-meal satiety. These data demonstrate that exogenous GLP-1 reduces food intake and enhances in satiety in humans, both those healthy weight and living with obesity. However, it should be kept in mind that the doses of GLP-1 often administered are usually higher than the normal values seen in blood after a meal. Consequently, although GLP-1 receptors could be a possible target for anti-obesity drugs, the physiological role of GLP-1 itself in the normal mediation of satiety is still not confirmed. Nonetheless, GLP-1 through its action as an incretin which prompts the release of insulin, will certainly have some indirect role on the pattern of eating behavior. Interestingly, two of the most promising drug options for people living with obesity are liraglutide and semaglutide; both GLP-1 agonists. These drugs have been shown to decrease hunger (33) and/or increase satiety (34). The action of the pharmacological agents may mean that people living with obesity gain some control over their eating behaviors, however longer-term studies are required to investigate their true potential. In addition, it should be noted that the GLP-1 receptors responsible for the anti-obesity action of semaglutide and liraglutide are located in the brain rather than the periphery.


Peptide YY 3-36


Peptide YY 3-36 (PYY 3-36) is one of the two main endogenous forms of PYY. It is produced from the cleavage of PYY 1-36 (the other major form of PYY) by dipeptidyl peptidase IV (DPP IV). PYY is a 36 amino acid ‘hind gut’ peptide released from endocrine cells in the distal small intestine and large intestine. This hormone is similar in structure to the orexigenic neuropeptide NPY (70% amino acid sequence identity), and in the past, PYY has been regarded, like NPY, as a potent stimulator of food intake. However, in a series of studies in rats, mice and in one human study (all included in one paper), Batterham et al. (35) have demonstrated that peripheral PYY 3-36 administration reduces food intake and inhibits weight gain in rodents. These effects on intake and body weight are not observed in transgenic animals lacking NPY Y2 receptors (the NPY Y2 receptor knock-out), thereby implicating these receptors in mediating the anorectic effects of PYY. PYY release in the distal intestine is triggered by a variety of nutrients, including fats (particularly FFA), some forms of fiber and bile acid (24, 25). In humans, endogenous PYY is released predominantly after, rather than during a meal (35, 36) and causes a decrease in gastric emptying (the so-called ‘ileal brake’). Thus, it is more associated with post-meal satiety. PYY (including PYY 3-36) can cross the blood brain barrier via a non-saturable mechanism. Moreover, some of the effects of peripheral PYY 3-36 on food intake are either independent of or dependent on vagal afferents running from the periphery to the brain (37, 38).


With regard to the effect of PYY on human appetite, Batterham et al. (35) demonstrated that in healthy humans a 90-minute PYY 3-36 infusion reduced hunger and subsequent food intake two hours later. In a further report, PYY infusions in people who were either a healthy weight or living with obesity caused a 30% reduction in lunch intake post infusion and decreased the 24 h energy intake by 23% in those with a healthy weight and by 16% in those living with obesity (36). The natural plasma levels of PYY were lower in those with living with obesity than in the healthy weight participants, and were inversely correlated with the body mass index. The lower levels of PYY in those with living with obesity could mean a weaker satiety signaling through this hormone and therefore a greater possibility of over-consumption. However, as the authors noted these effects required doses greater than the normal physiological range of endogenous PYY and marked nausea was observed in one experiment (39-41).


Amylin


Research has also focused on amylin, a pancreatic rather than a gastrointestinal hormone, which also has a potent effect on both food intake and body weight (42). Peripheral administration of amylin reduces food intake in mice and rats, and meal size in rats. Chronic or peripheral administration of amylin over a period of 5 to 10 days produces significant reductions in cumulative food intake and body mass of rats (43). Thus, amylin appears to be a component part of the appetite regulation system. The effects of amylin on human food intake, food choice or appetite expression has yet to be fully assessed. However, pramlintide (a human amylin analogue), given to replace deficits in endogenous amylin in people with diabetes, has been shown to alter body weight in people living with obesity and diabetes treated with insulin (44-46) and people with obesity without diabetes (47). In healthy weight participants pramlintide induces reductions in meal intake and duration, and reduces pre meal appetite (48). Similar effects of pramlintide on intake and eating behavior are reported in people living with obesity (with and without type 2 diabetes) (49, 50).


Ghrelin


In contrast to the peptides mentioned above, ghrelin is the only known excitatory peptide released in the gastrointestinal system. Ghrelin is a 28-amino acid peptide that stimulates the release of growth hormone from the pituitary (51). Secreted primarily from the stomach, it is also found in a number of other tissues (52, 53). Ghrelin was the first excitatory peptide discovered and acts upon the hypothalamic arcuate nucleus (51, 54, 55). The composition and action of ghrelin is uniquely modified by the addition of an octanoyl group to the serine residue at position three. Some studies suggest this acylation is crucial for ghrelin to bind to the growth hormone-secretagogue receptor (GHS-R) and cross the blood-brain barrier (56). Ghrelin’s effects on food intake are mediated by neuropeptide Y (NPY) and agouti-related protein in the central nervous system (57).


The majority (80-90%) of circulating ghrelin is in the deacylated form (51). Two theories have been proposed, firstly that deacylated ghrelin could result from incomplete acylation of the peptide, with both forms utilising differently regulated pathways, or secondly, that DG could result from the deacylation of ghrelin (58). More recently, deacylated ghrelin has been termed the inactive form. Ghrelin is thought to be involved in meal initiation as it is high during periods of fasting and decreases in response to food intake, thus suggesting a physiological role for ghrelin in meal initiation (59). Intravenous infusion or subcutaneous injection of ghrelin in humans increases both feelings of hunger and food intake (56, 60) and to promote increased food intake, weight gain and adiposity in rodents (60).


Satiety Cascade Peptides


In the overall control of the eating pattern, the sequential release and then de-activation of the peptides described above, can account for the evolving biological profile of influence over the sense of hunger and the feeling of fullness (61). The actions of these hormones therefore contribute to the termination of an eating episode (thereby controlling meal size) and subsequently influence the strength and duration of the suppression of eating after a meal. Evidence of this is shown by Gibbons et al. (62) whereby the post meal period was separated into early and late phases of satiety. It should be noted that whilst the profiles of peptide response shown in papers often show the expected increase and decrease (in the case of satiety peptides) and decrease and increase (in the case of ghrelin), there is a wide degree of individual variability in peptide responses. This is not often commented on, or shown. Furthermore, the majority of papers do not measure a range of peptides but rather focus on one or two. Individual variability in the release and maintenance of the levels of hormones (or the sensitivity of receptors) may determine whether some individuals are prone to snacking between meals or to other forms of opportunistic eating. The overall strength or weakness of the action of these peptides will help to determine whether individuals are resistant or susceptible to weight gain. Individual variability in the response of gut peptides to different food types has been shown more recently (63) and can be seen in Figure 2. At present, it does not appear that a poor response in one peptide means a poor response in all peptides, and it is likely that the cumulative response of the peptides (of which there are many) is key for the modulation of appetite and EI. Since different foods may produce the same effect on hunger and fullness but display quite distinctive profiles of post-prandial peptides, this suggests that the satiety signaling system is complex and there is no single unique pattern of peptides that defines satiety. This questions to what extent short term satiety can be accounted for by individual changes in putative satiety peptides, and what other factors may contribute to subjective satiety or cessation of eating behavior in humans.

Figure 2. Panel A shows the average ghrelin suppression after high fat and low-fat meals and Panel B and C shows the individual profiles of ghrelin for each participant after both high and low-fat meals. Adapted from (63).

TONIC SIGNALS OF APPETITE CONTROL


Ghrelin and the Hunger Drive


As noted above, ghrelin is an episodic peptide increasing during periods of fasting and decreasing in response to food intake. However, ghrelin is also unique since it has been proposed that in addition to being linked to the initiation of eating, ghrelin also acts as a compensatory hormone. Circulating ghrelin decreases in response to overfeeding and increases in response to chronic negative energy balance such as occurs with exercise or anorexia nervosa (64). This means that in people living with obesity and in animals experimentally made fat, circulating ghrelin levels would be reduced in an apparent attempt to restore a normal body weight status. Therefore, ghrelin illustrates the characteristics of both an episodic and tonic signal in appetite control. From meal to meal the oscillations in the ghrelin profile act to initiate and to suppress hunger; over longer periods of time, some factor associated with fat mass applies a general modulation over the profile of ghrelin and therefore, in principle, over the experienced intensity of hunger. At some point, it seems likely that people living with obesity are insensitive to lower ghrelin levels and/or other factors outweigh the relative importance of circulating ghrelin. When weight is lost, for example following a period of food restriction and weight loss, ghrelin levels would rise (or normalize), and therefore promote the feeling of hunger. This is likely to be one of the signals that makes the loss of body weight difficult to maintain. Ghrelin blockade therefore may prove a useful anti-obesity treatment. Whilst people living with obesity have lower fasting ghrelin levels, they have been shown to show a similar response to infused ghrelin as normal-weight participants, that is, increased food intake (65). Ghrelin levels in people living with obesity do fall after food, but not to the same degree as healthy weight participants in whom different calorie loads were shown to decrease ghrelin levels in a dose-response manner, but in people living with obesity this clarity was not shown as clearly (66). This points towards a potential mechanism for weight gain to be a consequence of a down regulation of gut peptide signaling and that the sensitivity to ghrelin is being overridden by other factors, for example, hedonic control of appetite. 


The Role of Leptin


One of the classical theories of appetite control has involved the notion of a long-term signal, leptin, which informs the brain about the state of energy stored in adipose tissue (67). In 1994 a mouse gene that controls the expression of a protein by adipose tissue which could be measured in the peripheral circulation (leptin) was discovery. It is now well accepted that there is a good correlation between the plasma levels of leptin and adipose tissue (68), and leptin interacts with NPY, one of the brain’s most potent neurochemicals involved in appetite, and with the melanocortin system, in the central control of appetite. Alongside other neuromodulators involved in a peripheral-central circuit, leptin links adipose tissue with central appetite mechanisms and metabolic activity. A number of mutations in the genes controlling molecules in the leptin-insulin pathways are associated with the loss of appetite control and obesity. For example, the MC4-R mutation (melanocortin concentrating hormone receptor 4) leads to an excessive appetite and massive obesity in children, similar to leptin deficiency. Studies have shown for individuals with a genetic form of leptin deficiency that leptin treatment produces dramatic weight loss, an effect associated with marked decreases in hunger (69-71). Further, the administration of exogenous leptin to humans, with either an insufficiency in or a specific deficit of endogenous leptin appears to strengthen within meal satiation and post meal satiety (71, 72). However, leptin-based obesity treatments for most individuals with obesity seem inappropriate given they appear leptin insensitive rather than leptin deficient. Indeed, despite extensive literature on leptin and other putative feedback signals arising from adipose tissue (73, 74), there appears to be limited evidence in humans of the extent to which changes in adipose tissue exert strong negative feedback on motivation to eat or EI in individuals in approximate daily energy balance or modest positive imbalances (as characterize the majority of individuals in the modern environment). As a number of questions still exist regarding the applicability of a 'lipostatic' control system to the regulation of appetite in humans free from congenital leptin deficiency (75). Consequently, recent models of human appetite have attempted to integrate the role of both FM and FFM into the control of appetite and energy balance to better account for the peripheral signals of appetite.


Fat-Free Mass and Resting Metabolic Rate and Associations with Appetite


A conceptual model of human appetite that incorporates the energetic demands of metabolically active tissues has been proposed, with a tonic drive to eat arising from components of energy expenditure (e.g., resting metabolic rate; RMR) and its main determinants (e.g., FFM). This model is based on a series of studies demonstating that FFM, but not FM, is associated with hunger and EI under conditons of energy balance (76-81) (see Figure 3). For example, Blundell et al. (78) reported that FFM was associated with self-selected (ad libitum) meal size and total daily EI in 93 individuals living with overweight or obesity. In contrast, no associations were found between FM and EI. Resting metabolic rate, of which FFM is the main determinant (82), has also been found to be associated within-day hunger sensations and EI (80, 81, 83). These findings have been replicated in studies employing a wide range of participants and under a variety of experimental conditions, with the associations between FFM and EI observed under laboratory (79-81, 84) and free-living settings (85, 86), in new born babies (87), adolescents (88, 89), normal weight women (90),people living with moderate (91) or extreme obesity (92), and people of varying ethnic origin (93, 94). These studies provide evidence that the relationship between FFM and EI exists across the entire age spectrum from birth (87), through childhood and adolescence (88) and into adulthood (78, 81, 84, 93, 95) and older age (96). There is also limited evidence that losses of both FFM and FM may be associated with changes in appetite (97) and weight regain (98) following weight loss, suggesting that integrated models of weight loss that account for FFM and FM losses may better explain changes in appetite during prolonged energy deficit (see below sections). However, there are few prospective longitudinal studies relating changes in functional body composition to appetite or EI, and where there is evidence, it often from studies with extreme weight loss induced via semi-starvation or military training.


Figure 3. Association between fat-free mass, resting metabolic rate and daily energy intake (top panels), and a path diagram illustrating a mediation model for the direct effects of FM and FFM on RMR and RMR on EI, the indirect effect of FM and FFM on EI mediated by RMR, and the squared multiple correlations (R2) for RMR and EI. Data originally reported in Hopkins et al. (80, 85).


While often not explicitly discussed in relation to models of human appetite, the concept that energy needs exert influence on food intake is not new. In 1962, Kenneth Blaxter (99) noted that the basal metabolism of mature animals of different species increases to a fractional power of weight, with small animals have a higher basal metabolism per kilogram of weight than the large ones. This implies that to maintain body weight, small animals must obtain each day from food a larger number of calories per unit of the weight the large ones. If the total habitual energy expenditures of different species are all about the same multiples of their basal energy expenditure, then both the calorie intake and the basal metabolism are likely to be proportional to the same fractional power of bodyweight. Furthermore, the energetic demands of individual tissue-organs such as the liver (100) or the growth and maintenance of lean tissues (101, 102) have previously been suggested as sources of appetitive feedback. For example, Millward’s protein-stat theory suggests that lean mass, and in particular skeletal muscle mass, is tightly regulated such that food intake (specifically, dietary protein) is directed to meet the needs of lean tissue growth and maintenance (101). This theory is based on the existence of an ‘aminostatic’ feedback mechanism in which food intake is adjusted in response to amino acid availability to meet the protein demands of lean tissue growth and maintenance.


Studies Examining the Associations between Fat-free Mass, Resting Metabolic Rate and Energy Intake


Using statistical mediation models, a number of cross-sectional studies conducted under conditions of energy balance have demonstrated that the effect of FFM on EI is mediated by RMR (80, 103) and total daily energy expenditure (TDEE) (104), suggesting that energy expenditure per se may exert influence over EI. For example, Hopkins et al. (80) reported that the effect of FFM on EI was fully mediated by RMR i.e. FFM had no ‘direct’ effect on EI but rather ‘indirectly‘ influenced EI via its effect on RMR. In agreement with these findings, Piaggi et al. (104) reported that TDEE accounting for 80% of the observed effect that FFM exerted on EI in 107 healthy individuals. Such findings suggest that the associations between FFM and RMR with EI may reflect a ‘mass-dependent’ effect arising from the energetic demands of FFM and its constituent tissue-organs rather than a specific endocrine signal secreted by these tissue-organs. However, it should be acknowledged that such findings represent statistical rather than biological pathways. Furthermore, skeletal muscle, a major component of FFM by weight, secretes a large number of myokines (105)which provide a molecular signal for bi-directional communication with other organs (106). While myokines such as interleukin 6 (107) and irisin (108) have been linked to food intake and energy expenditure, the specific role that these (and other myokines) play in the control of appetite is unclear.


An important consideration in the proposed relationship between FFM and EI is that FFM is a heterogeneous tissue compartment that is comprised of numerous individual tissue-organs with wide ranging metabolic functions and mass-specific metabolic rates (109-111). Tissue-organ structure and function are tightly coupled and determine their tissue-specific metabolic rate (112). In turn, the tissue-specific metabolic rates of individual organs summate to determine whole-body metabolic rate (e.g., RMR). The maintenance of tissue-organ structural integrity and function is therefore a metabolic priority (112), but to date there has been little attempt to integrate individual tissue-organs and their mass-specific energy expenditures into homeostatic models of human appetite. Recently however, Casanova et al., (113)used whole-body magnetic resonance imaging to examine whether the masses of high-metabolic rate organs (brain, liver, heart and kidneys) were associated with fasting hunger in 21 healthy males (age= 25 ± 3 years; BMI = 23.4 ± 2.1 kg/m2) (114). As expected, fasting hunger was associated with FFM (r = 0.39; p = 0.09) but not FM (r = -0.01; p = 0.99). Interestingley, the association between the combined masses of the high-metabolic rate organs and fasting hunger (r = 0.58; p = 0.01) was stronger than with FFM as a single uniform body compartment. In particular, liver (r = 0.51; p = 0.02) and skeletal muscle mass (rs = 0.57; p = 0.04) were strongly associated with fasting hunger. As the masses of the liver and skeletal muscle explained ~17% and ~21% of the variance in RMR, respectively, these findings again suggest that energy expenditure per se may exert influence over food intake.


Another important consideration is how behavioral components of total daily energy expenditure (e.g., physical activity or activity energy expenditure) influence energy intake. The effects of physical activity and/or exercise on appetite is discussed below. As noted, physical activity may influence the control of appetite via a number of physiological and psychological pathways (e.g., alterations in gastric emptying (115), appetite-related hormones (116), food reward (117), and eating behavior traits (118)). In addition, physical activity or exercise may also exert influence, albeit modestly, on appetite and EI via its contribution to TDEE. Hopkins et al. reported in 242 individuals in which physical activity and EI were measured under free-living conditions that activity energy expenditure was independently associated with daily EI alongside FFM and RMR (86). As activity energy expenditure only explained 3% of the variance in total daily EI, its effect on daily EI was much more modest than that seen for FFM or RMR. This is perhaps not surprising given the smaller and more variable contribution of physical activity energy expenditure to TDEE as compared to FFM and RMR (119). It could be argued that while FFM and RMR are well placed to exert stable influence over day-to-day food intake, the contribution of physical activity energy expenditure to daily EI is likely to be weaker and more variable (and therefore, also harder to quantify).


Factors Affecting the Strength of Association Between Fat-Free Mass and Energy Expenditure with Energy Intake


It has been suggested that excess FM may disrupt the coupling between FFM and EI, with associations between FFM and EI weaker in those living with obesity than in healthy weight individuals (90, 95, 104, 120). Early work by Cugini et al. reported that a positive association existed between FFM and hunger, while FM and hunger were negatively associated, in healthy weight individuals (121). However, no such associations were seen between FFM or FM and hunger in those living with obesity (120). Based on these data, the authors suggested that FM accumulation may disrupt the feedback mechanisms linking these tissues to hunger. More recently, Grannell et al. reported a positive association between FFM and EI during an ad libitum test meal in 43 individuals living with severe obesity, but the strength of this association was weaker in individuals with a higher BMI (92). To further explore the moderating effect of FM, Casanova et al., (90) examined the linear and non-linear associations between body composition (FFM and FM), energy expenditure (RMR and TDEE) and EI (ad libitum test meal intake and free-living 24-hour EI) in 45 healthy weight and 48 individuals living with obesity. Percentage body fat moderated the associations between RMR (β=-1.88; p=0.02) and TDEE (β=-1.91; p=0.03) with free-living 24-hour EI. Furthermore, FM was negatively associated with test meal EI only in the leaner group (r=-0.43; p=0.004), with a weak non-linear association observed between FM and EI in the whole sample (r2=0.092; p=0.04).


Such findings point to a non-linear relationships between FM and EI, and this may help account for why negative associations between FM and EI have been observed in healthy weight individuals (121, 122), but studies in those living with overweight or obesity often report no association between FM and EI (79, 88, 91, 123). A weaker negative association between FM and EI at higher body fatness is in line with the notion of leptin and insulin resistance (124, 125), which may alter central and peripheral sensitivity to appetite-related feedback signals (126-128). Furthermore, while the contribution of FM to RMR is smaller than FFM (129), its contribution to RMR becomes proportionally larger as FM increases with excessive weight gain. Therefore, differences in the strength and direction of association between FM and EI at higher body fatness may reflect the increased contribution of FM to body weight and RMR alongside a blunting of its inhibitory influence on EI. It should also be acknowledged that the associations between FM and EI likely reflects both biological and psychological factors. Indeed, Hopkins et al., (85) have demonstrated that psychological factors such as cognitive restraint are robust predictors of EI when considered alongside physiological determinants of EI (e.g. FFM and RMR), and have the potential to play a mediating role in the overall expression of EI (85). A recent paper also suggests that the associations between FFM and TDEE with EI may become weaker with age (96). Based on a secondary analysis of the Interactive Diet and Activity Tracking in AARP Study, a biomarker validation study of self-reported diet and PA measures in older adults, Hopkins et al., reported that FFM and TDEE (derived from doubly labelled water) predicted self-reported EI in 590 older adults (mean age 63.1 ± 5.9 years). Interestingly, while the associations between FFM or TDEE and EI existed across age quintiles, age moderated the associations between FFM and TDEE with EI such that these associations weakened with increasing age (96). Please refer to ENDOTEXT chapter ‘Control of Energy Expenditure in Humans’ by Klaas R Westerterp for additional information).
 

Associations Between Body Composition and Energy Intake During Prolonged Negative or Positive Energy Balances


Another important point to note is that the aforementioned associations between body composition, energy expenditure, and EI are from cross-sectional analysis performed in weight stable individuals at or close to energy balance. However, the effect of FFM on appetite appears to be dependent on energy balance status, with evidence suggesting that losses of FFM may also act as an orexigenic signal during energy deficit. During the Minnesota semi-starvation study (130), 32 healthy men undertook 24 weeks of semi-starvation (25% of weight loss), 12 weeks of controlled refeeding and 8 weeks of ad libitum refeeding. During the last phase (n = 12), hyperphagia remained until baseline levels of FFM were restored. This led to FM accumulation that surpassed baseline levels (i.e., “fat-overshoot”), a phenomenon that has been reported elsewhere following underfeeding or military training (131, 132). As hyperphagia persisted until FFM had been restored to pre-weight loss levels, it was suggested that independent appetitive feedback signals from both adipose tissue and FFM (e.g., a ‘proteinostatic’ mechanism) contributed to the changes in  hunger and food intake seen and restoration of body weight (133, 134).


While the demands imposed by semi-starvation or military training on energy balance clearly exceed those experienced during common diet and/or weight loss interventions, evidence also exists to suggest that FFM loss during clinically relevant weight loss may also act as an orexigenic signal. Following weight loss, it is commonly suggested that subjective hunger and orexigenic hormone concentrations increase (135, 136), but studies have also reported no change or reduced hunger following weight loss (137-139). The composition of the weight lost, which is a function of initial body fat, the rate and extent of weight loss, diet composition and exercise (140, 141), may also influence any accompanying changes in appetite. It has been suggested that greater FFM loss during weight loss is associated with increased hunger (97) and weight regain (98) following weight loss. To assess whether changes in body composition occurring during weight loss were associated with subsequent energy balance behaviors under conditions of therapeutic weight loss, Turicchi et al. conducted a systematic review and meta-regression examining weight loss studies in weight clinical weight loss was achieved (mean = 10.9%) and weight regain occurred in the follow-up period (mean = 5.4%) (98). They found that while both greater rate and amount of WL predicted weight regain, the composition of weight loss i.e. the (amount of FM and FFM) explained greater variance in weight loss alone (40% vs 29%) (98). Furthermore, Turicchi et al., reported that greater FFM loss following a 12% reduction in body weight via a low-calorie diet was associated with greater increases in hunger in men (r = 0.69, p = 0.002) but not women (r = 0.25, p = 0.24) (97). In line with these findings, after 5 weeks of very-low calorie diet (500kcal/d) or 12 weeks of low-calorie diet (1250kcal/d) Vink (142) reported that greater FFM loss during energy restriction was associated with greater weight regain during a subsequent 9-month follow-up period. Data examining FFM loss during extensive periods of energy deficit are therefore suggestive that FFM loss may be part of an integrated response driving post-weight loss increases in EI and weight regain, potentially as a means to restore the structural integrity of FFM compartments (although the influence of FFM loss appears more modest than FM loss). These data also emphasize the importance of developing integrative models of energy balance that consider the dynamic relationships between body structure, physiological function, and the way these mechanistic interactions influence key psychological and behavioral determinants of energy balance such as appetite. However, there are few prospective longitudinal studies relating changes in functional body composition to appetite or EI, and further research using advanced imaging methods for tissue-organ composition and multi-compartmental body composition models across a range of initial body compositions and weight losses would provide additional mechanistic insight (97).


Taken together, cross-sectional research in weight stable individuals indicates that greater FFM is associated with increased EI, but research also indicate that FFM loss is associated with increased appetite and EI. If greater FFM is associated with increased appetite, how is it that FFM loss during weight loss is also associated with increased appetite? One explanation is that FFM exerts ‘passive’ and ‘active’ effects on appetite under situations of differing energy balance (6, 143). At or near to energy balance, Dulloo et al. (143) has suggested that the energy demand of FFM and its constituent components create a ‘passive’ background pull on EI that ensures the energetic demands of metabolically active tissues are met through day-to-day food intake. In contrast, during weight loss, FFM loss may act as an ‘active’ orexigenic signal that stimulates increased hunger and EI in an attempt to ensure the preservation of FFM and the functional integrity of its constituent tissue-organs (143). However, it should be noted that long-term studies with longitudinal tracking of appetite, body composition and energy expenditure are rare, particularly under-conditions in which body composition is systematically manipulated.


Body weight gain leads to an expansion of FFM which increases RMR, but how such changes causally influence appetite or food intake has not been examined. As weight is gained, both FM and FFM expand but at different rates. While such changes may not drive weight gain per se, a higher FFM and associated RMR may increase the background tonic drive to eat, favoring maintenance of a higher body weight. Expansion of FM over the long term induces insulin and leptin resistance, expansion of FFM and, in extremis, some slight elevation of RMR, could account for the apparent diminishing negative feedback from FM as adipose tissue expands (90, 95, 104, 120). Therefore, it may be argued that any putative effect of FFM or RMR on the drive to eat may decrease with increasing BMI, since FFM and RMR increase at a decelerating rate with increase in weight, while the energy content of the body expands disproportionately as FM expands. While factors associated with energostatic models of appetite may be unlikely to drive body weight up in the first place, it is not inconsistent with maintenance of a higher body weight once this is achieved by other means. Thus, it may be that RMR is associated with EI at or close to energy balance, but that RMR (and its primary determinant FFM) become dissociated from the process of overconsumption during significant weight gain as the signal(s) becomes ‘overwhelmed’ by other stimuli important in driving weight gain e.g., food availability, sensory variety, dietary energy density and food reward.


HOMEOSTATIC AND HEDONIC PROCESSES OF APPETITE CONTROL


Food intake is clearly influenced by homeostatic processes of hunger and satiety, modulated according to short term and long-term signals of nutritional and energy status and moderated by lifestyle factors such as physical activity. However, human eating behavior is a complex phenomenon and people eat for many other reasons too: for friendship and celebration, in response to sadness or stress. All these cognitive and emotional motives converge on the fact that eating is a potent source of reward. It provides the eater with an instant but temporary hit of gratification. The greater the reward, the harder it is to resist the behaviors that produce it even when the consequences are risky or harmful and especially when the risk is removed in time. Therefore, a key issue in the study of appetite control is the relationship between hedonic and homeostatic drives (144). Historically, hedonic processes have been viewed as a function of nutritional need-state. In a state of depletion, the hedonic response (experienced palatability or pleasure) to energy providing foods is enhanced and when replete, the hedonic effect of these foods is reduced (145). This view is compatible with the association between energy density and palatability (146) and also that the consumption of fats and sugars “energy-dense nutrients“ may be under neuro-regulatory control (147). However, the idea of reward as merely serving the fulfilment of nutritional need is not sufficient to explain non-homeostatic food intake and it is perhaps more useful to try and distinguish the substrates of homeostatic and hedonic systems and to assign them separate identities (148).


Homeostasis and Hedonics: Cross-Talk and Interaction


Advances in our understanding of the molecular and neural mechanisms behind food intake regulation and appetite control are revealing how the reward system can interact with homeostatic mechanisms. For example, cannabinoid receptors and their endogenous ligands (e.g., anandamide) are implicated in the reward system. Peripheral and central administration of anandamide increased appetite in rodents, and this seemed to be related to alterations in incentive value (wanting) for palatable foods (149). However, the cannabinoid system has been shown to interact with homeostatic processes in a number of ways: Leptin signaling becomes defective when hypothalamic endocannabinoid levels are high (150); activation of CB1 receptors prevent the melanocortin system from altering food intake (151); furthermore, CB1 receptors can be found on adipocytes where they may directly increase lipogenesis (152). Opioid neurotransmission also forms part of the biological substrate mediating reward processes of consumption. For example, endogenous opioids are associated with the reinforcing effect of food (especially when palatable) (153, 154). However, there is evidence to show that in a fasted state, the reinforcing effect of food can be reinstated in enkephalin and β-endorphin knock-out mice (155). Therefore, homeostatic processes may interact with hedonic signaling to override selective reward deficit.


Hence although homeostatic and hedonic systems can be given separate identities (148), they are also - to an extent - inseparable, with neural cross-talk permitting functional interactions which may influence the organization of eating behavior. From this standpoint, the interaction of homeostatic and non-homeostatic pathways in the neuro-regulatory control of eating may be more important than the two systems studied in isolation. From behavioral and anatomical observations (156), it has been suggested that projections from the hypothalamus to the nucleus accumbens may modulate the motivation to eat via metabolic signals. Furthermore, direct and indirect projections from the accumbens to the hypothalamus may explain the ability for mesolimbic processes “activated by relevant environmental cues and incentives” to essentially hijack the homeostatic regulatory circuits and drive-up energy intake. Further research is necessary to identify the pathways that mediate such interactions; however progress has been made (157).


Liking vs. Wanting Food


The hedonic perspective on appetite control accounts for eating behavior motivated by the expectation or experience of pleasure from consuming specific foods and involves dissociable processes of “wanting” and “liking”. The “liking” component refers to the subjective experience of pleasure elicited by the sensory perception of food and is associated with the release of endogenous opioids acting on localized clusters of neurons termed “hedonic hotspots” (158) The “wanting” component of reward refers to the process by which food is assigned motivational significance or “incentive salience attribution” and is associated with the release of the neurotransmitter dopamine in the mesocorticolimbic pathway. This latter component can be activated by thoughts or cues signaling food and often precedes the actual receipt of food (159).


In human neuroimaging studies, regional differences in the neural activation to food stimuli during either anticipatory or consummatory phases of reward processing are broadly supportive of the distinction between liking versus wanting. Response to passive viewing of high- versus low-calorie foods or cues signaling the imminent receipt of a tasty food are more reliably observed in the amygdala and ventral striatum, whereas the response to the actual taste and consumption of a palatable food is associated with activation in the primary taste cortex in the insular and opercular cortices (160). Some researchers have proposed that differences between individuals who are healthy weight and those with obesity in neural activation to palatable food can be understood as a dissociation in both the direction and region of responding during the anticipatory and consummatory phases of food intake- with greater striatal activation in individuals living with obesity compared to healthy weight controls when a food is wanted but lower activation in liking-related regions when a food is actually tasted (161). However, several inconsistencies in the brain imaging literature have been noted (162), and further research is needed to substantiate this hypothesis.


Liking and wanting for food are often viewed in relation to subjective states or explicit feelings that refer to the everyday understanding of these terms in the context of food choice and food intake (163). Wanting might describe subjective states of desire, craving or perceived deprivation of pleasure, whereas liking is characteristically understood as the perceived hedonic effect of a food, the appreciation of its sensory properties or some evaluative judgment of its potential to give pleasure. As the subjective sensations of liking and wanting often overlap and are subject to interference or misinterpretation, their relationship with behavior is often difficult to discern (163). However, liking and wanting responses to food are not necessarily consciously monitored or even always accessible to the individual. Although people tend to be very good at estimating and reporting their liking for food, they are often unable to accurately gauge their implicit wanting for food (i.e., why they are unconsciously drawn to one food over another).


The hedonic aspect of eating is important in a well-functioning homeostatic system for the directing and motivating an adequate supply of nutrients and energy. Increasingly, evidence for the interplay between liking and wanting with hunger and satiety is helping to clarify the role of hedonics in the control and loss of control over food intake (164). This extension to the conventional homeostatic model recognizes that hedonic processes are affected by acute nutritional need states and might modulate food intake through their interaction with other physiological processes involved in satiation and satiety. Likewise, cognitive and sensory inputs implicated in food liking and wanting can modulate the metabolic processes associated with homeostatic control over food intake (165). In addition to the effect of liking and wanting on episodic appetite responses, more recent evidence is emerging to suggest that tonic signals of nutritional status might affect liking and wanting for food to influence food preference and the composition of the diet (164).


MODULATION OF APPETITE THROUGH PHYSICAL ACTIVITY


Physical Activity and Control of Food Intake


Some individuals believe that the energy expended during exercise will automatically drive-up hunger and food intake to compensate for the energy deficit incurred. However, evidence shows that interventions of acute exercise generate little or no immediate effect on levels of hunger or daily EI (see (166-170) for reviews). One reason that studies do not demonstrate an increase in EI following acute exercise could be that they fail to track EI for sufficiently long periods after the bout of exercise, or that the exercised-induced energy expenditure is not large enough to stimulate appetite. However, even with a high dose of exercise (gross exercise-induced increase in energy expenditure = 4.6 MJ) in a single day and following tracking of EI for the following two days, there is no automatic compensatory rise in hunger and EI (171).


Exercise training interventions have shown similar findings with regards to EI (169, 172). In a recent systematic review and meta-analysis of exercise training interventions in people living with overweight or obesity, Beaulieu et al. (172)found that among 25 exercise groups, exercise training (ranging 2-72 weeks) did not lead to any significant post-intervention differences in EI compared to non-exercise control groups. Meta-regression showed this was not affected by intervention duration. However, due to the high number of poor-quality studies (i.e., using self-reported measured of dietary intakes), further analyses were conducted in only fair/good quality studies (reduced to 5 exercise groups), and found a 102-kcal post-exercise difference between exercisers and controls. It is important to note that this is an effect observed on the average and does not illustrate inter-individual variability (discussed below). Therefore, over time, on average there may be small compensatory increases in EI in response to the increased energy demands from greater physical activity levels. Indeed, the review also found a small increase in fasting hunger after exercise training in 19 exercise groups (172). Nevertheless, depending on the daily energy expenditure accrued with exercise training, this should still lead to some degree of weight loss and favorable changes in body composition, as reviewed by Bellicha et al.(173). Small positive changes were also observed in relation to eating behavior traits, with a reduction in disinhibition (13 exercise groups) and an increase in restraint (12 exercise groups) assessed by the Three-Factor Eating Questionnaire (172). A small number of studies in the review also suggested that exercise training may reduce reward or preference for high-fat foods (172). Overall, most of the evidence indicates that exercise training in people living with overweight or obesity appears to have a relatively small but positive influence on eating behavior. This effect may be heightened with longer-term physical activity by altering the sensitivity of appetite regulation. It should be kept in mind that most exercise training studies are of modest duration (e.g. up to 72 weeks the meta-analysis of Beaulieu et al. (172)), and the long-term changes in appetite and eating behavior, and the time-course over which these occur, are yet to be fully understood. Fewer studies have examined the relationship between changes in energy expenditure and eating behavior in non-obese participants who do not have a preconceived goal associated with weight reduction.


Does Habitual Physical Activity Level Affect Appetite Sensitivity?


Appetite sensitivity refers to the capacity to detect over- or under-consumption with the potential to subsequently adjust intake accordingly. This can be achieved by compensating for a particular EI by adjusting the size of the next meal. There is some evidence to suggest that regular exercisers, or habitually physically active individuals, have a better capacity to control food intake and energy balance due to increased appetite sensitivity. Long et al. (174)demonstrated that habitual exercisers have an increased accuracy of short-term regulation of EI in comparison to non-exercisers. In this study, participants were given either a low or high energy preload for lunch, and were then asked to eat ad libitum from a test meal buffet. Energy intake did not significantly differ following the two preloads in the non-exercise group, indicating a weak compensation. However, the habitual exercisers demonstrated nearly full compensation (~90%) by reducing their EI following the high energy preload compared to the low energy preload. This study has been replicated in groups varying in objectively-assessed habitual physical activity levels (175). Similarly, Martins et al. (176) reported that the sensitivity of short-term appetite control increased in previously sedentary individuals following 6 weeks of aerobic exercise training, with participants again better able to adjust subsequent EI following high and low energy pre-loads following the exercise intervention. Furthermore, King et al. (177) examined the effects of 12 weeks of supervised aerobic exercise on hunger and satiety in 58 individuals living with overweight or obesity. Two separate processes were revealed that acted concurrently to influence the impact of exercise on appetite regulation. Post-intervention, a significant increase in fasting hunger was seen, but this increased orexigenic drive was offset by a parallel increase in post-prandial satiety (as measured in response to a fixed energy meal). Therefore, this ‘dual process’ may reflect the balance between the strength of tonic and episodic signaling following chronic exercise, and may be an important factor which determines whether individuals successfully lose weight or not. Interestingly, these improvements in appetite control appear to be related to satiety and perhaps not to satiation (178), but more research on the interplay between diet composition, satiation/satiety and physical activity level is required, as well as underlying mechanism.


Findings of improved appetite sensitivity with increased physical activity are in line with Jean Mayer’s work over 60 years ago. Mayer et al. (179) demonstrated a non-linear relationship between energy expenditure and EI in Bengali jute mill workers. Daily occupational physical activity and EI were closely matched in those performing physically demanding jobs. However, in those performing light or sedentary occupational roles, this coupling was lost such that daily EI exceeded expenditure. Such work has led Blundell et al. (180) to suggest a J relationship between physical activity and appetite regulation, with ‘regulated’ and ‘non-regulated’ zones of appetite regulation seen across the physical activity spectrum. Sedentary or low levels of physical activity coincide with an ‘unregulated zone’ of appetite in which EI and energy expenditure are disassociated (thereby promoting overconsumption of food at low levels of physical activity). At higher levels of physical activity however, stronger regulation of appetite and food intake exists such that EI better matches energy expenditure. This would promote the better maintenance of energy balance, albeit at higher levels of absolute intake and expenditure, i.e. higher ‘energy turnover/flux’ (180). This non-linear relationship has since been replicated in a systematic review (181) and in a study of over 400 participants (182). The model proposed by Blundell was recently updated by Beaulieu et al. (183), as shown in Figure 4. Furthermore, emerging evidence from a highly-controlled metabolic chamber study suggests that appetite control is indeed improved at higher levels of energy turnover (184). Longer-term studies are required to understand the impact of high energy turnover on appetite control, but it is believed that high levels of EI relative to expenditure may improve weight management via a favorable impact on physiological adaptations (185).
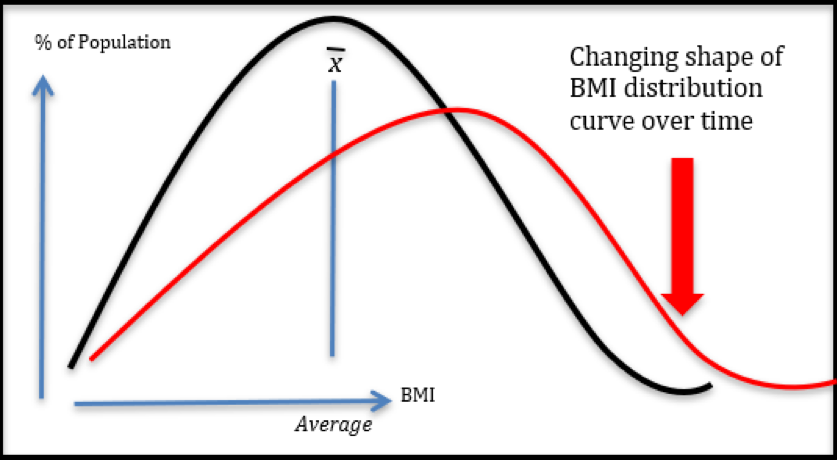
Figure 4. Regulated and non-regulated zones of appetite with varying levels physical activity from Beaulieu et al. (183). Model based on Jean Mayer’s study in Bengali jute mill workers (179) and previously published in Blundell (180).

While the mechanisms behind an improvement in appetite control with regular physical activity remains unclear, insulin sensitivity has been proposed as one mechanism by which activity-induced improvements in appetite regulation may occur. Exercise is known to increase insulin sensitivity (186-188), and insulin sensitivity is known to be involved in satiety induced by particular foods (189) and in the compensatory response to high energy loads (190). A further mechanism by which exercise could affect appetite is through altering gut peptide action. For example, CCK is implicated in the short-term regulation of appetite, and levels of CCK have been shown to rise after exercise (191). Interestingly, Martins et al. (192) measured fasting and post-prandial levels of orexigenic (total and acylated ghrelin) and anorexigenic (PYY, GLP-1) peptides in 15 individuals living with overweight or obesity during 12 weeks of supervised aerobic exercise. A significant increase in fasting hunger was again seen following the intervention, but this was offset by greater satiety in response to a fixed energy meal following the intervention. Interestingly, there was also a significant increase in the suppression of acylated ghrelin following the fixed energy meal, and a tendency toward an increase in the post-prandial release of GLP-1 following the exercise intervention. These hormonal responses would have acted to augment satiety during the post-prandial period. Further work by Gibbons et al. (193)revealed that exercise training had no overall impact on pre and postprandial appetite peptide release; however, differences emerged when participants were classified as ‘responders’ and ‘non-responders’. Compared to non-responders, responders had overall greater suppression of acylated ghrelin and greater increase in GLP-1 and total PYY. This effect was independent of the exercise intervention as differences were observed from baseline. Therefore, the specific role that appetite-related peptides play in activity-induced improvements in appetite regulation remains to be fully understood.


In addition to gastrointestinal mechanisms, it is important to understand how physical activity timing and patterns impact energy balance and appetite control. Physical activity can be prescribed by the FITT principle: frequency, intensity, time (duration) and type, and more recently, timing as another parameter has been proposed, as emerging evidence suggests that when exercise is performed relative to a meal or the time-of-day may influence obesity and cardiometabolic health in both adults and children (194). Indeed, physical activity is also another cue that influences circadian rhythms (195). In a systematic review and meta-analysis of exercise training interventions in individuals living with overweight or obesity (117), only 3 studies (1 RCT) on diurnal exercise timing were identified (196-198).These studies, in addition to observational studies (reviewed in (199)), suggest that early relative to late day exercise timing may lead to greater weight/fat loss. However, a recent RCT suggests no effect of exercise timing on weight loss, but this may have been due to the relatively low dose of aerobic exercise (200). The underlying mechanisms the greater weight loss in response to early exercise timing likely involve an impact on both behavioral and physiological processes regulating energy balance and appetite control (201). Performing morning exercise may lead to greater weight loss by enhancing the satiety response to food throughout the day, reducing the desire for and intake of high-energy-dense foods, and shifting food intake timing to earlier in the day, thus reducing daily energy intake (199).Evidence for this hypothesis is scarce, with an acute study showing that morning exercise led to greater post-exercise satiety; however, this was not examined in response to actual food intake (196). More rigorous research in this area is needed to clarify these proposed effects.


CONCLUSION


The control of food intake in humans is a biopsychological phenomenon. Motivation to eat is an important factor influencing food intake if the environment does not constrain behavior. Food intake is not necessarily solely related to situations of nutritional depletion and can be influenced by a number of homeostatic and non-homeostatic factors. Appetites are often learned and frequently sensory specific. The implication of asymmetric energy balance regulation is that food intake is under stronger physiological control in relation to negative energy balances, whereas in a state of energy balance or positive energy balances the linkages between physiological signaling and subjective motivation to eat are weaker. In obesogenic environments where palatable, energy dense food is ubiquitous, intake can easily exceed energy requirements due to motivation underpinned by food reward. Another consideration is how physical activity or exercise influence energy intake. Physical activity may influence the control of appetite via a number of pathways (e.g., alterations in gastric emptying, appetite-related hormones, food reward, circadian synchrony).


REFERENCES


  1. Bernard, M., Leçons de physiologie expérimentale appliquée à la médecine faites au Collège de France. 1855.
  2. Cannon, W.B., The wisdom of the body. 1932.
  3. Richter, C.P., Total self-regulatory functions in animals and human beings. Harvey Lecture Series, 1943. 38(63): p. 1942-1943.
  4. Michie, S., M.M. Van Stralen, and R.J.I.s. West, The behaviour change wheel: a new method for characterising and designing behaviour change interventions. Implementation Science, 2011. 6(1): p. 1-12.
  5. Casanova, N., et al., Metabolic adaptations during negative energy balance and their potential impact on appetite and food intake. Proceedings of the Nutrition Society, 2019. 78(3): p. 279-289.
  6. Stubbs, R.J., et al., Potential effects of fat mass and fat-free mass on energy intake in different states of energy balance. European journal of clinical nutrition, 2018. 72(5): p. 698.
  7. Polidori, D., et al., How strongly does appetite counter weight loss? Quantification of the feedback control of human energy intake. Obesity, 2016. 24(11): p. 2289-2295.
  8. Stubbs, R.J. and J. Turicchi, From famine to therapeutic weight loss: Hunger, psychological responses, and energy balance-related behaviors. Obes Rev, 2021. 22 Suppl 2: p. e13191.
  9. Joosen, A.M. and K.R. Westerterp, Energy expenditure during overfeeding. Nutr Metab (Lond), 2006. 3: p. 25.
  10. Forbes, G.B., Lean body mass-body fat interrelationships in humans. Nutr Rev, 1987. 45(8): p. 225-231.
  11. Hall, K.D., Body fat and fat-free mass inter-relationships: Forbes's theory revisited. Br J Nutr, 2007. 97(6): p. 1059-1063.
  12. Stubbs, R., S. Whybrow, and J. Blundell, Appetite- Psychobiological and Behavioral Aspects, in Encyclopedia of Human Nutrition. 2012, Elsevier Science.
  13. Martin, A.A., Why can't we control our food intake? The downside of dietary variety on learned satiety responses. Physiology & Behavior 2016. 162: p. 120-129.
  14. Blundell, J., et al., Appetite control: methodological aspects of the evaluation of foods. Obesity Reviews, 2010. 11(3): p. 251-270.
  15. Finlayson, G., N. King, and J. Blundell, Liking vs. wanting food: importance for human appetite control and weight regulation. Neuroscience & Biobehavioral Reviews, 2007. 31(7): p. 987-1002.
  16. Drapeau, V., et al., Behavioural and metabolic characterisation of the low satiety phenotype. Appetite, 2013. 70: p. 67-72.
  17. Blundell, J., Pharmacological approaches to appetite suppression. Trends in Pharmacological Sciences, 1991. 12: p. 147-157.
  18. Andermann, M.L. and B.B. Lowell, Toward a wiring diagram understanding of appetite control. J Neuron, 2017. 95(4): p. 757-778.
  19. Halford, J.C.G. and J.E. Blundell, Separate systems for serotonin and leptin in appetite control. Annals of Medicine, 2000. 32(3): p. 222-232.
  20. Mei, N., Intestinal chemosensitivity. Physiological reviews, 1985. 65(2): p. 211-237.
  21. Read, N., S. French, and K. Cunningham, The role of the gut in regulating food intake in man. Nutrition reviews, 1994. 52(1): p. 1-10.
  22. Smith, G., et al., Afferent information in the control of eating, in Obesity: Towards a Molecular Approach. , G. Bray and A. Liss, Editors. 1990, Alan R. Liss: New York. p. 63-79.
  23. Greenough, A., et al., Untangling the effects of hunger, anxiety, and nausea on energy intake during intravenous cholecystokinin octapeptide (CCK-8) infusion. Physiology & behavior, 1998. 65(2): p. 303-310.
  24. Feltrin, K., et al., Effect of fatty acid chain length on suppression of ghrelin and stimulation of PYY, GLP-2 and PP secretion in healthy men. Peptides, 2006. 27(7): p. 1638-1643.
  25. Little, T.J., et al., Free fatty acids have more potent effects on gastric emptying, gut hormones, and appetite than triacylglycerides. Gastroenterology, 2007. 133(4): p. 1124-1131.
  26. Greenberg, D., G.P. Smith, and J. Gibbs, Cholecystokinin and the satiating effect of fat. Gastroenterology, 1992. 102(5): p. 1801-1803.
  27. Welch, I., K. Saunders, and N. Read, Effect of Ileal and Intravenous Infusions of Fat Emqlsiony on Feeding and Satiety in Human Vohnteers. Gastroenterology, 1985. 89(129): p. 3-7.
  28. Lieverse, R., et al., Effect of a low dose of intraduodenal fat on satiety in humans: studies using the type A cholecystokinin receptor antagonist loxiglumide. Gut, 1994. 35(4): p. 501-505.
  29. Lavin, J.H., et al., Interaction of insulin, glucagon-like peptide 1, gastric inhibitory polypeptide, and appetite in response to intraduodenal carbohydrate. The American journal of clinical nutrition, 1998. 68(3): p. 591-598.
  30. Ranganath, L., et al., Attenuated GLP-1 secretion in obesity: cause or consequence? Gut, 1996. 38(6): p. 916-919.
  31. Flint, A., et al., Glucagon-like peptide 1 promotes satiety and suppresses energy intake in humans. Journal of Clinical Investigation, 1998. 101(3): p. 515.
  32. Naslund, E., et al., Glucagon-like peptide 1 increases the period of postprandial satiety and slows gastric emptying in obese men. The American journal of clinical nutrition, 1998. 68(3): p. 525-530.
  33. Horowitz, M., et al., Effect of the once-daily human GLP-1 analogue liraglutide on appetite, energy intake, energy expenditure and gastric emptying in type 2 diabetes. 2012. 97(2): p. 258-266.
  34. Blundell, J., et al., Effects of onceweekly semaglutide on appetite, energy intake, control of eating, food preference and body weight in subjects with obesity. 2017. 19(9): p. 1242-1251.
  35. Batterham, R.L., et al., Gut hormone PYY3-36 physiologically inhibits food intake. Nature, 2002. 418: p. 650-654.
  36. Batterham, R., et al., Inhibition of food intake in obese subjects by peptide YY3-36. New England Journal of Medicine, 2003. 349(10): p. 941.
  37. Renshaw, D. and R. Batterham, Peptide YY: a potential therapy for obesity. Current drug targets, 2005. 6(2): p. 171-179.
  38. Koda, S., et al., The role of the vagal nerve in peripheral PYY3–36-induced feeding reduction in rats.Endocrinology, 2005. 146(5): p. 2369-2375.
  39. Degen, L., et al., Effect of peptide YY 3–36 on food intake in humans. Gastroenterology, 2005. 129(5): p. 1430-1436.
  40. Sloth, B., et al., Effects of PYY1–36 and PYY3–36 on appetite, energy intake, energy expenditure, glucose and fat metabolism in obese and lean subjects. American Journal of Physiology-Endocrinology and Metabolism, 2007. 292(4): p. E1062-E1068.
  41. Sloth, B., et al., Effect of subcutaneous injections of PYY1-36 and PYY3-36 on appetite, ad libitum energy intake, and plasma free fatty acid concentration in obese males. American Journal of Physiology-Endocrinology and Metabolism, 2007. 293(2): p. E604-E609.
  42. Reda, T.K., A. Geliebter, and F.X. Pi‐Sunyer, Amylin, food intake, and obesity. Obesity research, 2002. 10(10): p. 1087-1091.
  43. Rushing, P.A., et al., Inhibition of central amylin signaling increases food intake and body adiposity in rats.Endocrinology, 2001. 142(11): p. 5035-5035.
  44. Hollander, P., et al., Addition of pramlintide to insulin therapy lowers HbA1c in conjunction with weight loss in patients with type 2 diabetes approaching glycaemic targets. Diabetes, Obesity and Metabolism, 2003. 5(6): p. 408-414.
  45. Hollander, P., et al., Effect of Pramlintide on Weight in Overweight and Obese InsulinTreated Type 2 Diabetes Patients. Obesity research, 2004. 12(4): p. 661-668.
  46. Riddle, M., et al., Pramlintide improved glycemic control and reduced weight in patients with type 2 diabetes using basal insulin. Diabetes Care, 2007. 30(11): p. 2794-2799.
  47. Aronne, L. and Z. Thornton‐Jones, New targets for obesity pharmacotherapy. Clinical Pharmacology & Therapeutics, 2007. 81(5): p. 748-752.
  48. Chapman, I., et al., Lowdose Pramlintide Reduced Food Intake and Meal Duration in Healthy, NormalWeight Subjects. Obesity, 2007. 15(5): p. 1179-1186.
  49. Chapman, I., et al., Effect of pramlintide on satiety and food intake in obese subjects and subjects with type 2 diabetes. Diabetologia, 2005. 48(5): p. 838-848.
  50. Smith, S.R., et al., Pramlintide treatment reduces 24-h caloric intake and meal sizes and improves control of eating in obese subjects: a 6-wk translational research study. American Journal of Physiology-Endocrinology and Metabolism, 2007. 293(2): p. E620-E627.
  51. Kojima, M., et al., Ghrelin is a growth-hormone-releasing acylated peptide from stomach. Nature, 1999. 406: p. 656-660.
  52. Caminos, J.E., et al., The endogenous growth hormone secretagogue (ghrelin) is synthesised and secreted by chondrocytes. Journal of Endocrinology, 2005. 146(3): p. 1285-1292.
  53. Kojima, M. and K. Kangawa, Ghrelin: structure and function. Physiology Review, 2005. 85: p. 495-522.
  54. Wren, A.M., et al., The novel hypothalamic peptide ghrelin stimulates food intake and growth howmone secretion. Journal of Endocrinology, 2000. 141: p. 4325-4328.
  55. Nakarzato, M., et al., A role for ghrelin in the central regulation of feeding. Nature, 2001. 409: p. 194-198.
  56. Murphy, K., W. Dhillo, and S. Bloom, Gut peptides in the regulation of food intake and energy homeostasis.Endocrine reviews, 2006. 27(7): p. 719.
  57. Chen, H.Y., et al., Orexigenic action of peripheral ghrelin is mediated by neuropeptide Y and agouti-related protein. Journal of Endocrinology, 2004. 145: p. 2607-2612.
  58. Soares, J. and A. Leite-Moreira, Ghrelin, des-acyl ghrelin and obestatin: three pieces of the same puzzle.Peptides, 2008.
  59. Cummings, D.E., et al., A preprandial rise in plasma ghrelin levels suggests a role in meal initiation in humans.Diabetes, 2001. 50: p. 1714-1719.
  60. Wren, A.M., et al., Ghrelin enhances appetite and increases food intake in humans. The Journal of Clinical Endocrinology & Metabolism, 2001. 86(12): p. 5992-5995.
  61. Blundell, J.E. and E. Naslund, Glucagon-like peptide-1, satiety and appetite control. British Journal of Nutrition, 1999. 81(04): p. 259-260.
  62. Gibbons, C., et al., Comparison of postprandial profiles of ghrelin, active GLP-1, and total PYY to meals varying in fat and carbohydrate and their association with hunger and the phases of satiety. The Journal of Clinical Endocrinology & Metabolism, 2013. 98(5): p. E847-E855.
  63. Hopkins, M., et al., Mechanisms responsible for homeostatic appetite control: theoretical advances and practical implications. Expert Review of Endocrinology & Metabolism, 2017. 12(6): p. 401-415.
  64. Tschop, M., et al., Circulating ghrelin levels are decreased in human obesity. Diabetes, 2001. 50: p. 707-709.
  65. Druce, M.R., et al., Ghrelin increases food intake in obese as well as lean subjects. International Journal of Obesity, 2005. 14: p. 1130-1136.
  66. Le Roux, C., et al., Postprandial plasma ghrelin is suppressed proportional to meal calorie content in normal-weight but not obese subjects. 2005. 90(2): p. 1068-1071.
  67. Weigle, D., Appetite and the regulation of body composition. The FASEB Journal, 1994. 8(3): p. 302-310.
  68. Maffei, M., et al., Leptin levels in human and rodent: measurement of plasma leptin and ob RNA in obese and weight-reduced subjects. Nature medicine, 1995. 1(11): p. 1155-1161.
  69. Farooqi, I.S., et al., Effects of recombinant leptin therapy in a child with congenital leptin deficiency. New England Journal of Medicine, 1999. 341(12): p. 879-884.
  70. Farooqi, I.S., et al., Beneficial effects of leptin on obesity, T cell hyporesponsiveness, and neuroendocrine/metabolic dysfunction of human congenital leptin deficiency. The Journal of clinical investigation, 2002. 110(8): p. 1093-1103.
  71. Williamson, D.A., et al., Microanalysis of eating behavior of three leptin deficient adults treated with leptin therapy. Appetite, 2005. 45(1): p. 75-80.
  72. McDuffie, J.R., et al., Effects of exogenous leptin on satiety and satiation in patients with lipodystrophy and leptin insufficiency. The Journal of Clinical Endocrinology & Metabolism, 2004. 89(9): p. 4258-4263.
  73. Morton, G., et al., Central nervous system control of food intake and body weight. Nature, 2006. 443(7109): p. 289-295.
  74. Woods, S.C. and D.S. Ramsay, Food intake, metabolism and homeostasis. Physiology & behavior, 2011. 104(1): p. 4-7.
  75. Jequier, E., Leptin signaling, adiposity, and energy balance. Annals of the New York Academy of Sciences, 2002. 967(1): p. 379-388.
  76. Weise, C., et al., Body composition and energy expenditure predict ad-libitum food and macronutrient intake in humans. International Journal of Obesity, 2013. doi:10.1038/ijo.2013.85.
  77. Cugini, P., et al., Daily hunger sensation and body composition: I. Their relationships in clinically healthy subjects. Eating and weight disorders, 1998. 3(4): p. 168-72.
  78. Blundell, J.E., et al., Body composition and appetite: fat-free mass (but not fat mass or BMI) is positively associated with self-determined meal size and daily energy intake in humans. British Journal of Nutrition, 2011. 107(3): p. 445-49.
  79. Lissner, L., et al., Body composition and energy intake: do overweight women overeat and underreport? The American journal of clinical nutrition, 1989. 49(2): p. 320-325.
  80. Hopkins, M., et al., Modelling the Associations between Fat-free Mass, Resting Metabolic Rate and Energy Intake in the Context of Total Energy Balance. International journal of obesity, 2015. 40(2): p. 312-8.
  81. Caudwell, P., et al., Resting metabolic rate is associated with hunger, self-determined meal size, and daily energy intake and may represent a marker for appetite. American Journal of Clinical Nutrition, 2013. 97(1): p. 7-14.
  82. Johnstone, A.M., et al., Factors influencing variation in basal metabolic rate include fat-free mass, fat mass, age, and circulating thyroxine but not sex, circulating leptin, or triiodothyronine. The American journal of clinical nutrition, 2005. 82(5): p. 941-948.
  83. Westerterp-Plantenga, M.S., et al., Habitual meal frequency in relation to resting and activity-induced energy expenditure in human subjects: the role of fat-free mass. British journal of nutrition, 2003. 90(03): p. 643-649.
  84. McNeil, J., et al., Investigating predictors of eating: is resting metabolic rate really the strongest proxy of energy intake? The American Journal of Clinical Nutrition, 2017. 106(5): p. 1206-1212.
  85. Hopkins, M., et al., Biological and psychological mediators of the relationships between fat mass, fat-free mass and energy intake. International journal of obesity, 2019. 43(2): p. 233-242.
  86. Hopkins, M., et al., Activity energy expenditure is an independent predictor of energy intake in humans.International Journal of Obesity, 2019. 43(7): p. 1466-1474.
  87. Wells, J.C., et al., The" drive to eat" hypothesis: energy expenditure and fat-free mass but not adiposity are associated with milk intake and energy intake in 12 week infants. The American Journal of Clinical Nutrition, 2021. 114(2): p. 505-514.
  88. Cameron, J.D., et al., Body Composition and Energy Intake—Skeletal Muscle Mass is the Strongest Predictor of Food Intake in Obese Adolescents: The HEARTY Trial. Applied Physiology, Nutrition, and Metabolism, 2016. 41(6): p. 611-7.
  89. Vainik, U., et al., Diet misreporting can be corrected: confirmation of the association between energy intake and fat-free mass in adolescents. British Journal of Nutrition, 2016. 116(8): p. 1425-1436.
  90. Casanova, N., et al., Body Fatness Influences Associations of Body Composition and Energy Expenditure with Energy Intake in Healthy Women. Obesity, 2021. 29(1): p. 125-132.
  91. Blundell, J., et al., Body composition and appetite: fat-free mass (but not fat-mass or BMI) is positively associated with self-determined meal size and daily energy intake in humans. British Journal of Nutrition, 2012. 107: p. 445-459.
  92. Grannell, A., et al., Fat free mass is positively associated with hunger and energy intake at extremes of obesity.Appetite, 2019. 143: p. 104444.
  93. Weise, C., et al., Body composition and energy expenditure predict ad-libitum food and macronutrient intake in humans. International Journal of Obesity, 2013. 38(2): p. 243-51.
  94. Bi, X., et al., Basal Metabolic Rate and Body Composition Predict Habitual Food and Macronutrient Intakes: Gender Differences. Nutrients, 2019. 11(11): p. 2653.
  95. Grannell, A., et al., Fat free mass is positively associated with hunger and energy intake at extremes of obesity.Appetite, 2019. 143: p. 104444.
  96. Hopkins, M., et al., Fat-Free Mass and Total Daily Energy Expenditure Estimated using Doubly Labelled Water Predict Energy Intake in a Large Sample of Community-Dwelling Older Adults. 2021.
  97. Turicchi, J., et al., Associations between the proportion of fat-free mass loss during weight loss, changes in appetite, and subsequent weight change: results from a randomized 2-stage dietary intervention trial. Am J Clin Nutr, 2020.
  98. Turicchi, J., et al., Associations between the rate, amount, and composition of weight loss as predictors of spontaneous weight regain in adults achieving clinically significant weight loss: A systematic review and meta-regression. Obes Rev, 2019. 20(7): p. 935-946.
  99. Blaxter, K., The Energy Metabolism of Ruminants. 1962: Springfield, Ill., Thomas.
  100. Langhans, W., Fatty acid oxidation in the energostatic control of eating--A new idea. Appetite, 2008. 51(3): p. 446-451.
  101. Millward, D.J., A protein-stat mechanism for regulation of growth and maintenance of the lean body mass.Nutrition research reviews, 1995. 8(01): p. 93-120.
  102. Mellinkoff, S.M., et al., Relationship between serum amino acid concentration and fluctuations in appetite.Journal of Applied Physiology, 1956. 8(5): p. 535.
  103. Hopkins, M., et al., Biological and psychological mediators of the relationships between fat mass, fat-free mass and energy intake. International Journal of Obesity, 2018.
  104. Piaggi, P., et al., Higher daily energy expenditure and respiratory quotient, rather than fat free mass, independently determine greater ad libitum overeating. The Journal of Clinical Endocrinology & Metabolism, 2015: p. jc. 2015-2164.
  105. Pedersen, B.K. and M.A. Febbraio, Muscles, exercise and obesity: skeletal muscle as a secretory organ. Nature Reviews Endocrinology, 2012. 8(8): p. 457-465.
  106. Trayhurn, P., C.A. Drevon, and J. Eckel, Secreted proteins from adipose tissue and skeletal muscle-adipokines, myokines and adipose/muscle cross-talk. Archives of physiology and biochemistry, 2011. 117(2): p. 47-56.
  107. Ropelle, E.R., et al., IL-6 and IL-10 anti-inflammatory activity links exercise to hypothalamic insulin and leptin sensitivity through IKKβ and ER stress inhibition. PLoS biology, 2010. 8(8): p. e1000465.
  108. Swick, A.G., S. Orena, and A. O’Connor, Irisin levels correlate with energy expenditure in a subgroup of humans with energy expenditure greater than predicted by fat free mass. Metabolism, 2013. 63(8): p. 1070-1073.
  109. Gallagher, D., et al., Organ-tissue mass measurement allows modeling of REE and metabolically active tissue mass. Am J Physiol, 1998. 275(2 Pt 1): p. E249-58.
  110. Elia, M., Organ and tissue contribution to metabolic rate. Energy metabolism: tissue determinants and cellular corollaries, 1992. 1992: p. 19-60.
  111. Javed, F., et al., Brain and high metabolic rate organ mass: contributions to resting energy expenditure beyond fat-free mass. Am J Clin Nutr, 2010. 91(4): p. 907-12.
  112. Heymsfield, S.B., et al., The anatomy of resting energy expenditure: body composition mechanisms. European journal of clinical nutrition, 2019. 73(2): p. 166-171.
  113. Casanova, N., et al., The Between-Subject Variance in Fasting Hunger in Healthy Men is Better Explained When Fat-free Mass is Assessed at the Tissue-Organ Level. Appetite, 2021. 105561: p. 1.
  114. Casanova, N., et al., Associations between high-metabolic rate organ masses and fasting hunger: A study using whole-body magnetic resonance imaging in healthy males. Physiol Behav, 2022. 250: p. 113796.
  115. Horner, K., et al., The effects of weight loss strategies on gastric emptying and appetite control. Obesity Reviews, 2011: p. 935-951.
  116. Stensel, D., Exercise, appetite and appetite-regulating hormones: implications for food intake and weight control. Annals of nutrition and metabolism, 2010. 57(2): p. 36-42.
  117. Beaulieu, K., P. Oustric, and G. Finlayson, The Impact of Physical Activity on Food Reward: Review and Conceptual Synthesis of Evidence from Observational, Acute, and Chronic Exercise Training Studies. Current Obesity Reports, 2020: p. 1-18.
  118. Bryant, E., N. King, and J. Blundell, Disinhibition: its effects on appetite and weight regulation. Obesity Reviews, 2008. 9(5): p. 409-419.
  119. Johnstone, A., et al., Additional anthropometric measures may improve the predictability of basal metabolic rate in adult subjects. European Journal of Clinical Nutrition, 2006. 60(12): p. 1437-1444.
  120. Cugini, P., et al., Daily hunger sensation and body compartments: II. Their relationships in obese patients.Eating and Weight Disorders-Studies on Anorexia, Bulimia and Obesity, 1999. 4(2): p. 81-88.
  121. Cugini, P., et al., Daily hunger sensation and body composition: I. Their relationships in clinically healthy subjects. Eating and Weight Disorders-Studies on Anorexia, Bulimia and Obesity, 1998. 3(4): p. 168-172.
  122. Blundell, J.E., et al., The biology of appetite control: Do resting metabolic rate and fat-free mass drive energy intake? Physiol Behav, 2015. 152(Pt B): p. 473-8.
  123. McNeil, J., et al., Investigating Predictors of Eating: Is Resting Metabolic Rate Really the Strongest Proxy of Energy Intake? Canadian Journal of Diabetes, 2015. 39: p. S59.
  124. Zhou, Y. and L. Rui, Leptin signaling and leptin resistance. Frontiers of medicine, 2013. 7(2): p. 207-222.
  125. Koleva, D.I., M.M. Orbetzova, and P.K. Atanassova, Adipose tissue hormones and appetite and body weight regulators in insulin resistance. Folia Med (Plovdiv), 2013. 55(1): p. 25-32.
  126. Lean, M.E. and D. Malkova, Altered gut and adipose tissue hormones in overweight and obese individuals: cause or consequence? Int J Obes (Lond), 2016. 40(4): p. 622-32.
  127. Schwartz, M.W., et al., Central nervous system control of food intake. Nature-London-, 2000: p. 661-671.
  128. Badman, M.K. and J.S. Flier, The gut and energy balance: visceral allies in the obesity wars. Science, 2005.307(5717): p. 1909.
  129. Johnstone, A.M., et al., Factors influencing variation in basal metabolic rate include fat-free mass, fat mass, age, and circulating thyroxine but not sex, circulating leptin, or triiodothyronine. American Journal of Clinical Nutrition, 2005. 82(5): p. 941-948.
  130. Keys, A., The biology of human starvation. 1950, Minneapolis London: University of Minnesota Press; Oxford U.P.
  131. Nindl, B.C., et al., Physical performance and metabolic recovery among lean, healthy men following a prolonged energy deficit. Int J Sports Med, 1997. 18(5): p. 317-24.
  132. Friedl, K.E., et al., Endocrine markers of semistarvation in healthy lean men in a multistressor environment. J Appl Physiol (1985), 2000. 88(5): p. 1820-30.
  133. Dulloo, A.G., J. Jacquet, and L. Girardier, Poststarvation hyperphagia and body fat overshooting in humans: a role for feedback signals from lean and fat tissues. The American journal of clinical nutrition, 1997. 65(3): p. 717-723.
  134. Dulloo, A.G., J. Jacquet, and J.P. Montani, How dieting makes some fatter: from a perspective of human body composition autoregulation. Proceedings of the Nutrition Society, 2012. 71(3): p. 379-389.
  135. Sumithran, P., et al., Long-term persistence of hormonal adaptations to weight loss. N Engl J Med, 2011. 365(17): p. 1597-604.
  136. Hintze, L.J., et al., Weight Loss and Appetite Control in Women. Curr Obes Rep, 2017. 6(3): p. 334-351.
  137. Andriessen, C., et al., Weight loss decreases self-reported appetite and alters food preferences in overweight and obese adults: Observational data from the DiOGenes study. Appetite, 2018. 125: p. 314-322.
  138. Nymo, S., et al., Timeline of changes in appetite during weight loss with a ketogenic diet. Int J Obes (Lond), 2017. 41(8): p. 1224-1231.
  139. Beaulieu, K., et al., Matched Weight Loss Through Intermittent or Continuous Energy Restriction Does Not Lead To Compensatory Increases in Appetite and Eating Behavior in a Randomized Controlled Trial in Women with Overweight and Obesity. The Journal of Nutrition, 2019.
  140. Forbes, G.B., Lean Body Mass-Body Fat Interrelationships in Humans. 1987. 45(10): p. 225-231.
  141. Hall, K.D., Body fat and fat-free mass inter-relationships: Forbes's theory revisited. Br J Nutr, 2007. 97(6): p. 1059-63.
  142. Vink, R.G., et al., The effect of rate of weight loss on long-term weight regain in adults with overweight and obesity. Obesity (Silver Spring), 2016. 24(2): p. 321-7.
  143. Dulloo, A.G., et al., Passive and active roles of fat-free mass in the control of energy intake and body composition regulation. European journal of clinical nutrition, 2017. 71(3): p. 353-357.
  144. Yeomans, M.R., J.E. Blundell, and M. Leshem, Palatability: response to nutritional need or need-free stimulation of appetite? British Journal of Nutrition, 2004. 92(1): p. 3-14.
  145. Cabanac, M., Palatability of food and the ponderostat. Annals of the New York Academy of Sciences, 1989.575(1): p. 340-352.
  146. Drewnowski, A., Energy density, palatability, and satiety: implications for weight control. Nutrition reviews, 1998. 56(12): p. 347-353.
  147. Levine, A.S., C.M. Kotz, and B.A. Gosnell, Sugars and fats: the neurobiology of preference. The Journal of Nutrition, 2003. 133(3): p. 831S-834S.
  148. Blundell, J.E. and G. Finlayson, Is susceptibility to weight gain characterized by homeostatic or hedonic risk factors for overconsumption? Physiology & behavior, 2004. 82(1): p. 21-25.
  149. Kirkham, T.C. and C.M. Williams, Synergistic efects of opioid and cannabinoid antagonists on food intake.Psychopharmacology, 2001. 153(2): p. 267-270.
  150. Di Marzo, V., et al., Leptin-regulated endocannabinoids are involved in maintaining food intake. Nature, 2001. 410(6830): p. 822-825.
  151. Verty, A., et al., Evidence for an interaction between CB1 cannabinoid and melanocortin MCR-4 receptors in regulating food intake. Endocrinology, 2004. 145(7): p. 3224-3231.
  152. Cota, D., et al., The endogenous cannabinoid system affects energy balance via central orexigenic drive and peripheral lipogenesis. The Journal of clinical investigation, 2003. 112(3): p. 423-431.
  153. Welch, C.C., et al., Palatability-induced hyperphagia increases hypothalamic Dynorphin peptide and mRNA levels. Brain research, 1996. 721(1): p. 126-131.
  154. Yamamoto, T., N. Sako, and S. Maeda, Effects of taste stimulation on β-endorphin levels in rat cerebrospinal fluid and plasma. Physiology & behavior, 2000. 69(3): p. 345-350.
  155. Hayward, M.D., J.E. Pintar, and M.J. Low, Selective reward deficit in mice lacking β-endorphin and enkephalin.The Journal of neuroscience, 2002. 22(18): p. 8251-8258.
  156. Berthoud, H.R., Homeostatic and non-homeostatic pathways involved in the control of food intake and energy balance. Obesity, 2006. 14(S8): p. 197S-200S.
  157. Berthoud, H.-R., The neurobiology of food intake in an obesogenic environment. Proceedings of the Nutrition Society, 2012. 71(04): p. 478-487.
  158. Pecina, S., K.S. Smith, and K.C. Berridge, Hedonic hot spots in the brain. The Neuroscientist, 2006. 12(6): p. 500-511.
  159. Berridge, K.C., The debate over dopamine’s role in reward: the case for incentive salience.Psychopharmacology, 2007. 191(3): p. 391-431.
  160. Kringelbach, M.L., I.E. de Araujo, and E.T. Rolls, Taste-related activity in the human dorsolateral prefrontal cortex. Neuroimage, 2004. 21(2): p. 781-788.
  161. Stice, E., et al., Relation of reward from food intake and anticipated food intake to obesity: a functional magnetic resonance imaging study. Journal of abnormal psychology, 2008. 117(4): p. 924.
  162. Ziauddeen, H., I.S. Farooqi, and P.C. Fletcher, Obesity and the brain: how convincing is the addiction model?Nature Reviews Neuroscience, 2012. 13(4): p. 279-286.
  163. Finlayson, G. and M. Dalton, Hedonics of food consumption: are food ‘liking’and ‘wanting’viable targets for appetite control in the obese? Current Obesity Reports, 2012. 1(1): p. 42-49.
  164. Dalton, M. and G. Finlayson, Hedonics, satiation and satiety, in Satiation, satiety and the control of food intake. 2013, Elsevier. p. 221-237.
  165. Berthoud, H.-R., H. Münzberg, and C.D. Morrison, Blaming the brain for obesity: integration of hedonic and homeostatic mechanisms. Gastroenterology, 2017. 152(7): p. 1728-1738.
  166. Blundell, J. and N. King, Physical activity and regulation of food intake: current evidence. Medicine & Science in Sports & Exercise, 1999. 31(11): p. S573.
  167. Stubbs, R., et al., Interactions between energy intake and expenditure in the development and treatment of obesity. Progress in Obesity Research: 9, 2003: p. 418.
  168. Hopkins, M., N.A. King, and J.E. Blundell, Acute and long-term effects of exercise on appetite control: is there any benefit for weight control? Current Opinion in Clinical Nutrition & Metabolic Care, 2010. 13(6): p. 635.
  169. Donnelly, J.E., et al., Does increased exercise or physical activity alter ad-libitum daily energy intake or macronutrient composition in healthy adults? A systematic review. PloS one, 2014. 9(1): p. e83498.
  170. Dorling, J., et al., Acute and chronic effects of exercise on appetite, energy intake, and appetite-related hormones: the modulating effect of adiposity, sex, and habitual physical activity. 2018. 10(9): p. 1140.
  171. King, N., A. Tremblay, and J. Blundell, Effects of exercise on appetite control: implications for energy balance.Medicine & Science in Sports & Exercise, 1997. 29(8): p. 1076-1089.
  172. Beaulieu, K., et al., Effect of exercise training interventions on energy intake and appetite control in adults with overweight or obesity: A systematic review and metaanalysis. 2021. 22: p. e13251.
  173. Bellicha, A., et al., Effect of exercise training on weight loss, body composition changes, and weight maintenance in adults with overweight or obesity: An overview of 12 systematic reviews and 149 studies. 2021. 22: p. e13256.
  174. Long, S., K. Hart, and L. Morgan, The ability of habitual exercise to influence appetite and food intake in response to high-and low-energy preloads in man. British Journal of Nutrition, 2002. 87(05): p. 517-523.
  175. Beaulieu, K., et al., High Habitual Physical Activity Improves Acute Energy Compensation in Nonobese Adults.Medicine and science in sports and exercise, 2017.
  176. Martins, C., H. Truby, and L. Morgan, Short-term appetite control in response to a 6-week exercise programme in sedentary volunteers. British Journal of Nutrition, 2007. 98(04): p. 834-842.
  177. King, N., et al., Dual-process action of exercise on appetite control: increase in orexigenic drive but improvement in meal-induced satiety. American Journal of Clinical Nutrition, 2009. 90(4): p. 921-927.
  178. Beaulieu, K., et al., Impact of physical activity level and dietary fat content on passive overconsumption of energy in non-obese adults. International Journal of Behavioral Nutrition and Physical Activity, 2017. 14(1): p. 14.
  179. Mayer, J., P. Roy, and K. Mitra, Relation between caloric intake, body weight, and physical work: studies in an industrial male population in West Bengal. American Journal of Clinical Nutrition, 1956. 4(2): p. 169.
  180. Blundell, J., Physical activity and appetite control: can we close the energy gap? Nutrition Bulletin, 2011. 36(3): p. 356-366.
  181. Beaulieu, K., et al., Does Habitual Physical Activity Increase the Sensitivity of the Appetite Control System? A Systematic Review. Sports Medicine, 2016: p. 1-23.
  182. Shook, R.P., et al., Low levels of physical activity are associated with dysregulation of energy intake and fat mass gain over 1 year. The American journal of clinical nutrition, 2015. 102(6): p. 1332-1338.
  183. Beaulieu, K., et al., Homeostatic and non-homeostatic appetite control along the spectrum of physical activity levels: An updated perspective. Physiology & behavior, 2018. 192: p. 23-29.
  184. Hägele, F.A., et al., Appetite control is improved by acute increases in energy turnover at different levels of energy balance. 2019. 104(10): p. 4481-4491.
  185. Melby, C.L., et al., Increasing energy flux to maintain diet-induced weight loss. 2019. 11(10): p. 2533.
  186. Andersson, B., et al., The effects of exercise, training on body composition and metabolism in men and women.International journal of obesity, 1991. 15(1): p. 75.
  187. Donnelly, J., et al., The effects of 18 months of intermittent vs. continuous exercise on aerobic capacity, body weight and composition, and metabolic fitness in previously sedentary, moderately obese females. International journal of obesity and related metabolic disorders: journal of the International Association for the Study of Obesity, 2000. 24(5): p. 566.
  188. Poehlman, E.T., et al., Effects of Resistance Training and Endurance Training on Insulin Sensitivity in Nonobese, Young Women: A Controlled Randomized Trial 1. The Journal of Clinical Endocrinology & Metabolism, 2000. 85(7): p. 2463-2468.
  189. Holt, S., et al., Relationship of satiety to postprandial glycaemic, insulin and cholecystokinin responses.Appetite, 1992. 18(2): p. 129-141.
  190. Speechly, D. and R. Buffenstein, Appetite dysfunction in obese males: evidence for role of hyperinsulinaemia in passive overconsumption with a high fat diet. European journal of clinical nutrition, 2000. 54(3): p. 225-233.
  191. Bailey, D.M., et al., Physical activity and normobaric hypoxia: independent modulators of peripheral cholecystokinin metabolism in man. Journal of Applied Physiology, 2001. 90: p. 105-113.
  192. Martins, C., et al., The effects of exercise-induced weight loss on appetite-related peptides and motivation to eat. Journal of Clinical Endocrinology & Metabolism, 2010. 95(4): p. 1609-1616.
  193. Gibbons, C., et al., Postprandial profiles of CCK after high fat and high carbohydrate meals and the relationship to satiety in humans. Peptides, 2016. 77: p. 3-8.
  194. Reid, R.E., D. Thivel, and M.-E. Mathieu, Understanding the potential contribution of a third “T” to FITT exercise prescription: the case of timing in exercise for obesity and cardiometabolic management in children. J Applied Physiology, Nutrition & Metabolism, 2019. 44(8): p. 911-914.
  195. Wolff, C.A. and K.A. Esser, Exercise timing and circadian rhythms. Current opinion in physiology, 2019. 10: p. 64-69.
  196. Alizadeh, Z., et al., Comparison between the effect of 6 weeks of morning or evening aerobic exercise on appetite and anthropometric indices: a randomized controlled trial. Clinical obesity, 2017. 7(3): p. 157-165.
  197. Blasio, A.d., et al., Effects of the time of day of walking on dietary behaviour, body composition and aerobic fitness in post-menopausal women. J Journal of sports medicine, 2010. 50(2): p. 196-201.
  198. Willis, E.A., et al., The effects of exercise session timing on weight loss and components of energy balance: midwest exercise trial 2. International journal of obesity, 2020. 44(1): p. 114-124.
  199. Schumacher, L.M., et al., Consistent morning exercise may be beneficial for individuals with obesity. Exercise sport sciences reviews, 2020. 48(4): p. 201.
  200. Teo, S.Y., et al., Effects of diurnal exercise timing on appetite, energy intake and body composition: A parallel randomized trial. Appetite, 2021. 167: p. 105600.
  201. Parr, E.B., et al., A time to eat and a time to exercise. 2020. 48(1): p. 4.

Diagnostic Testing for Diabetes Insipidus

ABSTRACT


Diabetes insipidus (DI) is a disorder characterized by excretion of large volumes of hypotonic urine. The underlying cause is either a deficiency of the hormone arginine vasopressin (AVP) in the pituitary gland/hypothalamus (central DI), or resistance to the actions of AVP in the kidneys (nephrogenic DI). In most circumstances, DI is also characterized by excessive consumption of water (polydipsia). A third condition called primary polydipsia can clinically show overlapping features with DI. Both DI and primary polydipsia are collectively referred to as ‘polyuria-polydipsia syndromes. Like other endocrine disorders, an accurate diagnosis of DI can be challenging. This is mainly because the results obtained from diagnostic testing can show significant overlap among the different forms of DI and primary polydipsia. When a case of DI is suspected, the initial step involves the confirmation of the presence of hypotonic polyuria, which is the hallmark of DI. Once hypotonic polyuria is established, the next step is to identify the type of polyuria-polydipsia disorder (central DI vs. nephrogenic DI vs. primary polydipsia). This can be determined either through the water deprivation test or through the hypertonic saline infusion test along with plasma AVP or plasma copeptin measurements. Lastly, a detailed history and physical examination must be performed and appropriate laboratory and imaging studies must be undertaken to identify the underlying etiology of DI. This chapter describes the diagnostic steps to be pursued to identify the presence of DI, distinguish the various forms of polyuria-polydipsia disorders, identify the underlying disorders responsible for the DI, the challenges faced with diagnostic testing for DI in clinical practice, and future prospects in the field of DI diagnosis.


INTRODUCTION


Diabetes insipidus (DI) is a disorder of water homeostasis that is characterized by excretion of large volumes of hypotonic urine either due to the deficiency of the hormone arginine vasopressin [AVP, also known as antidiuretic hormone (ADH)], or due to resistance to the action of AVP on its receptors in the kidneys (1, 2). Large volumes of urine excretion, also known as polyuria (typically over 4 L per day), is the hallmark of DI. The urine of DI has been classically described as insipid (tasteless), hypotonic and dilute (3). Polyuria is defined as excretion of a urinary volume >150 ml/Kg/24 hours at birth, >100-110 ml/Kg/24 hours up to the age of 2 years, and >50 ml/Kg/24 hours in older children and adults (1). DI is typically classified into 3 forms: 1. Central DI, 2. Nephrogenic DI and 3. Gestational DI. Primary polydipsia is a disorder that is characterized by excessive intake of water which results in hypotonic polyuria. Clinically, this condition can manifest with symptoms of DI and adds to the diagnostic challenge of identifying DI. Primary polydipsia and DI together are referred to as ‘polyuria-polydipsia syndromes’, characterized by hypotonic polyuria (4, 5).


Central DI is caused by a variety of disorders that arise from either the pituitary or the hypothalamus. These conditions are characterized by defective production, transport or secretion of AVP (3, 6). This results in inappropriately low AVP levels in the setting of increased plasma osmolality. Nephrogenic DI is a form of DI that results from resistance by the kidney towards the action of AVP, due to AVP receptor defects or as an adverse effect of certain medications (3, 6). A third, rare form of DI occurs during pregnancy. Also known as gestational DI, this type of DI results from the enzymatic breakdown of the endogenous AVP by a placental cysteine aminopeptidase (3, 7). Therefore, this enzymatic degradation of plasma AVP during pregnancy can unmask sub-clinical DI in those women with borderline-low plasma AVP levels (8). Although primary polydipsia is not a true DI state, long-standing primary polydipsia can give rise to a DI-like picture on laboratory evaluation (described later) (4). There are several etiologies that give rise to each of these forms of polyuria-polydipsia syndromes (6). They have been listed in Table 1.


Table 1. Etiologies of the Various Polyuria-Polydipsia Syndromes

Central Diabetes Insipidus (involvement of pituitary and/or hypothalamus)

·       Neoplastic:

o   Craniopharyngioma

o   Germinoma

o   Meningioma

o   Pituitary macroadenoma (invasive)

o   Metastasis to the pituitary and/or the hypothalamus

·       Vascular:

o   Hypothalamic infarction/hemorrhage

o   Cerebral infarction/hemorrhage

o   Anterior communicating artery ligation

o   Anterior communicating artery aneurysm

o   Sheehan’s syndrome

o   Sickle cell disease

·       Trauma:

o   Deceleration injury

o   Intracranial surgery

o   Transsphenoidal pituitary surgery

·       Autoimmune/inflammatory:

o   Lymphocytic hypophysitis

o   IgG4 disease

o   Xanthogranulomatous hypophysitis

o   Anti-vasopressin neuron antibodies

o   Guillain-Barré syndrome

·       Infectious:

o   Meningitis

o   Encephalitis

o   Tuberculosis

o   Pituitary or hypothalamic abscess

·       Granulomatous:

o   Sarcoidosis

o   Granulomatous hypophysitis

o   Langerhans’ cell histiocytosis

o   Erdheim-Chester disease

·       Drug/toxin-induced:

o   Phenytoin

o   Ethyl alcohol

o   Snake venom

·       Congenital/genetic:

o   Autosomal dominant AVP-neurophysin II gene alterations

o   Wolfram (DIDMOAD) syndrome

o   Septo-optic dysplasia

o   Schinzel-Giedion syndrome

o   Culler-Jones syndrome

o   Alstrom syndrome

o   Hartsfield syndrome

o   Webb-Dattani syndrome

o   X-linked recessive defects with subnormal AVP levels

Nephrogenic Diabetes Insipidus

·       Metabolic:

o   Hypokalemia

o   Hypercalcemia

·       Drug-induced:

o   Lithium

o   Demeclocycline

o   Methoxyflurane

o   Cisplatin

o   Pemetrexed

o   Aminoglycosides

o   Amphotericin B

·       Renal disease:

o   chronic kidney disease

o   Polycystic kidney disease

o   Obstructive uropathy

·       Systemic disease:

o   Amyloidosis

o   Sarcoidosis

o   Sjogren’s syndrome

o   Multiple myeloma

·       Vascular:

o   Renal infarction

o   Sickle cell disease

·       Congenital/genetic:

o   Autosomal recessive aquaporin-2 channel gene alterations

o   X-linked recessive V-2 receptor gene alterations

o   Polyhydramnios, megalencephaly, and symptomatic epilepsy (PMSE) syndrome

o   Type 4b Bartter syndrome

Pregnancy-Induced/Gestational Diabetes Insipidus

·       Increased vasopressin metabolism induced by placental cysteine aminopeptidase

Primary Polydipsia

·       Psychogenic polydipsia

·       Drug-induced:

o   Anticholinergics

o   Phenothiazines

·       Intracranial etiology:

o   Hypothalamic tumors

o   Tuberculous meningitis

o   Intracranial surgery/trauma

o   Sarcoidosis

·       Lowering of hypothalamic threshold for thirst (‘Dipsogenic DI’)


The typical clinical presentation of DI is in the form of polyuria and polydipsia. On several occasions, co-existing conditions or other aspects of the patient’s history can provide clues towards the possible etiology causing DI. Patients with hypophysitis can present with concomitant symptoms of anterior pituitary hormonal dysfunction including fatigue, erectile dysfunction, weight changes, loss of libido, galactorrhea, and amenorrhea (9). Headaches, visual field defects, or cranial nerve palsies can be observed along with DI in case of central nervous system (CNS) tumors, hypophysitis, or a pituitary adenoma (1, 9). In most circumstances, despite losing large volumes of water in the urine, individuals with DI do not manifest dehydration. This is due to the activation of the thirst center in the hypothalamus that induces a strong sense of thirst with rising plasma osmolality which results in the intake of large volumes of water (6). Therefore, although an intact thirst mechanism helps to compensate for the urinary water loss, the polyuria and polydipsia persist, and this can cause considerable distress for the patient unless the underlying DI is treated. A plasma osmolality of about 285mOsm/Kg usually acts as a trigger for thirst, with further increments in plasma osmolality resulting in a linear increase in thirst (6, 10). DI becomes more challenging to manage if this thirst response is diminished or if the patient is unable to access water for drinking. Patients with an attenuated thirst response have reduced urge to drink water despite rising plasma osmolality and loss of large volumes of water in the urine, resulting in ‘adipsic DI’ (11). Although being classically associated with craniopharyngioma, adipsic DI can also manifest with CNS trauma, CNS tumors, or after CNS neurosurgical or neurovascular procedures (12). Moreover, the thirst mechanism may be lost in hypothalamic lesions, whereby DI may present acutely with signs and symptoms of dehydration. Patients who are unable to voluntarily access water include infants and young children, and individuals with altered consciousness. In young children, lack of adequate water intake can lead to dehydration, sleeplessness, irritability, enuresis, failure to thrive and impaired growth (1). Similarly, among patients with altered/reduced consciousness, rapid output of large volumes of urine can result in dehydration and acute, sometimes severe, hypernatremia can ensue (2). The shrinkage of the brain induced by excessive water loss and severe hypernatremia could potentially lead to intracranial bleeding, obtundation, convulsions or coma (13).


Diagnosing the type of DI/polyuria-polydipsia syndrome is essential for making the optimal treatment decision. A potential misdiagnosis and the resultant treatment can lead to catastrophic consequences (7). For instance, if primary polydipsia is misdiagnosed as central DI and desmopressin treatment is initiated, severe hyponatremia can occur (14, 15). There have been several tests that have been developed over the past century to diagnose the presence of DI and to differentiate the various types of polyuria-polydipsia syndromes. This chapter specifically comprises the description of different diagnostic tests utilized in the diagnosis of these conditions.


DIAGNOSING DIABETES INSIPIDUS


The major challenge with diagnosing and classifying the type of DI arises from the fact that the various forms of polyuria-polydipsia syndromes can show overlapping features on diagnostic testing. The water deprivation test, also known as the indirect water deprivation test should potentially be able to distinguish the various forms of DI. Deprivation of water intake should allow patients with primary polydipsia to concentrate their urine while those with central or nephrogenic DI continue to excrete dilute urine. Administration of desmopressin (Deamino-8-D-arginine vasopressin), the synthetic analogue of AVP, after water deprivation should help with differentiating patients with central DI from those with nephrogenic DI as the former should be able to concentrate the urine once the deficient action of AVP is replaced with desmopressin, while the latter should not show a significant response due to end-organ resistance to the action of AVP or its analogues. While water deprivation followed by desmopressin administration should be theoretically sufficient to identify the type of DI, in reality, the interpretation of these tests is more complicated, especially if a patient has partial central DI, partial nephrogenic DI or chronic primary polydipsia (4). Patients with partial central or nephrogenic DI retain some amount of response to water deprivation and desmopressin administration (4, 16). In the case of chronic primary polydipsia, long-standing water diuresis blunts the renal medullary concentration gradient and causes down-regulation of the aquaporin-2 channels in the proximal tubule and the collecting duct due to suppressed endogenous AVP, thus creating a state mimicking nephrogenic DI (4, 17).


The basic algorithmic approach for diagnosing any suspected case of DI usually involves the following steps: 1. Confirmation of hypotonic polyuria 2. Diagnosis of the type of polyuria-polydipsia syndrome and 3. Identification of the underlying etiology (6). Performing diagnostic testing in this order can potentially aide with establishing the appropriate diagnosis and with choosing the most relevant biochemical and imaging tests.


Confirmation Of Hypotonic Polyuria


Polyuria is defined as excretion of a urinary volume >150 ml/Kg/24 hours at birth, >100-110 ml/Kg/24 hours up to the age of 2 years, and >50 ml/Kg/24 hours in older children or adults. A hypotonic urine is typically defined as a urine with an osmolality of <300 mOsm/Kg. The primary objective in this step involves differentiating between conditions that give rise to polyuria resulting from osmotic diuresis (such as in hyperglycemia) and DI/primary polydipsia, in which polyuria predominantly involves water diuresis.


Conformation Of Polyuria    


The first step is to confirm if a patient indeed has polyuria. Complaints of ‘polyuria’ can often be a misrepresentation of the actual symptoms of urinary urgency, nocturia, urinary incontinence, urinary tract infection, or prostatic hypertrophy (2). Once these symptoms have been ruled out, a 24-hour urine collection should be obtained. A 24-hour urine volume of <2.5 L could be reassuring and there is no concern for osmoregulatory disruption. Those patients without polyuria but with other above-mentioned urinary symptoms must be referred for urological evaluation.  Alternatively, individuals can keep a diary for 24 hours making a note of the amount of their urine output (3). A 24-hour urine creatinine will help ensure an appropriate sample collection. Patients need not hold any medications that can cause polyuria, such as diuretics or sodium-glucose co-transporter-2 (SGLT-2) inhibitors for this step as the goal of this step is to establish the presence of polyuria.


Excluding Other Causes of Polyuria


Once polyuria is confirmed, the next step would be to assess for urinary osmolality. The urine in cases of DI/primary polydipsia is hypotonic. A urine osmolality of >800 mOsm/Kg indicates optimal plasma AVP levels and appropriate renal response to AVP, therefore ruling out any form of DI (7, 18). In most cases, polyuria with isotonic/hypertonic urine is driven by glucose, sodium, urea, or medications such as diuretics or mannitol (19). Glycosuria can result either from uncontrolled diabetes mellitus (DM), general hyperglycemia (from steroid administration, tube-feeding/parenteral nutrition), or by the use of SGLT-2 inhibitors (20). Administration of normal saline in large volumes for intravascular volume expansion can lead to sodium-induced polyuria (19). Sodium-induced polyuria is also seen with release of bilateral bladder obstruction (21). Urea-induced solute diuresis can be seen with high amounts of protein intake, tissue catabolism, steroid administration, all of which result in production of urea from breakdown of proteins (19). Administration of urea for treatment of hyponatremia, and recovery from azotemia can also result in urea-solute diuresis (19). Mannitol-induced diuresis can result from treatment of increased intracranial pressure with mannitol (19).


Initial Serum/Plasma and Urine Investigations


In individuals with established hypotonic polyuria or in individuals with urine osmolality of ≥300 mOsm/Kg and <800 mOsm/Kg, further evaluation must be undertaken through laboratory investigations. Serum sodium and plasma osmolality measurements could assist with indicating the type of the underlying polyuric state. A high serum sodium (>146 mmol/L) could point towards central or nephrogenic DI while a low normal or low sodium (<135 mmol/L) could indicate primary polydipsia as the underlying disorder (5, 22, 23). Similarly, a high plasma osmolality (≥300 mOsm/Kg) is typically seen in DI while a normal or low plasma osmolality (≤280 mOsm/Kg) is usually seen in primary polydipsia (4, 24).


As an alternative to urine osmolality, urine specific gravity is also useful in identifying a hypotonic polyuric disorder. For normal plasma osmolality, the urine specific gravity is between 1.003 to 1.030 (25). The specific gravity value depends on the number and the size of particles in the urine, unlike urine osmolality which solely depends on the number of particles in the urine. Because of this, although urine specific gravity and urine osmolality generally correlate well, presence of large molecules might elevate urine specific gravity despite the chance of the urine osmolality actually being low (26). Unlike falsely elevated urine specific gravity, false low values of urine specific gravity are uncommon and a low urine specific gravity suggests DI or primary polydipsia. Both urine osmolality and specific gravity are easily measured on a urine specimen, but urine osmolality is more widely utilized in management of DI as osmolality is not affected by the size of the particles in the urine. Situations where urine specific gravity is suggested to be useful is when facilities for urine osmolality measurement are not available or if a rapid results are required, especially in managing neurosurgical patients, and on rare occasions where DI co-exists with DM with hyperglycemia (as in craniopharyngioma, Wolfram syndrome, described later) (27). With uncontrolled DM, the urine osmolality and specific gravity should be high. But with co-existent DI and DM, the urine osmolality and the urine specific gravity can be inappropriately low (28). Some studies have also noted low urine specific gravity but normal urine osmolality with concomitant DI and DM (27). In clinical practice, some physicians rely solely on urine osmolality while others prefer to assess both urine osmolality and urine specific gravity for managing DI.


Any underlying renal dysfunction must be ruled out by measuring urine sodium, blood urea nitrogen and serum creatinine (2). Electrolyte abnormalities including hypokalemia and hypercalcemia can give rise to polyuria due to down-regulation of aquaporin-2 channels giving rise to a clinical picture of nephrogenic DI (29). Therefore, any serum potassium or calcium abnormalities must be appropriately corrected.


DIAGNOSIS OF THE TYPE OF DIABETES INSIPIDUS


Probably the most challenging step in the work-up of a suspected case of DI is to assign an accurate diagnosis: central DI vs. nephrogenic DI vs. primary polydipsia. These polyuric-polydipsic states can demonstrate substantial overlap, both in their clinical presentation and in their response to diagnostic testing. It is also possible for one or more forms of polyuria-polydipsia syndrome to co-exist in a single individual. An algorithm for the diagnostic approach for DI is described in Figure 1.

Figure 1. Algorithm for Diagnosis of the Various Types of Polyuria Polydipsia Syndromes.

Under some circumstances, a diagnosis of DI or primary polydipsia is established based on clear evidence of hypotonic polyuria and based on serum sodium and plasma osmolality values, with high serum sodium/plasma osmolality being consistent with DI and a low serum sodium/plasma osmolality being consistent with primary polydipsia (see Figure 1). But in most situations, the diagnosis is still unclear. Such situations, where the initial diagnostic testing is indeterminate, include a urine osmolality value of 300 – 800 mOsm/Kg or a normal serum sodium/plasma osmolality. In these circumstances, there is a need to establish the diagnosis with more accuracy, and further testing must be considered. In this section, the various diagnostic tests specifically utilized to diagnose and identify the type of polyuria-polydipsia syndrome are discussed, along with their advantages and limitations.


Water Deprivation Test


The water deprivation test is also known by the terms ‘indirect water deprivation test’ and ‘dehydration test’. The term ‘indirect’ is utilized as this test generally does not involve ‘direct’ measurements of plasma AVP to diagnose and differentiate the various forms of DI. The water deprivation test is almost always followed with desmopressin administration to further characterize the type of polyuric polydipsic state. The basic principle behind the water deprivation test is that in individuals with normal posterior pituitary and renal function (or those with primary polydipsia), an increase in plasma osmolality from dehydration stimulates AVP release from the posterior pituitary which then leads to water reabsorption in the nephrons, thus resulting in concentration of urine and an increase in urine osmolality. In central or nephrogenic DI, the urine fails to optimally concentrate with water deprivation and there is persistent excretion of hypotonic urine. Once the diagnosis of DI is established, desmopressin administration can distinguish between central and nephrogenic DI. In central DI, once the deficient action of AVP is substituted with desmopressin administration, the urine osmolality should increase while in nephrogenic DI, as the desmopressin is ineffective due to lack of renal response to its actions, the low urine osmolality persists.


TESTING PROTOCOL


The test is performed either as an out-patient or preferably after admitting the patient to an in-patient ward in a controlled setting. For those individuals with milder polyuria (50 – 70 ml/Kg/24 hours), the test can be initiated in the evening and the dehydration can be performed overnight as an out-patient. However, for those who experience significant polyuria or nocturia, the test is better performed during the day so that the patient can be supervised (3). The individual undergoing the test must not have undergone thirsting prior to the test. Any electrolyte abnormalities (potassium, calcium) must be corrected prior to the test. The patient has to discontinue any medications that can affect urine output (diuretics, SGLT-2 inhibitors, desmopressin, carbamazepine, chlorpropamide, glucocorticoids, non-steroidal anti-inflammatory drugs) 24 hours prior to initiation of dehydration, and refrain from activities such as smoking and caffeine intake that might affect AVP release or urine output (6, 30). Baseline plasma osmolality, serum sodium, urine osmolality (and plasma AVP or plasma copeptin where available) are obtained. In case of an out-patient overnight water deprivation, these baseline measures are obtained on the morning preceding the overnight water deprivation test (31).


The dehydration phase is initiated overnight among those patients in whom this phase is performed as an out-patient. The timing of initiation of overnight water deprivation for out-patient testing is determined based on the 24-hour urine output of the patient (which would have been previously determined in order to establish the diagnosis of a polyuria-polydipsia syndrome), with a goal of achieving approximately 3% loss of body weight.


The duration of overnight water deprivation (in hours) can be determined by using the following formula: patient’s weight (Kg) x 0.03 x 1000 (ml) / urine output (ml/hour) (31). Clear, written instructions must be provided to the patient about terminating the dehydration phase in case of unseen adverse events such as nausea, diarrhea, dizziness, or syncope. Once the overnight dehydration phase is completed, the patient arrives at the hospital the following day around 07:00 – 08:00 am to obtain serum/plasma and urine studies. Patients are advised to bring along an accompanying person for their hospital visit following the overnight water deprivation. In case the overnight dehydration is prematurely terminated for any reason (dizziness, or intractable thirst leading to consumption of water), then in these patients, in-patient water deprivation must be undertaken.


The dehydration phase for in-patient testing usually begins at 08:00 am. The patient voids prior to beginning the test and the baseline weight, blood pressure, and heart rate is measured prior to initiation of dehydration. Following the initiation of the test, patient should have nothing by mouth. Weight, blood pressure and heart rate must be recorded hourly as a cautionary measure due to the risk of severe water loss and dehydration in the setting of lack of access to drinking water. Adequate supervision is advised to watch for any undisclosed drinking of water. Every voided urine is recorded and the osmolality of the urine is measured. Alternatively, for the convenience of measurement, urine output and urine osmolality can be measured once every 2 hours. Serum sodium and plasma osmolality are also obtained every 2 hours along with urine measurements. The dehydration phase should be discontinued if one of the following occur: loss of more than 3% of body weight, elevation of serum sodium to above normal limits (≥146 – 150 mmol/L as per most literature), orthostatic hypotension or orthostatic symptoms (dizziness), or intractable thirst (4).


The next phase of the test is the desmopressin phase, which involves administration of desmopressin following dehydration.  This phase can be initiated if either one of the following end-points are achieved: 1. Dehydration phase is completed for 8 hours (except in those who need longer periods of dehydration), 2. Two consecutive urine osmolality measures do not differ by >10% and loss of 2% body weight, 3. Premature termination of dehydration phase due to loss of more than 3% of body weight, elevation of serum sodium to above normal limits, or intractable thirst (3). An injection of 2 µg desmopressin is administered either through intravenous or intramuscular route and the above-mentioned urine and serum/plasma measures are obtained hourly for 1 – 2 hours after injection. Administration of desmopressin through oral or intranasal route does not result in predictable absorption, and especially where assigning an accurate diagnosis is crucial, optimal desmopressin concentrations in the blood has to be ensured. So, oral or intranasal desmopressin administration is not recommended to be used as a part of water deprivation test. During this phase, the patient can eat and drink, even up to 1.5 – 2 times the volume of urine passed during the dehydration phase. The total duration of the test can vary based on the clinical presentation. In those patients with complete forms of DI, the test can be performed in less than 8 hours while in those with partial DI or a non-DI condition, the test could last longer, sometimes even over 18 hours (3).


INTERPRETATION OF RESULTS


In normal individuals, with dehydration, the urine osmolality usually increases up to 800 – 1200 mOsm/Kg (3). If the dehydration phase is begun at 12:00 am, a morning (8:00 - 9:00 am) urine osmolality of 800 – 1200 mOsm/Kg excludes DI (3). A urine osmolality of <300 mOsm/Kg with a concomitant plasma osmolality of >300 mOsm/Kg or a sodium level above upper limit of normal following dehydration (>146 mmol/L) is suggestive of either central or nephrogenic DI (3, 4, 6). Desmopressin could be administered at this time (8.00 - 9:00 am). An increase of at least >50% in urine osmolality after desmopressin administration suggests complete central DI (the increase can be up to 200% to 400%) while a <50% increase points towards complete nephrogenic DI (3). An increase in urine osmolality over 300 mOsm/Kg prior to an increase in serum sodium/plasma osmolality suggests preservation of some endogenous AVP activity/renal response to AVP, suggesting either partial central or partial nephrogenic DI (5). Thus, in patients with partial DI (central or nephrogenic) the urine osmolality after water deprivation is usually between 300 – 800 mOsm/Kg and there can be <50% increase in urine osmolality following desmopressin administration.


In primary polydipsia, water deprivation results in an increase in urine osmolality, anywhere between 300 – 800 mOsm/Kg (usually up to 600 – 700 mOsm/Kg), without a substantial increase in plasma osmolality, but the increase in urine osmolality is not as substantial as in a normal response (3, 4, 6). Following desmopressin administration, an increase of <9% in urine osmolality is usually associated with primary polydipsia with a concomitant plasma osmolality of 300 – 800 mOsm/Kg as per some literature (4). However, this amount of increase in the urine osmolality when the urine osmolality is between 300 – 800 mOsm/Kg can also be seen in partial nephrogenic DI and adds to the diagnostic conundrum, and these criteria alone should not be utilized to diagnose primary polydipsia. A graphical representation of the response of each of the polyuria-polydipsia disorders to the water deprivation test is provided in Figure 2.


Figure 2. Graphical representation of the water deprivation test. Image courtesy: Sriram Gubbi, NIDDK, NIH.

LIMITATIONS


Although widely regarded as the gold standard in literature for diagnosing DI, the water deprivation test does have its limitations (3, 22). The most common scenario being partial central or partial nephrogenic DI. Patients with partial central DI retain some degree of AVP secretory capacity that can be stimulated with dehydration leading to concentration of urine. In partial nephrogenic DI, maximal AVP secretion from water deprivation can overcome renal resistance to AVP’s action and enable water reabsorption. In addition, long-standing central DI and chronic primary polydipsia can also give rise to false results on water deprivation test. With long standing central DI, due to chronic deficiency of AVP, the aquaporin-2 channels are down-regulated as AVP is required for the synthesis and membrane translocation of these channels (32). Therefore, administration of desmopressin after water deprivation in long-standing central DI might not result in an adequate increase in urine osmolality due to lack of adequate water reabsorption from insufficient aquaporin-2 channel availability, which could misleadingly suggest a picture of nephrogenic DI. On the other hand, chronic primary polydipsia can suppress the release of endogenous AVP due to increased intravascular volume and decreased plasma osmolality from high volumes of water intake. In this situation, water deprivation might not lead to an adequate rise in plasma osmolality high enough to stimulate the release of endogenous AVP. This can result in a sub-optimal increase in urine osmolality, thus simulating a clinical picture of central/nephrogenic DI. Moreover, high volumes of water intake from chronic primary polydipsia can create a ‘wash out’ of the renal medullary osmotic gradient and also a down-regulation of the aquaporin-2 channels, and administering desmopressin in this situation may not result in adequate increase in urine osmolality (4, 17). Also, the water deprivation test must be performed in children only under the supervision of a pediatrician and the test should not be performed in infants (33). Adjunctive measurements of plasma AVP or copeptin levels can improve the diagnostic yield of the water deprivation test and are described in detail in the upcoming sections below. The protocol for the water deprivation test, interpretation of the results, and limitations are represented in Table 2.


Table 2. Summary of the Indirect Water Deprivation Test

Protocol

Preparation phase:

·       Test can begin either overnight (for out-patient testing) or at 08:00 am (for in-patient testing).

·       No thirsting prior to the test. Smoking and caffeine intake are avoided.

·       Any electrolyte abnormalities (potassium, calcium) are corrected.

·       Drugs that can affect urine output (diuretics, sodium-glucose co-transporter-2 inhibitors, glucocorticoids, non-steroidal anti-inflammatory drugs) must be held 24 hours prior to dehydration.

·       Baseline weight, blood pressure and heart rate are measured prior to dehydration.

·       Baseline plasma osmolality, serum sodium, urine osmolality (and plasma AVP or plasma copeptin where available) are obtained (these measures can be obtained on the morning prior to overnight dehydration in cases of out-patient water deprivation test).

Dehydration phase:

·       This phase usually lasts for 8 hours (can last longer in certain cases).

·       For out-patient testing, the duration (hours) of overnight dehydration can be determined using the formula: patient’s weight (Kg) x 0.03 x 1000 (ml) / urine output (ml/hour).

·       Patient is allowed to have nothing by mouth.

·       Adequate supervision is necessary to watch for any undisclosed drinking (in case of in-patient testing).

·       Weight, blood pressure and heart rate are measured every 1 hour (in case of in-patient testing).

·       Urine output, urine osmolality, serum sodium and plasma osmolality are measured every 2 hours (for in-patient testing). Plasma copeptin is measured towards the end of the dehydration phase. (In case of out-patient overnight dehydration, serum/plasma and urine measures are obtained around 07:00 – 08:00 am the following morning)

·       Dehydration phase is discontinued if one of the following occurs:

o   Dehydration is completed for 8 hours (not applicable for those who might need longer periods of dehydration).

o   Two consecutive urine osmolality measures do not differ by >10% and loss of 2% body weight.

o   The total body weight reduces by more than 3%.

o   Serum sodium increases to above upper limit of normal (preferably >150 mmol/L).

o   Orthostatic hypotension or orthostatic symptoms.

o   Intractable thirst (or if patient admits to drinking water overnight in case of out-patient testing).

Desmopressin phase:

·       An injection of 2 µg desmopressin is administered either through intravenous or intramuscular route (use of oral or intranasal desmopressin is not preferred due to unpredictable absorption).

·       The patient is allowed to eat and drink, even up to 1.5 – 2 times the volume of urine passed during the dehydration phase.

·       Urine output, urine osmolality, serum sodium and plasma osmolality are measured hourly for 1 – 2 hours after desmopressin administration.

Interpretation

Central DI: 

o   Baseline urine osmolality of <300 mOsm/Kg and an increase in urine osmolality by >50% from baseline following desmopressin administration (complete central DI).

o   Baseline plasma copeptin of <2.6 pmol/L without prior dehydration (complete central DI).

o   The ratio of Δ copeptin from start till the completion of dehydration phase to serum sodium at the end of the dehydration phase of <0.02 pmol/L (indicates partial central DI).


Nephrogenic DI: 

o   Urine osmolality fails to rise above 300 mOsm/Kg or by <50% after desmopressin administration (complete nephrogenic DI).

o   Baseline plasma copeptin of ≥21.4 pmol/L without prior dehydration (complete and partial nephrogenic DI).

o   Baseline plasma AVP of ≥3 pg/ml without prior dehydration (complete and partial nephrogenic DI).

Primary Polydipsia:

o   Urine osmolality usually increases (300 – 800 mOsm/Kg, usually up to 600 – 700 mOsm/Kg) without significant changes in plasma osmolality following dehydration.

o   The ratio of Δ copeptin from start till the completion of dehydration phase to serum sodium at the end of the dehydration phase of ≥0.02 pmol/L

Advantages

·       Most extensively utilized and validated test.

·       No risks of hypertonic saline administration (thrombophlebitis, need for central line).

·       Plasma copeptin or AVP measurements are not necessary if the center does not have the facilities/assays to measure these peptides.

Disadvantages

·       More time consuming than hypertonic saline infusion test.

·       Can give overlapping results in cases of partial central DI, partial nephrogenic DI, or chronic primary polydipsia.

·       Majority of the interpretation relies on urinary measurements, which can be affected by any of the above conditions due to their modulation of aquaporin-2 channel synthesis and expression.

·       More burdensome for the patients and less convenient when compared with hypertonic saline infusion test.


Measurement Of Plasma AVP


AVP is encoded by the arginine vasopressin gene (AVP, 20p13), which also encodes prepro-AVP (a single peptide), neurophysin II (NPII), and a glycoprotein, copeptin. The pro-hormone of AVP is synthesized in the magnocellular neurons of the hypothalamus (Figure 3). Due to the above mentioned limitations of the indirect water deprivation test, measurement of plasma AVP levels was suggested for its potential to be used as a ‘direct’ test in conjunction with water deprivation test to distinguish the various polyuria-polydipsia syndromes (34). In nephrogenic DI, as there is no deficiency of AVP, the plasma AVP levels is high, in order to overcome the resistance posed by the kidneys to the action of AVP. On the other hand, plasma AVP should be low or relatively low in central DI for the elevated plasma osmolality (4). In primary polydipsia, plasma AVP levels may be normal or can be suppressed in long-standing cases. Subnormal AVP levels in cases of central DI could be due to osmoreceptor dysfunction in the hypothalamus or due to defective AVP release from the neurohypophysis (35). Despite the initial promising results of its potential utility, plasma AVP is seldom utilized for diagnosing DI in clinical practice.

Figure 3. Anatomy of the pituitary gland and the hypothalamus. The pituitary gland comprises of two developmentally and functionally distinct parts: the anterior pituitary (adenohypophysis), derived from the Rathke’s cleft and the posterior pituitary (neurohypophysis). The gland is attached to the hypothalamus through the posterior pituitary via a stalk. The posterior pituitary along with the hypothalamus and the stalk forms the functional unit of infundibuloneurohypophysis. This diagram emphasizes on the neuronal network that supplies the posterior pituitary. The vasopressinergic neurons (magnocellular neurons) are present in the supraoptic and paraventricular nuclei of the hypothalamus. These neurons synthesize arginine vasopressin (AVP), its precursors and co-peptides, and their axons project into the posterior pituitary where the AVP is stored along with oxytocin (produced by the oxytotic neurons present in the same nuclei) in the axonal terminals. These hormones are transported to the posterior pituitary through the supraoptic-hypophyseal tract. Another set of neurons of the paraventricular nucleus (also called parvocellular neurons) project into other areas of the brain and spinal cord, some of which secrete AVP. Image courtesy: Sriram Gubbi, NIDDK, NIH.

There are several limitations to measuring plasma AVP levels. AVP is rapidly cleared from the plasma, with a half-life of around 16 minutes (36). In addition, the pre-analytical instability of AVP in the plasma is high. A large amount of circulating AVP is bound to platelets through V1 receptors and failure to adequately segregate platelets from the plasma after blood sampling or prolonged storage of unprocessed blood samples can lead to wide fluctuations or even an increase in the measured plasma AVP levels (22, 37). For the AVP to be detectable by the currently available assays, an additional step of extraction/concentration of plasma is necessary, and this requires at least 1 ml of blood sample (22). Additionally, the current laboratory method employed in AVP measurement is radioimmunoassay (RIA), which has several limitations and analytical errors. Plasma concentration of AVP (measured in pg/ml) is one of the lowest among all hormones, and as AVP is a small peptide, sandwich assays cannot be effectively utilized to measure plasma AVP levels (5). The AVP levels in the plasma can be stabilized up to 2 - 4 hours after blood sampling by storing the sample at 4ºC (22, 38, 39). However, the average turn-around time for the measurement of AVP is 3-7 days in most laboratories which would make maintenance of hormonal stability even more challenging (4, 40). For these reasons, plasma AVP measurements are not routinely utilized. A related peptide to AVP, copeptin, is now emerging as a new, more stable marker to diagnose the various hypotonic polyuric states.


Measurement Of Plasma Copeptin


Copeptin (Carboxy-Terminal-Pro-vasopressin) is the C-terminal peptide of pro-vasopressin that is co-secreted with AVP in stoichiometric amounts from the posterior pituitary (4, 40). Both of these peptides are derived from a precursor molecule synthesized in the magnocellular neurons of the hypothalamus (Figure 3) (22). The post-transcription processing of AVP, copeptin, and related peptides are diagrammatically represented in Figure 4. Unlike plasma AVP measurement, which is technically challenging, copeptin measurement in the plasma is relatively less cumbersome and has several advantages: copeptin can remain stable for days after sampling of blood and can be measured relatively quickly (40). Plasma levels of copeptin strongly correlate with plasma AVP levels over a wide range of osmolalities, both in healthy individuals and those with DI or primary polydipsia (22, 41). Moreover, plasma copeptin demonstrates the same response to changes in plasma osmolality and plasma volume as does plasma AVP (5,22). Over the past 12 years, several studies have been conducted to validate the utility of plasma copeptin in the diagnosis of hypotonic polyuric states and to distinguish one form from the other (4, 5, 7, 22, 30).

Figure 4. Post-transcription processing of vasopressin and related peptides. The pre-pro-vasopressin is a peptide consisting of 164 amino acids. This pre-pro-hormone is then converted to pro-vasopressin after the removal of the signal peptide and N-linked glycosylation of copeptin. Further processing of pro-vasopressin gives rise to the individual peptides: arginine vasopressin (AVP), neurophysin II (NP II), and copeptin. Image courtesy: Sriram Gubbi, NIDDK, NIH.

The next question logically is whether plasma copeptin is a better test when compared to plasma AVP with regards to diagnosing the various forms of polyuria-polydipsia syndromes. Without prior thirsting (without water deprivation/hypertonic saline infusion), baseline plasma copeptin of ≥21.4 pmol/L or a plasma AVP level of ≥3 pg/ml have been shown to distinguish nephrogenic DI (partial and complete) from other types of polyuria-polydipsia syndromes with 100% sensitivity and specificity (5, 42). Similarly, a single baseline plasma copeptin measurement of ≥2.9 pmol/L without prior water deprivation has demonstrated the ability to differentiate primary polydipsia from central DI with a sensitivity of 82% and specificity of 78%, while plasma AVP of ≥1.8 pg/ml can distinguish primary polydipsia from central DI with 54% sensitivity and 89% specificity (5).


Prior data has also shown that a plasma copeptin of <2.6 pmol/L can accurately distinguish between complete central DI from primary polydipsia with 95% sensitivity and 100% specificity (4, 22). Some studies have utilized a combined water deprivation/hypertonic saline infusion test to stimulate endogenous release of AVP and copeptin, and based on the results, plasma copeptin levels of ≥4.9 pmol/L can differentiate primary polydipsia from central DI (partial or complete) with 94% sensitivity and 96% specificity, while a plasma AVP of ≥1.8 pg/ml can do the same with 83% sensitivity and 96% specificity (5). In addition, the ratio of Δ copeptin from start till the completion of water deprivation (08:00 am to 04:00 pm) to the serum sodium at the end of water deprivation test has been shown to discern partial central DI (<0.02 pmol/L) from primary polydipsia (≥0.02 pmol/L) with a sensitivity of 83% and a 100% specificity, although newer data has demonstrated that the ratio of Δ copeptin to serum sodium following water deprivation to be surprisingly of lower diagnostic accuracy than water deprivation alone (4, 30). Recent data suggests plasma copeptin measurement coupled with hypertonic saline infusion test provides more accurate results with regards to differential diagnosis of DI when compared with plasma copeptin measurement with water deprivation test (30)(see below, Hypertonic saline infusion test’). There is also emerging evidence for plasma copeptin as a valuable marker to predict post-operative risk for DI after pituitary surgeries, with plasma copeptin of <2.5 pmol/L predicting the risk of DI with a positive predictive value of 81% and plasma levels of >30 pmol/L on postoperative day 1 demonstrating a negative predictive value of 95% to rule out DI (43).


Based on these data, plasma copeptin measurement appears to be overall a better test when compared with plasma AVP measurement. However, it is the technical aspects of better pre-analytical stability, less cumbersome sample handling, and quicker reporting of results that make plasma copeptin a more attractive test. As of now, copeptin assays are not yet available worldwide and its utilization is limited to a few centers. Once the test becomes more widely available in the future, plasma copeptin level measurements are likely to be frequently pursued to diagnose and distinguish the various forms of polyuria-polydipsia syndromes.


Hypertonic Saline Infusion Test


The indirect water deprivation test is the most well tested and widely utilized as the standard diagnostic test for DI. Adjunctive measurements of plasma AVP or copeptin levels can enrich the diagnostic yield of the water deprivation test. But it is quite evident that the test has several limitations and, in many situations, just does not provide an accurate diagnosis. Although relatively newer than the water deprivation test, some of the earliest reports on the potential utility of hypertonic saline infusion in the differential diagnosis of DI dates to the 1940s (44). Hypertonic saline (3% saline, 513 mOsm/L) infusion coupled with plasma copeptin measurement is an alternative test that is now being recommended by many experts in the field of DI as the preferred test to be used in place of water deprivation test.


TESTING PROTOCOL


The test overall lasts for about 3 hours and can be initiated at 08:00 am. Medications that have diuretic or anti-diuretic effects (diuretics, SGLT-2 inhibitors, desmopressin, carbamazepine, chlorpropamide, glucocorticoids, non-steroidal anti-inflammatory drugs) need to be discontinued 24 hours prior to testing (30). The patient lies in a supine position. Two intravenous cannulas are inserted, one for infusion and the other for blood sampling. Before commencing the intravenous infusion, venous sampling is performed to obtain plasma copeptin, serum sodium, glucose, urea, and plasma osmolality (30). Hypertonic saline infusion is then commenced, initially with a bolus dose of 250 ml given over 10 – 15 minutes, followed by a slower infusion rate of 0.15 ml/Kg/min. Serum sodium and osmolality are measured every 30 minutes. The infusion is terminated once the serum sodium is ≥150 mOsm/L (30). Typically, protocols allow up to a maximum of 3 hours of infusion (30,45). At this point, a plasma copeptin is measured and the patient is asked to drink water at 30ml/Kg within 30 minutes (30, 45). This is followed by intravenous infusion of 5% glucose (dextrose) at 500 ml/hour for one hour (30, 45). Serum sodium is measured once more after completing the 5% glucose infusion to ensure its return to normal values. Vital parameters, including blood pressure and heart rate must be constantly assessed, preferably on a monitor.


TEST INTERPRETATION


A plasma copeptin level of <4.9 pmol/L after hypertonic saline infusion indicates central DI (partial and complete) while a level of ≥4.9 pmol/L indicates primary polydipsia (5, 30). It is likely that this cut-off value might be changed to 6.5 pmol/L in the future due to its higher diagnostic accuracy, based on more recent data (described below) (30). Baseline copeptin value of >21.4 pmol/L is indicative of nephrogenic DI (partial and complete) and <2.6 pmol/L indicates complete central DI (4, 5, 30).


The major advantage with the hypertonic saline infusion test is that it basically excludes the renal component out of the equation and any potential down-regulation of aquaporin-2 channels will not affect the diagnosis. This test depends only on two aspects: 1. Increasing the plasma osmolality, which is a strong stimulus for endogenous AVP synthesis and release and 2. Measurement of endogenous AVP secretory capacity by measuring plasma copeptin, which is secreted in equimolar proportions from the posterior pituitary along with AVP (3, 4). Thus, unlike water deprivation test which is mainly a test based on urine output and osmolality, the hypertonic saline infusion test is free from any requirements to measure urinary indices. In fact, when compared with water deprivation test with desmopressin administration with/without plasma copeptin measurement, the hypertonic saline infusion test with plasma copeptin measurements has been demonstrated to be the superior test for diagnosing the various forms of polyuria-polydipsia syndromes (30). Hypertonic saline infusion test also takes less time to perform, causes less patient burden, and is more convenient and tolerable when compared with indirect water deprivation test (30).


A modified hypertonic saline infusion test followed by water deprivation has also been previously described when the diagnosis after water deprivation is inconclusive (46). In this scenario, administration of hypertonic saline (as described in the protocol) followed by measurements of plasma AVP, serum sodium, plasma and urine osmolality can potentially differentiate the types of DI when the plasma AVP levels are plotted on a nomogram relating plasma AVP values to either urine osmolality or serum sodium/plasma osmolality (normal plasma AVP for urine osmolality or serum sodium/plasma osmolality suggests primary polydipsia, low plasma AVP for serum sodium/plasma osmolality suggests central DI, and low urine osmolality for plasma AVP levels suggests nephrogenic DI). However, this test is more cumbersome than either indirect water deprivation test or hypertonic saline infusion test alone and requires measurements of plasma AVP levels which is also challenging (as described above. Measurement of plasma AVP’). Therefore, this combined method is not utilized in routine clinical practice. With the advent of plasma copeptin assays and with the ability to eliminate urine measurements out of the equation for the regular hypertonic saline infusion test, the plasma AVP measurement-based combined water deprivation and hypertonic saline infusion test is likely going to be obsolete in the future.


Recent data by Fenske et al. have demonstrated the diagnostic accuracy of hypertonic saline infusion test combined with plasma copeptin measurement to be higher (96.5%) than that of water deprivation test (76.6%) in correctly identifying the type of polyuria-polydipsia syndrome (30). Even when it came to differentiating those with partial central DI from patients with primary polydipsia, the hypertonic saline infusion test with plasma copeptin measurement had a higher accuracy (95.2%) as compared to water deprivation test without plasma copeptin measurement (73.3%) (30). Data from the same study has also shown that a plasma copeptin value of 6.5 pmol/L provides the best diagnostic accuracy (97.9%) for differentiating central DI (partial and complete) from primary polydipsia (vs. 96.5% for the plasma copeptin cut-off level of 4.9 pmol/L), with a value of >6.5 pmol/L being consistent with primary polydipsia. Surprisingly, in the same study, water deprivation test followed by plasma copeptin measurement demonstrated a lower diagnostic accuracy when compared to water deprivation test alone without plasma copeptin measurement (44% vs. 76.6%). These results show that combining hypertonic saline infusion and plasma copeptin measurements currently offers the best diagnostic capability with distinguishing the various forms of hypotonic polyuric states. The protocol for the hypertonic saline infusion test, interpretation of the results, and limitations are presented in Table 3.


Table 3. Hypertonic Saline Infusion Test (with plasma copeptin measurement)

Protocol

Preparation phase:

·       Test can begin at 08:00AM.

·       Drugs that can affect urine output (diuretics, sodium-glucose co-transporter-2 inhibitors, glucocorticoids, non-steroidal anti-inflammatory drugs) must be held 24 hours prior to dehydration.

·       Patient lies in a supine position. Two intravenous cannulas are placed: one for blood sampling and the other for infusion.

·       Baseline serum sodium, glucose, urea, plasma osmolality and plasma copeptin are obtained prior to infusion.

Hypertonic saline infusion phase:

·       Hypertonic saline infusion is commenced: Bolus dose of 250ml given over 10 – 15 minutes, followed by 0.15 ml/Kg/min.

·       Serum sodium and osmolality are measured every 30 minutes.

·       The infusion is stopped if:

o   The serum sodium raises to >150 mmol/L.

o   The infusion is completed for 3 hours.

·       Plasma copeptin is measured after the infusion is stopped.

·       Heart rate and blood pressure are continuously monitored throughout the phase.

Hypotonic fluid administration phase:

·       Patient is asked to drink water at 30ml/Kg within 30 minutes.

·       This is followed by intravenous infusion of 5% glucose at 500ml/hour for 1 hour.

·       Serum sodium is measured after the completion of 5% glucose infusion to ensure its return to normal values.

·       Heart rate and blood pressure are continuously monitored throughout the phase.

Interpretation

Central DI: 

o   Baseline plasma copeptin <2.6 pmol/L prior to hypertonic saline infusion (complete central DI).

o   Plasma copeptin level of ≤4.9 pmol/L after hypertonic saline infusion (partial or complete). *

Nephrogenic DI: 

o   Baseline plasma copeptin ≥21.4 pmol/L prior to hypertonic saline infusion (partial or complete).

Primary polydipsia:

o   Plasma copeptin level of >4.9 pmol/L after hypertonic saline infusion. *

Advantages

·       Takes less time to perform than water deprivation test.

·       Eliminates the need to obtain urine studies which can be affected by aquaporin-2 channel availability, thus reducing the chances of confounding results.

·       Hypertonic saline is a stronger osmotic stimulus when compared to dehydration and is therefore more potent with causing AVP release in cases of partial central DI or chronic primary polydipsia. So, this is likely to be a better test to utilize in cases of partial central DI and chronic primary polydipsia.

·       Distinguishes central DI (complete and partial) from primary polydipsia with a higher accuracy when compared with water deprivation (with/without plasma copeptin) test.

·       Less burdensome and more convenient for the patients.

Disadvantages

·       Several centers mandate the use of central lines for hypertonic saline administration.

·       Hypertonic saline infusion has the theoretical risk of causing superficial thrombophlebitis.

·       Higher risk for hypernatremia when compared to water deprivation test.

·       Plasma copeptin assays are currently of limited availability.

*A higher cut-off value of 6.5 pmol/L distinguishes central DI from primary polydipsia with increased accuracy based on newer data, with a value of >6.5 pmol/L being consistent with primary polydipsia (Fenske et al., 2018).


LIMITATIONS


The challenges with utilizing hypertonic saline infusion test are as follows: 1. Hypertonic saline has been claimed to cause thrombophlebitis when administered through peripheral intravenous line. However, this risk is overestimated and is rarely observed in practice (47), 2. Several institutions require placement of a central venous catheter and admission to an intensive care unit for administration of hypertonic saline. Central line insertion is a more invasive and time-consuming procedure when compared to a peripheral intravenous line and can cause more bleeding or infections, and an admission to an intensive care unit exerts substantial expenditure on the patient and the institute, and 3. Copeptin assays are not yet commercially available in several countries.


IDENTIFICATION OF THE UNDERLYING CAUSE OF THE DI


Once the type of polyuria-polydipsia syndrome is identified, efforts must be undertaken to diagnose the underlying pathology responsible for this clinical presentation. A detailed list of the potential causes for each type of DI and primary polydipsia is provided in Table 1.  In cases of central DI, a thorough clinical history should be obtained, and a detailed physical exam needs to be performed to evaluate for the signs and symptoms of hormonal deficiencies (or excess in cases of hyperprolactinemia) from other pituitary axes (9, 48). Biochemical evaluation must include a morning plasma measurement of pituitary hormones (growth hormone, prolactin, ACTH, TSH, FSH, and LH), and the hormones from their target organs (insulin-like growth factor 1, cortisol, free thyroxine, total and free testosterone, estradiol). An MRI of the sella and suprasellar regions with gadolinium needs to be obtained to evaluate for any anatomical disruptions of the pituitary or hypothalamic anatomy (macroadenomas, empty sella, infiltrative diseases). The normal posterior pituitary demonstrates hyperintensity on T1 images (also known as the ‘bright spot’), suggested to be due to phospholipid-rich granules storing AVP and oxytocin (Figure 5) (49). The absence of this bright spot could indicate an absence of posterior pituitary function. However, this should not be used as a sole criterion to attribute a pituitary etiology as causing the DI, because absence of the bright spot on the pituitary MRI is also seen in up to 25% of normal individuals and may disappear with aging (50). Also, an enlarged/thickened pituitary infundibular stalk can be found on the MRI, which may be seen in cases of hypophysitis, granulomatous disorders, tuberculosis, craniopharyngioma, germinoma or a metastasis to the sella or suprasellar region (3, 9, 51). The hypothalamus is the site of AVP synthesis (Figure 3) and any pathological involvement of the region (inflammatory, infectious, vascular, or neoplastic process) can certainly result in the destruction of the hypothalamus leading to deficiency of AVP synthesis (3). This is specifically important among patients with adipsic DI as the thirst center might be disrupted due to the above-mentioned etiologies that can involve the hypothalamus. Any history of cranial trauma or intra-cranial surgery could also give rise to central DI.

Figure 5. Magnetic resonance imaging (MRI) of the pituitary gland. The above image is a non-contrast T1 MRI image of a normal pituitary gland. The white arrow point towards the ‘bright spot’ seen in the posterior pituitary. This finding is a result of phospholipid-rich granules that store arginine vasopressin (AVP) and oxytocin. Image courtesy: NIDDK, NIH.

In cases of DI with onset during infancy or early childhood, genetic/congenital causes must be suspected. Some of the genetic conditions causing DI include AVP-neurophysin II gene alterations (AVP-NP II, autosomal dominant), Wolfram syndrome, an autosomal recessive disorder caused by alterations in WFS1(4p16.1) associated with diabetes insipidus, diabetes mellitus, optic atrophy, and deafness (OMIM 22300, DIDMOAD syndrome), and other autosomal recessive disorders due to production of mutant, weaker forms of AVP, and X-linked recessive disorders resulting in sub-normal plasma AVP levels (52-55). Congenital malformations, such as septo-optic dysplasia (HESX1, OMIM 601802, 3p14), Schinzel-Giedion midface retraction syndrome (SETBP1, OMIM 611060, 18q12), Culler-Jones syndrome (GLI2,OMIM 165230, 2q14), Alstrom syndrome (ALMS1, OMIM 606844, 2p13), Hartsfield syndrome (FGFR, OMIM615465, 8p11), Webb-Dattani syndrome (ARNT2, OMIM 606036, 15q25), amongst others, can also give rise to childhood-onset DI (56-60).


Nephrogenic DI in most cases is acquired, usually in the setting of intake of certain drugs like lithium, demeclocycline, pemetrexed, cisplatin, and others (6, 7, 61). Therefore, a review of the patient’s medication intake history can lead to the identification of the potential culprit medication, which can then be discontinued. Use of osmotic diuretics or electrolyte abnormalities such as hypercalcemia or hypokalemia must be investigated in cases of nephrogenic DI (6, 29). Any underlying acute or chronic renal disease (vascular, inflammatory, or neoplastic processes, polycystic kidney disease), obstructive uropathy, and systemic diseases such as amyloidosis or sickle cell disease can also give rise to nephrogenic DI and prompt evaluation for these disorders is necessary (6, 7). Congenital causes for nephrogenic DI include mutations in the gene for aquaporin-2 receptor (autosomal recessive) and the gene for V-2 receptor (X-linked recessive inheritance), and must be suspected in childhood-onset nephrogenic DI (7). Other genetic causes of nephrogenic DI include; polyhydramnios, megalencephaly, and symptomatic epilepsy (STRADA, OMIM 608626, 17q23) and some Barter syndrome subtypes, including Bartter syndrome, type 4b, digenic forms (CLCNKA, OMIM 602024, 1p36.13) (62, 63).


Primary polydipsia or dipsogenic DI is often seen in individuals on treatment for mood disorders or schizophrenia (64). The dry mouth caused by intake of medications with strong anticholinergic properties to treat these disorders is most likely the cause for excessive water intake (64). Hypothalamic disease (sarcoidosis, tuberculosis, trauma, neoplasms) can alter the thirst response by lowering the thirst threshold, either by disruption of the thirst center or through osmoceptor dysfunction, which leads to polydipsia (3, 7). Primary polydipsia which results from this subset of cases with low thirst threshold in hypothalamus, is also referred to as ‘dipsogenic DI’. In other cases, individuals are just habitual compulsive drinkers of large volumes of water without any underlying organic or pharmacologic cause (6).


A unique presentation of DI which is worthy of note, is the one that occurs during pregnancy. Also known as gestational diabetes insipidus, this disorder occurs during pregnancy due to the enzymatic breakdown of the endogenous AVP by a placental cysteine aminopeptidase (6, 7). In women with borderline-low plasma AVP levels, pregnancy can unmask sub-clinical DI from enzymatic degradation of AVP (8). However, work-up for other etiologies of DI must be considered when appropriate in this situation.


If none of the modalities succeed in establishing an appropriate diagnosis of DI, a therapeutic trial with desmopressin can be undertaken (3, 46). The therapeutic trial can be provided in the form of desmopressin tablets of 100 µg by mouth every 8 hours for 48 hours. If this treatment abolishes polyuria, normalizes serum sodium/plasma osmolality or at least brings down serum sodium to near normal levels, resulting in elimination of thirst, the diagnosis is most certainly central DI. If there is cessation of polyuria and there is slight normalization of serum sodium/plasma osmolality without reduction in polydipsia/thirst, the most likely diagnosis is primary polydipsia. In nephrogenic DI, therapeutic trial with desmopressin does not result in any significant changes in serum sodium or plasma and urine osmolality (46). This method can distinguish between various forms of DI with 90% accuracy (46). However, caution is advised when utilizing desmopressin for diagnostic testing due to the risk of hyponatremia, which can sometimes be severe in patients with primary polydipsia and the test is preferably done in a monitored in-patient setting (46).


FUTURE DIRECTIONS


A major forthcoming change that could be anticipated is the renaming of the term, “diabetes insipidus/DI”. An expert panel comprising physicians from various endocrine societies around the globe, ‘The Working Group for Renaming Diabetes Insipidus’, has recommended to rename ‘central diabetes insipidus’ as ‘arginine vasopressin deficiency (AVP-D)’, and ‘nephrogenic diabetes insipidus’ as ‘arginine vasopressin resistance (AVP-R)’ (65). While gestational DI has not been specifically brought up in this proposal, it may be apt to rename the condition as ‘gestational AVP-D.’ Similarly, ‘adipsic DI’ could be renamed as ‘adipsic AVP-D.’ There are two main reasons for this proposal. One reason is that the current name (DI) is not reflective of the underlying pathophysiologic mechanism as this term was coined in the 18th century when AVP was not yet discovered (66). The second reason is that both healthcare workers (especially those in non-endocrine-related fields) as well as patients tend to confuse the term ‘diabetes insipidus’ with the more common ‘diabetes mellitus’. This confusion has led to mismanagement of DI resulting in catastrophic consequences (67, 68). In fact, a large survey with 1034 patients with central DI showed that 80% participants encountered a scenario where a healthcare professional confused DI with DM, and 85% of participants supported renaming DI. The proposed plan for the upcoming years is to start transitioning to the new terms while retaining the old terms in parenthesis till the medical community and patients get used to the new terminologies.


With regards to diagnostic testing, further refinements are implemented to the copeptin-based testing, such as utilization of non-osmotic neurohypophyseal secretagogues, to minimize adverse effects or discomfort related to iatrogenic hypernatremia induced by hypertonic saline. Arginine is a non-osmotic stimulus to the posterior pituitary, and it increases plasma copeptin levels in healthy individuals (69). Arginine-stimulated copeptin measurement is being evaluated as a potential diagnostic test for central DI and primary polydipsia. In a recent prospective study, intravenous arginine-stimulation was able to distinguish patients with central DI, and primary polydipsia, and healthy controls using the 60-minute post-stimulation plasma copeptin levels, with high diagnostic accuracy (69). Glucagon, another neurohypophyseal stimulant, was also recently evaluated in a double-blind, placebo-controlled, randomized trial for differential diagnosis of DI (70). Glucagon injection led to significant increase in plasma copeptin levels in healthy controls compared to placebo, while there was a minimal increase in plasma copeptin in central DI patients, there was a substantial increase in patients with primary polydipsia. Further studies performing head-to-head prospective comparisons with hypertonic saline infusion test are required to identify the best copeptin-based diagnostic test.


CONCLUSIONS


Making an accurate diagnosis of DI and ascertaining its type and the underlying etiology poses a significant challenge to this day. In clinical practice, under some circumstances, a diagnosis of DI is established based on serum/plasma and urine studies alone and based on the history and clinical presentation, investigations to identify the underlying etiology are pursued. However, an accurate diagnosis of the type of DI or any polyuria-polydipsia syndrome in general, is difficult to establish as there can be a significant overlap in the results among the various forms of polyuria-polydipsia syndromes on diagnostic testing. Specific testing protocols, such as the indirect water deprivation test or the hypertonic saline infusion test can assist with providing a diagnosis with increased accuracy. Measurement of plasma AVP levels is not routinely performed due to several pre-analytical considerations and lack of widespread availability of assays. With the promising potential of the utility of plasma copeptin levels, diagnosing DI might get less cumbersome in the future once this assay is standardized across laboratories worldwide and once the test becomes commercially available on the global market. The combination of hypertonic saline infusion coupled with plasma copeptin level measurement has achieved diagnostic accuracies that have not been previously attained by any other testing modalities with regards to differential diagnosis of polyuria-polydipsia syndromes (30). But the newer non-osmotic, neurohypophyseal secretagogue (arginine and glucagon)-based plasma copeptin measurements hold the promise of being the safer, less cumbersome testing modalities. However, randomized trials comparing these modalities with hypertonic saline infusion are necessary, with cost and regional availability of these agents also taken into consideration. Therefore, hypertonic saline infusion and plasma copeptin-based approach could potentially become the standard of practice in the future to accurately establish the diagnosis of DI and related polyuria-polydipsia syndromes.


REFERENCES


  1. Di Iorgi N, Napoli F, Allegri AE, Olivieri I, Bertelli E, Gallizia A, et al. Diabetes insipidus--diagnosis and management. Horm Res Paediatr. 2012;77(2):69-84.
  2. Garrahy A, Moran C, Thompson CJ. Diagnosis and management of central diabetes insipidus in adults. Clin Endocrinol (Oxf). 2019;90(1):23-30.
  3. Robinson AG VJ. Posterior pituitary. .Williams Textbook of Endocrinology, ed 13;2015:300-3322015.
  4. Fenske W, Quinkler M, Lorenz D, Zopf K, Haagen U, Papassotiriou J, et al. Copeptin in the differential diagnosis of the polydipsia-polyuria syndrome--revisiting the direct and indirect water deprivation tests. J Clin Endocrinol Metab. 2011;96(5):1506-15.
  5. Timper K, Fenske W, Kühn F, Frech N, Arici B, Rutishauser J, et al. Diagnostic Accuracy of Copeptin in the Differential Diagnosis of the Polyuria-polydipsia Syndrome: A Prospective Multicenter Study. J Clin Endocrinol Metab. 2015;100(6):2268-74.
  6. Ball S. The Neurohypophysis: Endocrinology of Vasopressin and Oxytocin. In: Feingold KR, Anawalt B, Boyce A, Chrousos G, de Herder WW, Dhatariya K, et al., editors. Endotext. South Dartmouth (MA): MDText.com, Inc. Copyright © 2000-2022, MDText.com, Inc.; 2000.
  7. Fenske W, Allolio B. Clinical review: Current state and future perspectives in the diagnosis of diabetes insipidus: a clinical review. J Clin Endocrinol Metab. 2012;97(10):3426-37.
  8. Iwasaki Y, Oiso Y, Kondo K, Takagi S, Takatsuki K, Hasegawa H, et al. Aggravation of subclinical diabetes insipidus during pregnancy. N Engl J Med. 1991;324(8):522-6.
  9. Gubbi S, Hannah-Shmouni F, Stratakis CA, Koch CA. Primary hypophysitis and other autoimmune disorders of the sellar and suprasellar regions. Rev Endocr Metab Disord. 2018;19(4):335-47.
  10. Hughes F, Mythen M, Montgomery H. The sensitivity of the human thirst response to changes in plasma osmolality: a systematic review. Perioper Med (Lond). 2018;7:1.
  11. Ball SG, Vaidja B, Baylis PH. Hypothalamic adipsic syndrome: diagnosis and management. Clin Endocrinol (Oxf). 1997;47(4):405-9.
  12. Smith D, McKenna K, Moore K, Tormey W, Finucane J, Phillips J, et al. Baroregulation of vasopressin release in adipsic diabetes insipidus. J Clin Endocrinol Metab. 2002;87(10):4564-8.
  13. Adrogué HJ, Madias NE. Hypernatremia. N Engl J Med. 2000;342(20):1493-9.
  14. Ferrer J, Halperin I, Conget JI, Cabrer J, Esmatjes E, Vilardell E. Acute water intoxication after intranasal desmopressin in a patient with primary polydispsia. J Endocrinol Invest. 1990;13(8):663-6.
  15. Odeh M, Oliven A. Coma and seizures due to severe hyponatremia and water intoxication in an adult with intranasal desmopressin therapy for nocturnal enuresis. J Clin Pharmacol. 2001;41(5):582-4.
  16. Miller M, Dalakos T, Moses AM, Fellerman H, Streeten DH. Recognition of partial defects in antidiuretic hormone secretion. Ann Intern Med. 1970;73(5):721-9.
  17. Li C, Wang W, Kwon TH, Isikay L, Wen JG, Marples D, et al. Downregulation of AQP1, -2, and -3 after ureteral obstruction is associated with a long-term urine-concentrating defect. Am J Physiol Renal Physiol. 2001;281(1):F163-71.
  18. Nigro N, Grossmann M, Chiang C, Inder WJ. Polyuria-polydipsia syndrome: a diagnostic challenge. Intern Med J. 2018;48(3):244-53.
  19. Bichet D. Diagnosis of polyuria and diabetes insipidus. UpToDate, Waltham MA (Accessed on March 25, 2015). 2009 [
  20. Weir MR, Januszewicz A, Gilbert RE, Vijapurkar U, Kline I, Fung A, et al. Effect of canagliflozin on blood pressure and adverse events related to osmotic diuresis and reduced intravascular volume in patients with type 2 diabetes mellitus. J Clin Hypertens (Greenwich). 2014;16(12):875-82.
  21. Howards SS. Post-obstructive diuresis: a misunderstood phenomenon. J Urol. 1973;110(5):537-40.
  22. Christ-Crain M, Fenske W. Copeptin in the diagnosis of vasopressin-dependent disorders of fluid homeostasis. Nat Rev Endocrinol. 2016;12(3):168-76.
  23. Verbalis JG, Goldsmith SR, Greenberg A, Korzelius C, Schrier RW, Sterns RH, et al. Diagnosis, evaluation, and treatment of hyponatremia: expert panel recommendations. Am J Med. 2013;126(10 Suppl 1):S1-42.
  24. Verbalis JG, Goldsmith SR, Greenberg A, Schrier RW, Sterns RH. Hyponatremia treatment guidelines 2007: expert panel recommendations. Am J Med. 2007;120(11 Suppl 1):S1-21.
  25. Simerville JA, Maxted WC, Pahira JJ. Urinalysis: a comprehensive review. Am Fam Physician. 2005;71(6):1153-62.
  26. Voinescu GC, Shoemaker M, Moore H, Khanna R, Nolph KD. The relationship between urine osmolality and specific gravity. Am J Med Sci. 2002;323(1):39-42.
  27. Burmazovic S, Henzen C, Brander L, Cioccari L. One too many diabetes: the combination of hyperglycaemic hyperosmolar state and central diabetes insipidus. Endocrinol Diabetes Metab Case Rep. 2018;2018.
  28. Akarsu E, Buyukhatipoglu H, Aktaran S, Geyik R. The value of urine specific gravity in detecting diabetes insipidus in a patient with uncontrolled diabetes mellitus: urine specific gravity in differential diagnosis. J Gen Intern Med. 2006;21(11):C1-2.
  29. Frøkiaer J, Marples D, Knepper MA, Nielsen S. Pathophysiology of aquaporin-2 in water balance disorders. Am J Med Sci. 1998;316(5):291-9.
  30. Fenske W, Refardt J, Chifu I, Schnyder I, Winzeler B, Drummond J, et al. A Copeptin-Based Approach in the Diagnosis of Diabetes Insipidus. N Engl J Med. 2018;379(5):428-39.
  31. Pedrosa W, Drummond JB, Soares BS, Ribeiro-Oliveira A, Jr. A COMBINED OUTPATIENT AND INPATIENT OVERNIGHT WATER DEPRIVATION TEST IS EFFECTIVE AND SAFE IN DIAGNOSING PATIENTS WITH POLYURIA-POLYDIPSIA SYNDROME. Endocr Pract. 2018;24(11):963-72.
  32. Ishikawa SE, Schrier RW. Pathophysiological roles of arginine vasopressin and aquaporin-2 in impaired water excretion. Clin Endocrinol (Oxf). 2003;58(1):1-17.
  33. Majzoub JA, Srivatsa A. Diabetes insipidus: clinical and basic aspects. Pediatr Endocrinol Rev. 2006;4 Suppl 1:60-5.
  34. Zerbe RL, Robertson GL. A comparison of plasma vasopressin measurements with a standard indirect test in the differential diagnosis of polyuria. N Engl J Med. 1981;305(26):1539-46.
  35. Baylis PH, Gaskill MB, Robertson GL. Vasopressin secretion in primary polydipsia and cranial diabetes insipidus. Q J Med. 1981;50(199):345-58.
  36. Czaczkes JW, Kleeman CR, Koenig M. PHYSIOLOGIC STUDIES OF ANTIDIURETIC HORMONE BY ITS DIRECT MEASUREMENT IN HUMAN PLASMA. J Clin Invest. 1964;43(8):1625-40.
  37. Jane Ellis M, Livesey JH, Evans MJ. Hormone stability in human whole blood. Clin Biochem. 2003;36(2):109-12.
  38. Baumann G, Dingman JF. Distribution, blood transport, and degradation of antidiuretic hormone in man. J Clin Invest. 1976;57(5):1109-16.
  39. Heida JE, Boesten LSM, Ettema EM, Muller Kobold AC, Franssen CFM, Gansevoort RT, et al. Comparison of ex vivo stability of copeptin and vasopressin. Clin Chem Lab Med. 2017;55(7):984-92.
  40. Morgenthaler NG, Struck J, Alonso C, Bergmann A. Assay for the measurement of copeptin, a stable peptide derived from the precursor of vasopressin. Clin Chem. 2006;52(1):112-9.
  41. Balanescu S, Kopp P, Gaskill MB, Morgenthaler NG, Schindler C, Rutishauser J. Correlation of plasma copeptin and vasopressin concentrations in hypo-, iso-, and hyperosmolar States. J Clin Endocrinol Metab. 2011;96(4):1046-52.
  42. Christ-Crain M, Morgenthaler NG, Fenske W. Copeptin as a biomarker and a diagnostic tool in the evaluation of patients with polyuria-polydipsia and hyponatremia. Best Pract Res Clin Endocrinol Metab. 2016;30(2):235-47.
  43. Winzeler B, Zweifel C, Nigro N, Arici B, Bally M, Schuetz P, et al. Postoperative Copeptin Concentration Predicts Diabetes Insipidus After Pituitary Surgery. J Clin Endocrinol Metab. 2015;100(6):2275-82.
  44. Carter AC, Robbins J. The use of hypertonic saline infusions in the differential diagnosis of diabetes insipidus and psychogenic polydipsia. J Clin Endocrinol Metab. 1947;7(6):464.
  45. Fenske WK, Schnyder I, Koch G, Walti C, Pfister M, Kopp P, et al. Release and Decay Kinetics of Copeptin vs AVP in Response to Osmotic Alterations in Healthy Volunteers. J Clin Endocrinol Metab. 2018;103(2):505-13.
  46. Robertson GL. Diabetes insipidus: Differential diagnosis and management. Best Pract Res Clin Endocrinol Metab. 2016;30(2):205-18.
  47. Perez CA, Figueroa SA. Complication Rates of 3% Hypertonic Saline Infusion Through Peripheral Intravenous Access. J Neurosci Nurs. 2017;49(3):191-5.
  48. Fleseriu M, Hashim IA, Karavitaki N, Melmed S, Murad MH, Salvatori R, et al. Hormonal Replacement in Hypopituitarism in Adults: An Endocrine Society Clinical Practice Guideline. J Clin Endocrinol Metab. 2016;101(11):3888-921.
  49. Kucharczyk W, Lenkinski RE, Kucharczyk J, Henkelman RM. The effect of phospholipid vesicles on the NMR relaxation of water: an explanation for the MR appearance of the neurohypophysis? AJNR Am J Neuroradiol. 1990;11(4):693-700.
  50. Brooks BS, el Gammal T, Allison JD, Hoffman WH. Frequency and variation of the posterior pituitary bright signal on MR images. AJNR Am J Neuroradiol. 1989;10(5):943-8.
  51. Prete A, Salvatori R. Hypophysitis. : Copyright © 2000-2022, MDText.com, Inc.; 2000.; Endotext [Internet]. South Dartmouth (MA): MDText.com, Inc .; 2000-2018.
  52. Barrett TG, Bundey SE. Wolfram (DIDMOAD) syndrome. J Med Genet. 1997;34(10):838-41.
  53. Habiby RL, Robertson GL, Kaplowitz PB, Rittig S. A novel X-linked form of familial neurohypophyseal diabetes insipidus.• 386. Pediatric Research. 1997;41(4):67-.
  54. Willcutts MD, Felner E, White PC. Autosomal recessive familial neurohypophyseal diabetes insipidus with continued secretion of mutant weakly active vasopressin. Hum Mol Genet. 1999;8(7):1303-7.
  55. Abu Libdeh A, Levy-Khademi F, Abdulhadi-Atwan M, Bosin E, Korner M, White PC, et al. Autosomal recessive familial neurohypophyseal diabetes insipidus: onset in early infancy. Eur J Endocrinol. 2010;162(2):221-6.
  56. Antich J, Manzanares R, Camarasa F, Krauel X, Vila J, Cusi V. Schinzel-Giedion syndrome: report of two sibs. Am J Med Genet. 1995;59(1):96-9.
  57. Izenberg N, Rosenblum M, Parks JS. The endocrine spectrum of septo-optic dysplasia. Clin Pediatr (Phila). 1984;23(11):632-6.
  58. Vilain C, Mortier G, Van Vliet G, Dubourg C, Heinrichs C, de Silva D, et al. Hartsfield holoprosencephaly-ectrodactyly syndrome in five male patients: further delineation and review. Am J Med Genet A. 2009;149a(7):1476-81.
  59. Al-Sannaa NA, Pepler A, Al-Abdulwahed HY, Al-Majed SI, Abdi RF, Menzel M, et al. Webb–Dattani Syndrome: report of a Saudi Arabian family with a novel homozygous mutation in the ARNT2 Gene. Journal of Pediatric Neurology. 2019;17(02):071-6.
  60. Fraser FC, Gunn T. Diabetes mellitus, diabetes insipidus, and optic atrophy. An autosomal recessive syndrome? J Med Genet. 1977;14(3):190-3.
  61. Vootukuru V, Liew YP, Nally JV, Jr. Pemetrexed-induced acute renal failure, nephrogenic diabetes insipidus, and renal tubular acidosis in a patient with non-small cell lung cancer. Med Oncol. 2006;23(3):419-22.
  62. Krämer BK, Bergler T, Stoelcker B, Waldegger S. Mechanisms of Disease: the kidney-specific chloride channels ClCKA and ClCKB, the Barttin subunit, and their clinical relevance. Nat Clin Pract Nephrol. 2008;4(1):38-46.
  63. Puffenberger EG, Strauss KA, Ramsey KE, Craig DW, Stephan DA, Robinson DL, et al. Polyhydramnios, megalencephaly and symptomatic epilepsy caused by a homozygous 7-kilobase deletion in LYK5. Brain. 2007;130(Pt 7):1929-41.
  64. Dundas B, Harris M, Narasimhan M. Psychogenic polydipsia review: etiology, differential, and treatment. Curr Psychiatry Rep. 2007;9(3):236-41.
  65. Arima H, Cheetham T, Christ-Crain M, Cooper DL, Drummond JB, Gurnell M, et al. Changing the name of diabetes insipidus: a position statement of the working group to consider renaming diabetes insipidus. Arch Endocrinol Metab. 2022.
  66. Lindholm J. Diabetes insipidus: historical aspects. Pituitary. 2004;7(1):33-8.
  67. Prentice M. Time for change: Renaming Diabetes Insipidus to improve patient safety. Clin Endocrinol (Oxf). 2018;88(5):625-6.
  68. Atila C, Loughrey PB, Garrahy A, Winzeler B, Refardt J, Gildroy P, et al. Central diabetes insipidus from a patient's perspective: management, psychological co-morbidities, and renaming of the condition: results from an international web-based survey. Lancet Diabetes Endocrinol. 2022;10(10):700-9.
  69. Winzeler B, Cesana-Nigro N, Refardt J, Vogt DR, Imber C, Morin B, et al. Arginine-stimulated copeptin measurements in the differential diagnosis of diabetes insipidus: a prospective diagnostic study. Lancet. 2019;394(10198):587-95.
  70. Atila C, Gaisl O, Vogt DR, Werlen L, Szinnai G, Christ-Crain M. Glucagon-stimulated copeptin measurements in the differential diagnosis of diabetes insipidus: a double-blind, randomized, placebo-controlled study. Eur J Endocrinol. 2022;187(1):65-74.


Hypopituitarism

ABSTRACT


Hypopituitarism is described as partial or complete loss of isolated or combined deficits of pituitary hormones. The clinical presentation of this condition varies depending on the age of onset, underlying cause of the disease, severity of deficiency and number of affected hormones. Investigation to confirm the diagnosis is based on basal hormone status and dynamic stimulatory tests. In this review, we will provide a concise background knowledge regarding underlying etiologies, clinical manifestations, hormonal investigations, and related treatments which necessitate close lifelong monitoring.


INTRODUCTION


Hypopituitarism refers to complete or partial failure of secretion of anterior and/or posterior pituitary hormones. It may arise as a result of congenital defects in the development of individual anterior pituitary cell types or hypothalamic function, acquired disease of the pituitary or hypothalamus, or from infundibular lesions which interfere with the hypothalamic control of the pituitary. The multiple aspects of normal pituitary function serve to predict the wide range of clinical manifestations of hypopituitarism which are determined by the severity, extent and duration of the condition. Onset may occur during childhood or adult life and is generally permanent, requiring one or more specific hormone replacements.

ETIOLOGY OF HYPOPITUITARISM


The major causes of hypopituitarism are shown in Table 1.


Table 1. Causes of Hypopituitarism

Congenital

Isolated pituitary hormone deficiency

·       Receptor mutation: GHRH, CRH, GnRH, TRH receptor mutations

·       Transcription factor defect: PITX2, TBX19, DAX1, NR5A1, NR0B1

·       Hormone mutation: GH1, bio-inactive GH, FSHb, LHb, TSHb, POMC, POMC processing defect

·       Prader-Willi syndrome

·       Bardet-Biedl syndrome

·       Kallmann syndrome

Multiple pituitary hormone deficiency

·       Transcription factor defect: HESX1, SOX 2/3, LHX3/4, PROP1, POU1F1, IGSF1 mutations

·       Prohormone convertase enzyme mutation: PC1

Neoplastic

Pituitary adenoma

·       Functioning and Non-functioning

Peri-pituitary tumors

·       Parasellar lesion: craniopharyngioma, Rathke's cleft cyst

·       Non-adenomatous neoplasm: meningioma, glioma, germ cell tumor

·       Metastases, especially breast, renal, bronchus

Vascular

Infarction/ hemorrhage

·       Sheehan's syndrome

·       Pituitary apoplexy

·       Aneurysms

Inflammatory /

Infiltrative / Immunological


·       Hypophysitis: lymphocytic, granulomatous, xanthomatous, necrotizing, IgG4-related, immunotherapy-induced (CTLA-4 inhibitors), other immune-associated

·       Hemochromatosis

·       Sarcoidosis

·       Wegener's granulomatosis

·       Giant cell granuloma

·       Langerhans cell histiocytosis

Infectious


·       Bacterial: tuberculosis, syphilis, leptospirosis

·       Fungal: candidiasis, aspergillosis

·       Viral: Herpes/Varicella infection, SARS-CoV-2 virus

Post-irradiation


·       Pituitary

·       Nasopharyngeal

·       Cranial

Miscellaneous


·       Empty sella

·       Traumatic brain injury

·       Medications


Congenital  


Formation of the normal pituitary during embryonic development depends on the juxtaposition of cells of neuroectodermal origin, which form the posterior pituitary, and endodermal cells derived from the primitive stomodeum, which form the anterior pituitary. Congenital forms of hypopituitarism are best considered as being derived either from hypothalamic or pituitary origin. Defects of RPX/HESX1, PROP1, and PIT1 are associated with varying degrees of inherited hypopituitarism in humans (1).  Autosomal dominant mutations of the arginine vasopressin-neurophysin II gene give rise to familial antidiuretic hormone (ADH) deficiency (central diabetes insipidus, CDI). Congenital combined pituitary hormone deficiency (CPHD) (or multiple pituitary hormone deficiency (MPHD)) may be associated with hypoplasia of the anterior pituitary and ectopic siting of the posterior pituitary in a superior position. The underlying mechanism for this condition, once thought to be a consequence of birth trauma, remains undetermined but a congenital molecular defect is likely. Furthermore, since some genetic mutations affect early development, they may include extra-pituitary features or midline anomalies as a part of a syndrome. For instance, the transcription factors, including HESX1, SOX2, SOX3, and OTX2, are the most common genes involved in the etiology of septo-optic dysplasia. Hypogonadotropic hypogonadism is a recognized feature of both Prader-Willi and Bardet-Biedl syndromes. The salient features of the currently described transcription factor defects are indicated below.


HESX1 MUTATIONS


HESX1 is a member of the homeobox gene family. It is one of the earliest markers of the pituitary primodium expressed as a prelude to the development of Rathke's pouch. Mutations of the HESX1 gene in humans are associated with septo-optic dysplasia and evolving hypopituitarism. Septo-optic dysplasia is characterized by the classical triad of optic nerve hypoplasia, midline neuroradiological abnormalities such as agenesis of the corpus callosum, and pituitary hypoplasia with consequent panhypopituitarism (2).  Expression of the HESX1 gene precedes expression of PROP1 and PIT1, and its consequences are more extensive.


PROP1 DEFECT  


The PROP1 gene encodes a transcription factor with a single paired-like DNA-binding domain. Individuals with a single inactivating mutation in PROP1 have deficiencies of luteinizing hormone (LH), follicle stimulating hormone (FSH), GH, prolactin, and TSH (3). Their pituitary glands may be small, normally sized, or large with extrasellar extension. Pituitary degeneration may produce acquired deficiency of adrenocorticotropic hormone (ACTH). Growth restriction and GH responses to GHRH stimulation are more variable in children with PROP1 mutation. This variability does not seem to be dependent on the type of PROP1 mutation because variability exists within sibships. Recessive mutation in PROP1 is the most frequent genetic cause of CPHD and appears to be much more common than POU1F1 mutation (4,5). Clinical suspicion of these mutations should be high in any individual with early onset CPHD, even in those with an intrasellar or suprasellar mass lesion. However, the clinical manifestations of each hormone may vary in onset and severity. GHD is usually present in the first years of life; whereas TSH and gonadotropin deficiency might manifest at birth or later in life. Most patients do not experience adrenal insufficiency during the first years of life although this can evolve later.


PIT1 DEFECT  


PIT1, also known as POU1F1, is a pituitary specific transcription factor found in somatotrophs, lactotrophs, and thyrotrophs in the anterior pituitary gland from early fetal development and throughout life. Autosomal recessive defects of PIT1 are associated with combined deficiencies of growth hormone (GH), prolactin, and thyrotropin stimulating hormone (TSH) (6,7). Patients with PIT1 mutations (coded by POU1F1 gene) tend to firstly manifest with GHD and prolactin deficiency in the first year of life and generally do not release detectable amounts of GH after GHRH stimulation. TSH deficiency typically develops later in life (8).


SOX2 MUTATIONS


SOX2 belongs to the SRY-related HMG box (SOX) family of transcription factors which are expressed in various stages of embryonic development and cell differentiation, and play critical roles from the earliest stages of development, in particular expression of anterior neuroectoderm. De novo truncating mutations of SOX2 are found in individuals with bilateral anophthalmia/microphthalmia, small corpus callosum, hippocampal abnormalities, variable mental retardation, anterior pituitary hypoplasia and often hypopituitarism (9-11)


SOX3 MUTATIONS


SOX3 also belongs to the SRY-related HMG box (SOX) family of transcription factors. This dosage sensitive gene is essential for normal hypothalamic-pituitary development (12). Patients manifest with variable hypopituitarism, infundibular hypoplasia, abnormal corpus callosum, hypoplasia of anterior pituitary, absent stalk, ectopic/undescended posterior pituitary, and intellectual disability (13).


OTX2 MUTATION


OTX2 belongs to the orthodenticle homeobox (OTX) and plays an essential role in brain, eyes, and pituitary development. Patients with OTX2 mutations manifest with variable degrees of pituitary dysfunction, intellectual disability, ocular abnormalities including microphthalmia, anophthalmia, and abnormal peripapillary pigmentation (14).


DAX1 MUTATIONS


Mutations in DAX1 (coded by NR0B1), which is another X chromosome gene, cause hypogonadotropic hypogonadism in association with congenital adrenal hypoplasia in males. DAX1 encodes an orphan nuclear hormone receptor with a novel DNA-binding domain, that has a critical role in the development of the hypothalamus, pituitary, adrenal, and gonads (15).  DAX1 appears to influence the maintenance of testicular epithelial integrity and spermatogenesis.


KAL1 MUTATION


Isolated gonadotropin deficiency with hyposmia (Kallmann syndrome) may be inherited as an autosomal X-linked disorder or occur sporadically. The X-linked disorder occurs in approximately 1/10,000 to 60,000 live births (16) and a mutation in the KAL1 gene is the basis for this disease. Gonadotropin-releasing hormone (GnRH) neurons develop in the medial olfactory placode and migrate to the hypothalamus during embryonic development; the KAL protein is essential for the initiation and maintenance of this process. Patients with the disorder usually present in late adolescence with delayed pubertal initiation or progression and characteristically exhibit hyposmia. They may develop eunuchoid proportions and usually demonstrate small testes and a short penis; other features which are specific to X-linked Kallmann syndrome include unilateral renal agenesis and synkinesis (mirror movements), whereas midline facial defects, choanal atresia, short metacarpals, malrotation of the gut, and ocular coloboma are more common in autosomal and sporadic forms of the condition.


GH1 MUTATIONS  


Mutations in the major GH gene, GH1, can occur as deletions of different size, resulting in severe isolated GH deficiency and may be familial with either a dominant or recessive pattern of inheritance.


TBX19 MUTATION


TBX19, also known as TPIT, is essential for both pro-opiomelanocortin (POMC) transcription and terminal differentiation of POMC-expressing cells. A mutation of TBX19 results in congenital isolated ACTH deficiency and this mutation is discovered in 65% of patients with neonatal-onset congenital isolated ACTH deficiency (17).


Other single gene mutations affecting individual anterior pituitary hormones or pituitary receptors for hypothalamic peptides are indicated in Table 1.


Tumors


Pituitary adenomas are the most common cause of adult-onset hypopituitarism (18,19). Craniopharyngiomas are numerically the next most prevalent and may present as sellar and/or suprasellar masses.


PITUITARY ADENOMA  


Pituitary tumors can be either non-functioning or secrete one or more anterior pituitary hormones. They are classified according to size and the presence of extrasellar extension; magnetic resonance imaging (MRI) permits accurate measurement of maximum diameter and tumors are conventionally classified as microadenomas (less than 10mm), and macroadenomas (more than 20mm in diameter) (20). The reported prevalence of pituitary tumors is approximately 10 per million with an average annual incidence of approximately 30 per million depending on tumor type, age, and gender with the highest incidence occurring in pre-menopausal women. Pituitary adenomas may cause typical clinical syndromes resulting from hypersecretion of one or more anterior pituitary hormones. Approximately 25-30% will not present with these symptoms, so they will only be detected when tumor expansion and local compression of the surrounding structures emerges. Post-mortem studies reveal a prevalence of incidental intrasellar adenomas of 10-20%.


Clinically non-functioning pituitary adenomas (NFPA) are non- or low grade-secreting tumors which frequently synthesize and secrete free alpha or beta glycoprotein subunits but do not cause clinically recognized symptomatology. Hence, the treatment of choice is surgical debulking, and sometimes followed by external radiation therapy. In contrast to patients with secreting pituitary tumor who present with clinical syndromes of acromegaly, hyperprolactinemia, Cushing's disease, and secondary hyperthyroidism non-functioning tumors present as an incidental finding, hypopituitarism, or due to mass effects of the tumor. The mainstream treatment in these diseases must be surgical therapy, except prolactinoma which is typically responsive to dopamine agonists.


CRANIOPHARYNGIOMAS  


Craniopharyngiomas are benign neoplastic lesions which are presumed to originate from the embryological remnants of Rathke's pouch. They may be located in the suprasellar region, within the sella, or both. Due to the infiltration of surrounding structures, they may have extensive adverse consequences. This tumor accounts for 1% of all intracranial tumors in adults and 6-13% of intracranial tumors in children (21). Peak incidence is in the first decade with a subsequent increase in incidence between 50-60 years of age. Adamantinomatous craniopharyngiomas commonly occur in children and typically contain both solid and cystic components containing a lipid rich secretion. By contrast, squamous papillary craniopharyngiomas develop in adults and are rare in younger patients. This type of tumor is predominantly solid tumor with small well-defined cavities containing less lipid rich fluid. Craniopharyngiomas in adults have a generally better prognosis in respect to endocrine, visual, and other neurological deficits than those in children (22).


RATHKE’S CYSTS  


Epithelial cysts known as Rathke's cysts are thought to originate from the remnants of Rathke's pouch. Their location can be intrasellar, with or without suprasellar extension and, rarely purely suprasellar. Compared to craniopharyngioma, they are more common in adults (23). Possible symptoms of Rathke's cleft cysts include pituitary hypofunction, hyperprolactinemia brought on by stalk disruption, visual disturbance, and headache. Due to the difficulty in differentiation between craniopharyngiomas and Rathke's cysts from both a clinical and radiologic standpoint, the diagnosis of an intrasellar Rathke’s cyst cannot always be made with absolute certainty. Definitive diagnosis is often only made histologically. Only 6.4% of asymptomatic patients in a recent retrospective cohort showed cystic enlargement over 41 months follow-up and no pituitary deficiency, confirming the safety of conservative management in these patients (24).

PERI-PITUITARY TUMOURS  


Peri-sellar meningiomas are well-circumscribed masses, originating from the sphenoid ridge and are associated with varying degrees of hyperostosis. Meningiomas are typically single, but they can occasionally be multiple. However, females are more likely to develop multiple meningiomas.


Primary intracranial germ cell tumors are neoplasms that arise from aberrantly migrated primordial germ cells. According to histology, the tumor types are similar to those occurring in the gonads and are classified into two categories: germinomas, which are comparable to seminomas and dysgerminomas, and non-germinomatous germ cell tumors, which can include teratomas, yolk sac tumors, embryonal carcinomas, and choriocarcinomas. Geographically, their incidence varies; it accounts for 2-3% of all childhood primary CNS tumors in Western countries, whereas the incidence is higher at 4-15% in Japan (25-27). Patients commonly present in the first two decades of life with diabetes insipidus, visual failure, and hypopituitarism. A recent report highlighted the favorable response to a combined chemotherapy-radiotherapy protocol (27).


Metastasis to the pituitary gland may present as an intrasellar mass resulting in hypopituitarism, diabetes insipidus, or pressure effects. In a published series of 500 consecutive autopsy examinations of cancer patients in whom the pituitary fossa and gland were examined, pituitary metastases were found in 3.6% (28). Pituitary metastases have been described in patients with primary malignant tumors of breast, lung, kidney, thyroid, bladder, uterus, pancreas, and colon.


Vascular Causes


The term pituitary apoplexy denotes the clinical consequences of hemorrhage or infarction in a pre-existing adenoma. The expansion of pituitary mass to neighboring cranial nerves, cavernous sinus, optic pathways, or diencephalon results in localizing signs or altered conscious state. It frequently manifests as a sudden onset of severe headache, a visual disturbance, or ophthalmoplegia as a result of cranial nerve III IV or VI palsies (29). The clinical syndrome of pituitary apoplexy usually evolves fully within only hours to two days. The incidence of surgically treated pituitary adenomas ranges from 0.6 to 9.1%, (30) with a broad age range of occurrence from the first to the ninth decade. Although apoplexy usually occurs spontaneously, systolic and/or diastolic hypertension was seen in 26% of patient in a retrospective analysis, making it an important predisposing factor.  (31). Other reported predisposing factors include diabetes mellitus, radiation therapy, anticoagulant therapy, bleeding disorders, head trauma, sudden changes in arterial or intracranial pressure, such as during carotid angiography, the use of bromocriptine, and postpartum hemorrhage (Sheehan's syndrome). Sheehan's syndrome, which denotes pituitary necrosis after postpartum hemorrhage and hypovolemia, may result in hypopituitarism, that is either immediate or delayed over several years depending on the extent of tissue destruction. However, this condition is rare with modern obstetric care (32).


Suprasellar or intrasellar aneurysms of the carotid arteries, as well as suprasellar aneurysms of the anterior or posterior communicating arteries can manifest as an expanding mass inside the fossa. Hypopituitarism may result directly from intrasellar aneurysms. Histologically, typical degenerative sclerotic changes of the arterial wall are found along with chronic inflammatory changes. An arteriovenous fistula may occasionally develop in the cavernous sinus as a result of an aneurysm.


Immunological/Inflammatory Disease


Inflammatory lesions of the pituitary gland can clinically and radiologically mimic pituitary tumors, with varying degrees of hypopituitarism and mass effects like headaches and visual field impairment.


Lymphocytic hypophysitis classically presents as partial hypopituitarism associated with a pituitary mass lesion, particularly in relation to pregnancy (33). It has been speculated that many cases of postpartum pituitary failure, previously attributed to Sheehan's syndrome, may in fact have been caused by lymphocytic hypophysitis (34,35). In this condition, the interstitial tissue of the adenohypophysis is more or less densely infiltrated by lymphocytes and plasma cells. As a result, the anterior pituitary exhibits necrosis and subsequent fibrosis of hormone-producing cells. Since the histological findings are similar to those of other organ-specific autoimmune diseases, the primary etiology is considered to be autoimmune (36,37). Partial hypopituitarism, commonly with isolated ACTH deficiency, or with TSH deficiency, is seen in approximately 80% of patients, with LH and FSH generally remaining unaffected.


Sarcoidosis is a multisystem disorder, which is characterized by the presence of non-caseating granulomas. It most often affects lungs and reticuloendothelial system but can involve any organ. Central nervous system sarcoidosis occurs with an incidence of 5-15% (38,39) and less than 1% of patients have symptoms of a hypothalamic-pituitary disease (40). Neurosarcoidosis affects primarily the leptomeninges of the brain base and posterior fossa; the hypothalamus and/or pituitary subsequently experience local granulomatous infiltration. Coexisting optic nerve infiltration occurs in many patients causing central and peripheral visual defects. In terms of anterior pituitary function, LH, FSH and GH deficiency are frequent, but TSH and ACTH are relatively preserved.


Langerhans cell histiocytosis is a rare disease characterized by aberrant proliferation of a specific dendritic (Langerhans) cell belonging to the monocyte-macrophage system (41). Deposits occur at multiple sites within the body, and frequently involve the hypothalamo-pituitary axis (42). Diabetes insipidus is a well-recognized and common feature of this condition but anterior pituitary dysfunction also occurs frequently.


Ipilimumab, a cytotoxic T-lymphocyte antigen-4 (CTLA-4) inhibitor, a IgG1 monoclonal antibody against CTLA-4 is used for metastatic melanoma and other neoplasms. As a consequence of immune activation, secondary hypophysitis has been reported in 10-15% of ipilimumab treated patients (36). In severe hypophysitis, immune reactions induced extensive necrosis of the adenohypophyseal architecture. Pituitary autoantibodies against thyrotrophs, corticotrophs, and gonadotrophs were identified in patients with ipilimumab induced hypophysitis (37). Patients usually present with headache and fatigue, the diagnosis of hypopituitarism with multiple deficiencies is made 2-3 months or later after initiation of ipilimumab. Central hypothyroidism is the most frequent deficit, followed by central hypocortisolism, and hypogonadism.


Infections  


Bacterial pituitary sepsis is a rare phenomenon which may arise as a consequence of hematogenous spread or by extension from sinus or meningeal sepsis with subsequent pituitary abscess formation. Small pituitary abscesses have been described at postmortem in patients dying from septicemia. Chronic infection predisposes to necrosis of pituitary tissue with subsequent hypopituitarism. Pituitary tuberculomas may present as space occupying lesions (43)but this appears to be a very rare phenomenon; isolated manifestation of the disease is rare and it is more likely to occur in the context of generalized tuberculous infection with meningitis. Gumma formation, as a manifestation of tertiary syphilis, may occur in the sella region but is extremely rare.


Fungal pituitary infection may occur as a complication of AIDS (44) and pituitary necrosis with hypopituitarism has been described in toxoplasmosis (45).


Radiation Therapy  


Hypopituitarism is a common complication of irradiation administered for pituitary adenomas, head and neck tumors, intracranial malignancy, or as adjunctive cranial irradiation for acute lymphoblastic leukemia. Although fractionated radiotherapy with daily doses of <200cGy is well tolerated and safe in terms of neurological sequelae, the majority of patients who have undergone external irradiation will manifest some degree of pituitary failure during long term follow up. In general, this is a relatively late complication and is rarely evident in less than 3 years in patients with completely normal baseline pituitary function. Growth hormone reserve is particularly susceptible and is progressively more likely with time so that periodic assessment of residual pituitary function is mandatory; a five year follow up study after external pituitary irradiation therapy reported, 100% GH deficiency, 91% LH-FSH deficiency, 77% ACTH deficiency and 42% TSH deficiency (46).


Traumatic Brain Injury


Traumatic brain injury (TBI) is common, the prevalence of endocrine dysfunction in these patients ranges from 15-68% (47), with estimated annual incidence 30 patients per 100,000 population per year. Abnormal axes during the acute phase of injury may recover over time, but other pituitary hormone deficits may evolve later even at 6 months after the initial insult. A prospective longitudinal study looking at patients with severe TBI, found that 6% of their patients had proven severe GHD when evaluated after 12 months (48). Multiple pituitary deficiencies or isolated pituitary deficiencies (TSH or ACTH) were very rare.


Empty Sella Syndrome  


An enlarged empty sella may be primary (due to a congenital diaphragmatic defect) or secondary to surgery, radiation, or pituitary infarction. The majority of patients with congenital empty sella have normal pituitary function. Hypopituitarism (and/or hyperprolactinemia) may be found in instances due to previous pituitary disease. Occasionally, a cystic pituitary mass may simulate an empty sella on CT or MRI, necessitating a cisternogram for precise delineation.


CLINICAL MANIFESTATION OF HYPOPITUITARISM


The clinical impact of pituitary insufficiency is dependent on the extent and severity of hormone deficiencies (Table 2), the duration of the disease and the age of onset; childhood onset hypopituitarism has consequences for all aspects of somatic development in addition to the pathophysiological effects of specific hormonal deficiencies. In addition, there may be clinical features relating to the mass effect of causative lesion or specific consequences attributable to hypersecretion of prolactin, GH, ACTH or TSH from individual tumor types. Hypopituitarism classically develops in sequential order with the secretion of growth hormone, then gonadotrophins being affected first, subsequently followed by TSH and ACTH. Prolactin deficiency is rarely seen, except in Sheehan's syndrome which is associated with failure of lactation. ADH deficiency is almost never seen as a primary feature of pituitary adenomas but is a usual presenting manifestation of germ cell tumors, pituitary metastases, and granulomatous disorders.


Table 2. Summary of Clinical Features of Hypopituitarism


Hormone deficiency

Presentation

Symptoms and signs


Adrenocorticotrophic hormone

Acute

Fatigue, weakness, dizziness, nausea, vomiting, circulatory failure. As in Addison's disease, except lack of hyperpigmentation, absence of hyperkalemia


Chronic

Tiredness, pallor, anorexia, nausea, weight loss, myalgia, hypoglycemia


Gonadotropins

Children

Delayed puberty


Men

Impaired fertility, impotence, reduced libido, decreased muscle mass and strength, decreased bone mass, decreased erythropoiesis and hair growth, fine wrinkles, testicular hypotrophy


Women

Amenorrhea, oligomenorrhea, infertility, loss of libido, dyspareunia, fine wrinkles, breast atrophy, osteoporosis, premature atherosclerosis


Thyroid-stimulating hormone

Children

Growth retardation


Adult

Fatigue, cold intolerance, constipation, weight gain, dry skin, slow relaxing reflexes


Growth hormone

Children

Growth retardation, short stature, increased adiposity


Adult

Reduced exercise capacity, impaired psychological well­being, increased cardiovascular risk, increased central obesity, reduced lean body mass


Prolactin

Decreased

Failure of lactation


Increased

Galactorrhea, oligo/amenorrhea, loss of libido

Antidiuretic hormone


Polyuria, polydipsia including nocturnal


The clinical features of anterior pituitary hypofunction described in this chapter will concentrate on adult-onset hypopituitarism. Many of the symptoms and signs of a specific pituitary hormone deficiency are similar to those that occur in patients with a primary deficiency of the target gland, but there are exceptions.


Growth Hormone Deficiency


GH deficiency (GHD) in adults is characterized by decreased exercise tolerance, decreased mood and general well-being, decreased quality of life, central adiposity, hyperlipidemia, increased predisposition to atherogenesis, and reduced bone remodeling activity. Fine facial wrinkles may result from a deficiency of growth hormone in addition to hypogonadism. The patient will usually have dry thin skin which contrasts with the thickened skin and increased sweating found in acromegaly. Adults with long-standing GHD are often overweight, have reduced lean body mass, increased fat mass, especially visceral fat, relative insulin resistance, and reduced total bone mass. There is a reduction in cardiac and physical performance. GHD is associated with increases in total cholesterol, LDL-cholesterol and apolipoprotein B (49-51). Studies in Sweden and the UK in patients with hypopituitarism receiving controlled thyroid and steroid hormone replacement but without growth hormone replacement, have demonstrated an approximately two fold increase in cardiovascular mortality compared to the general population. (51) and the increase in standardized mortality ratio is more striking in females (52).


The accumulating evidence suggests that the cardiovascular morbidity cannot be explained solely by suboptimal glucocorticoid, gonadal steroid, or thyroid hormone replacement and unsubstituted growth hormone deficiency is probably an important contributing factor. The decreased bone mineral density found in GHD is associated with increased fracture risk (53).


Adrenocorticotrophic Hormone Deficiency


Cortisol and adrenal androgen secretion are ACTH-dependent and are variably decreased in hypopituitarism. Patients with combined ACTH and LH deficiency are completely androgen deficient, a phenomenon that may be particularly important when considering optimum regimens for gonadal steroid replacement in females. Since aldosterone secretion is largely determined by activation of the renin-angiotensin-aldosterone system, it is relatively preserved in the hypopituitary patients. Major symptoms of ACTH deficiency are non-specific, including fatigue, weakness, headache, anorexia, weight loss, nausea, vomiting, abdominal pain, myalgia, and decreased concentration. Hypoglycemia may be present at diagnosis. Hyponatremia is common and is attributable to reduced renal free water clearance as a result of cortisol deficiency with an additional contribution from TSH deficiency if present. Hyperkalemia, which is a frequent finding in primary adrenal failure, does not occur in patients with hypopituitarism due to the relative preservation of aldosterone secretion. Over and above the effects of secondary hypogonadism, reduced adrenal androgen production further exacerbates loss of body hair, particularly in women.


Gonadotrophin Deficiency


Gonadotrophins are responsible for gonadal sex-steroid production, secondary sexual development, maintenance of secondary sexual characteristics, and fertility.


Gonadotrophin deficiency in males’ results in secondary hypogonadism with consequent testosterone deficiency. Clinical features include loss of libido, erectile impotence, oligospermia, reduced erythropoiesis, and decreased lean body mass. Testosterone, via estradiol derived by aromatization, plays an important role in the regulation of bone mineralization, therefore, hypogonadism results in decreased bone mineral density.


Clinical features of secondary hypogonadism in females include oligo/amenorrhea, breast atrophy, diminished secondary sexual hair especially when combined with ACTH deficiency, and a predisposition to osteoporosis.


Thyroid Stimulating Hormone Deficiency


The clinical features of secondary thyroid failure are similar to those of primary thyroid failure with the exception that weight gain is less likely to be a feature if ACTH deficiency is also present. Classical features include cold intolerance, fatigue, and myalgia. Physical examination may demonstrate periorbital edema and delayed reflex relaxation. Additionally, hyponatremia and normochromic normocytic anemia are observed, with the former being exacerbated by cortisol deficit while the latter is aggravated by secondary hypogonadism and GH deficiency.


Prolactin Deficiency


Prolactin deficiency in females result in puerperal alactogenesis, However, isolated prolactin deficiency is uncommon because the great majority of prolactin deficiency states develop as a result of general anterior pituitary problems or as a result of treatment intervention. On the other hand, hyperprolactinemia, which is caused by stalk disruption and results in a lack of dopaminergic regulation from the hypothalamus, is more frequent and can manifest as galactorrhea, abnormal menstruation, loss of libido, and decreased bone density.


Antidiuretic Hormone Deficiency


Antidiuretic Hormone Deficiency (AHD) previously called central diabetes insipidus (CDI) is characterized by polyuria and polydipsia due to decreased secretion of antidiuretic hormone by the neurosecretory cells terminating in the posterior pituitary. If excessive water excretion exceeds intake, patients will progressively become water-depleted and eventually have a reduction in circulating volume. It occurs more frequently in associated with tumors of the hypothalamus, pituitary metastases, lymphocytic hypophysitis, sarcoidosis, Langerhans cell histiocytosis, craniopharyngiomas, and Rathke's cleft cysts. (54). Additionally, it is commonly observed following neurosurgery and head injury. As cortisol is an essential prerequisite for normal glomerular filtration and free water clearance, it should be highlighted that AHD is masked by co-existing ACTH deficiency and only becomes clinically evident after commencement of glucocorticoid replacement. However, it is extremely unusual for AHD to be a primary manifestation of pituitary adenoma.


INVESTIGATION OF SUSPECTED HYPOPITUITARISM


In hypopituitarism, basal serum hormone measurements are required to confirm the insufficiency; however, dynamic testing is mandatory for the diagnosis of some deficiencies. Pituitary function testing is required for all patients presenting with pituitary disease or in whom an evolving endocrine deficiency is anticipated, e.g., those who have undergone pituitary or cranial radiotherapy.


Baseline Investigations  


Basal concentrations of the anterior pituitary hormones and hormones produced by their respective target glands should be measured. Serum samples should be taken unstressed, with no physiological or pharmacological manipulation, between 7 and 9 AM when serum cortisol and testosterone levels are highest. This is important given that the decision to proceed to


 testing is based on these levels. The pituitary hormones may remain within the normal range despite low levels of the target hormones indicating that target gland failure is a consequence of inadequate pituitary stimulation. Baseline investigations (Table 3) are sufficient for the diagnosis of secondary hypothyroidism and hypogonadism and will also confirm virtually complete ACTH deficiency (55).


Table 3. Baseline investigation of pituitary function

1. Adrenocortical axis: serum cortisol (09.00 AM), ACTH
2. Thyroid axis: free T4, TSH
3. Gonadal axis:

Men - testosterone (09.00 AM), SHBG, LH, FSH;

Women - estradiol, LH, FSH, progesterone (Day 21 if menstruating)
4. Prolactin
5. Insulin-like growth factor-1, growth hormone
6. Paired plasma and urine osmolality

ACTH, adrenocorticotropic hormone, FSH, follicle stimulating hormone; LH, luteinizing hormone; SHBG, sex hormone binding globulin


It should be mentioned that the serum total testosterone measurement should be performed in the morning by a reliable assay and the test should be repeated before verifying the diagnosis of testosterone deficiency. Measuring the level of free or bioavailable testosterone level should be performed in those whose total testosterone levels are close to the lower limit of the normal range or whose SHBG is suspected to have altered (56).

Dynamic Testing  

Stimulation tests are used when hypofunction is suspected and are designed to assess the reserve capacity to form and secrete hormone. In contrast, suppression tests are used when endocrine hyperfunction is suspected and are designed to determine whether negative-feedback control is intact, as in the administration of glucocorticoids to inhibit corticotrophin secretion in patients with suspected Cushing’s syndrome or in the administration of glucose in patients with suspected acromegaly. Dynamic pituitary function tests may assess the hypothalamic-pituitary unit (e.g., insulin tolerance test, glucagon, and arginine tests) or directly stimulate the anterior pituitary with pharmacological doses of synthetic hypothalamic peptides and the pituitary hormone response measured (e.g., TRH, GnRH, GHRH tests).


HYPOTHALAMIC-PITUITARY-ADRENAL AXIS  


Baseline and dynamic tests are valuable in the diagnosis of ACTH deficiency. With virtually complete ACTH deficiency, the 0900h serum cortisol is less than 100 nmol/L (3.625 µg/dL). In contrast, if the serum cortisol is 400-500nmol/L (14.5 – 18.1µg/dL) or more, ACTH deficiency is unlikely. (57-59). Therefore, dynamic testing of ACTH reserve is required if the basal serum cortisol measured lies between 100 and 400-500nmol/L. The insulin tolerance test (ITT) or glucagon test may be used to assess the adequacy of the hypothalamic-pituitary-adrenal axis. If the patient is taking hydrocortisone this should be discontinued for 18-24 hours; while prednisolone cross reacts in the cortisol assay and therefore should not be administered within 24 hours of investigation of adrenocortical reserve. The rationale of the ITT is to produce physiological stress in a controlled environment by inducing hypoglycemia with intravenous insulin. Hypoglycemia is a powerful stimulus which stimulates GH and ACTH release and a rise in serum cortisol levels in the presence of an intact hypothalamic-pituitary axis. Although the safety of ITT has been questioned, the only absolute contraindications are ischemic heart disease, epilepsy or unexplained loss of consciousness, untreated hypothyroidism or hypoadrenalism, and glycogen storage disease (58). A decrement in plasma glucose to less than 2.2 mmol/L (40 mg/dL) is required for the test to be valid. With normal ACTH reserve the serum cortisol should rise to at least 550 nmol/L (20 µg/dL). Patients who show a normal cortisol response can withstand major surgery without corticosteroid replacement; while patients with subnormal responses but satisfactory basal values (> 250 nmol/L (9 µg/dL) may not require regular replacement therapy but should be fully informed and carry a steroid card. The ITT should only be performed by fully trained staff in designated units. Hypoglycemia may occasionally require reversal with intravenous glucose to avoid the risk of cerebral edema, which affects 50% of adults but limited to 10% of children.


The glucagon stimulation test (GST) may be used for the assessment of ACTH/cortisol and GH reserve simultaneously when the ITT is contraindicated (60). The subcutaneous injection of glucagon causes a transient rise in plasma glucose. During the subsequent fall in plasma glucose, ACTH and GH are released and measured. Serum cortisol cut-off values are similar to those described for the ITT. Glucagon is less reliable than the ITT as a test of ACTH/ cortisol reserve; it is a less powerful stress stimulus and hence false positive results are a recognized problem.


The short synacthen (Cortrosyn in the USA) test (SST) was originally introduced as a test for primary adrenal failure. It involves the intramuscular or intravenous injection of a pharmacological dose (250μg) of synthetic ACTH, with measurement of the serum cortisol response at 30 and 60 minutes later. The test does not distinguish primary from secondary adrenal insufficiency, and it cannot directly assess pituitary ACTH reserve. The 30-minute serum cortisol response is advocated as a surrogate test of ACTH reserve and has been widely used because of its simplicity. However, there is no study showing that a normal SST indicates that the hypothalamic-pituitary­-adrenal axis is capable of responding normally to major illness or stress. Demonstrations of good correlations between peak serum cortisol responses on ITT and 30-minute responses on SST have been published and are intuitively predictable. However, false negatives with the SST are well recognized although this may be partially obviated by the use of lower synacthen doses (1μg). Nonetheless, the concern about false negative results and the fact that assessment of GH reserve is also frequently required serve to limit the use of the SST in the investigation of pituitary function.


A recent study comparing the ITT, low dose ACTH, and glucagon stimulation test in the evaluation of the HPA axis and GH-IGF-1 axis in patients with pituitary disorders concluded that all three tests were well correlated in terms of peak cortisol and GH response (61). However, low dose ACTH stimulation gave a higher peak cortisol response. Therefore, the cut-off level for the diagnosis of insufficiency of the HPA axis needs to be individualized for each test. See Chapter Adrenal Insufficiency


GROWTH HORMONE  


Normal GH secretion is pulsatile, with four or six pulses per 24 hours, mostly at night in association with REM sleep. A single measurement of serum GH is rarely useful although the fortuitous coincidence of blood sampling at the time of a GH secretory peak may exclude GHD. A stimulatory test is therefore usually required to assess somatotroph reserve. Most, actions of GH are mediated through hepatically or locally-derived insulin-like growth factor-1 (IGF-1). Measurement of baseline serum IGF-1 is a specific but insensitive test of GHD in patients with pituitary disease. Importantly, IGF-1 declines with normal aging. In adult onset GHD, 30% of patients may have serum IGF-1 levels in the lower half of the age-related reference range, with the percentage increasing with age (62). Therefore, a low serum IGF-1, in an adequately nourished patient without liver dysfunction, strongly supports a diagnosis of GHD, but a normal serum IGF-1 cannot exclude it.


A rigid and precise biochemical diagnosis of GHD is required in the context of justification of growth hormone replacement. The ITT is one of the most reliable provocative tests of GH secretion and currently remains the test of choice for this purpose since it has the advantage of assessing ACTH reserve simultaneously. Severe GHD is defined as a peak GH response to insulin induced hypoglycemia of less than 3ng/mL (9mU/L) (63). Obesity may blunt the GH response to dynamic testing so that the diagnosis of GHD should only be made in the context of structural pituitary disease or previous cranial irradiation and/or additional pituitary hormone deficits.


If the ITT is contraindicated, an alternative test for assessment of GH reserve is required. Glucagon, arginine, a combination of arginine and GHRH or growth hormone-releasing peptides may all be used for this purpose. The combination of GHRH plus arginine is the most powerful provocative test of GH secretion but appropriate normative data are required (64-66). Recently, the FDA approved macimorelin, which is a non-peptidyl agonist of GH secretagogue receptor 1a as a diagnostic agent for diagnosing GH deficiency, and macimorelin stimulation test was known to have good sensitivity and specificity in comparison with ITT (67). However, this oral agent is not widely used due to its cost and limited availability.


PITUITARY-THYROID AXIS  


In the appropriate clinical context, secondary hypothyroidism can be diagnosed on the basis of a low serum thyroxine (T4, total or free) in the presence of low or low normal TSH (TSH is rarely undetectable in hypopituitarism). However, it should be borne in mind that any systemic illness may produce a reversible reduction in serum T4 (sick euthyroid state).


Dynamic testing using thyrotrophin releasing hormone (TRH) has no diagnostic value for secondary hypothyroidism or predicting a risk of developing TSH deficiency. Although patients with hypothalamic disease may show a delayed response to TRH, this test is seldom used in pituitary reserve assessment. Furthermore, intravenous TRH may precipitate hemorrhagic infarction of pituitary adenomas.


PITUITARY-GONADAL AXIS  


Symptoms of sex steroid deficiency, menstrual disturbance, low serum estradiol or low serum testosterone levels in the presence of normal or low concentrations of FSH/LH are the mainstay of diagnosis of hypogonadotropic hypogonadism. The gonadotrophin releasing hormone (GnRH) test has virtually no diagnostic value but is used to confirm gonadotroph reserve in the setting of pulsatile GnRH therapy for infertility.


POSTERIOR PITUITARY FUNCTION  


Basal investigations include plasma and urine osmolalities obtained simultaneously. In overt AHD, plasma osmolality is usually raised in the presence of inappropriately diluted urine. The diagnosis of partial AHD is confirmed by means of a water deprivation test followed by demonstration of a response to desmopressin. Copeptin is the most recent clinical diagnostic marker for AHD due to its strong correlation with plasma arginine vasopressin (AVP) (68). Copeptin is secreted in equimolar ratio to AVP, mirroring AVP concentrations in the circulation. A copeptin level of 4.9pmol/L stimulated with hypertonic saline infusion differentiates between AHD and primary polydipsia with a high diagnostic accuracy and is superior to the water deprivation test (69). See Chapters on Posterior Pituitary.

Imaging the Pituitary  

Magnetic resonance imaging (MRI) is the optimum method of imaging, with computerized tomography (CT) as an acceptable alternative. The only disadvantage to MRI is its insensitivity in defining pathological calcification and lack of signal from corticated bone. CT may be required to demonstrate calcification in craniopharyngiomas and hyperostosis; it is also used by many surgeons to define skeletal anatomy prior to surgery.


MANAGEMENT OF HYPOPITUITARISM


Hypopituitarism, once established, is usually permanent. However, resection of pituitary tumors may, on occasion, result in resumption of normal pituitary function.


Although a seemingly straightforward clinical exercise, hormone replacement therapy cannot simulate normal physiology precisely. With the exception of GH replacement and treatment of infertility, replacement therapy is achieved by administering target hormones. The aim of hormone replacement is to safely eliminate or minimize the symptoms and clinical signs of specific hormone deficiencies. The Endocrine Society Clinical Practice Guidelines committee have issued recommended treatment option of each target hormone deficiency either primary or secondary for the management of hypopituitarism (70).


Hypocortisolism


Hydrocortisone is now the most widely used form of glucocorticoid replacement in patients with primary and secondary adrenal insufficiency. There is no universal agreement regarding the appropriate dose, timing, and monitoring of hydrocortisone replacement. Normal individuals demonstrate undetectable serum cortisol and ACTH when asleep at midnight, with a rise during the early hours of the morning to reach a peak at 0800-0900h, followed by a steady decline throughout the rest of the waking day. There are variable peaks of cortisol secretion due to other factors such as stress, meals, and exercise. Since cortisone acetate requires conversion into hydrocortisone under the influence of 11ß-hydroxysteroid dehydrogenase type 1 (11β-HSD1), and the fact that the enzyme activity is altered in patients with GHD; therefore, cortisone renders intuitively less satisfactory than hydrocortisone for replacement purposes in this condition. Prednisolone has been advocated by some on account of its longer duration of action than hydrocortisone. However, because it cannot be routinely measured, it is impossible to fine tune the replacement dose. Dexamethasone, the alternative synthetic glucocorticoid replacement, is even less satisfactory because of wide interindividual variations in metabolic clearance rates.


Traditional hydrocortisone replacement utilized twice daily dosing but many patients report fatigue or headache in the afternoon on this regimen. There is evidence that many patients 'feel better' on thrice daily regimes (71). Recent cross-sectional studies did not demonstrate any superiority between three times a day versus twice daily replacement in terms of quality of life (72). The average daily requirement is approximately 20mg of hydrocortisone. This should be given as 10mg on waking, 5mg at lunchtime and 5mg in the early evening. Enzyme-inducing drugs, especially, phenytoin, carbamazepine, and rifampicin can increase the metabolism of corticosteroids and should prompt an increment in replacement doses. Doses are therefore fine-tuned according to patient’s well-being and multiple serum cortisol levels (hydrocortisone day curve, HCDC) taken during the day in many centers. (55,73). Some centers have attempted to utilize urine free cortisol measurements to adjust the hydrocortisone dose; however, this is unreliable because saturation of cortisol binding globulin (CBG) following oral hydrocortisone results in supraphysiological urine free cortisol excretion (74). The HCDC should demonstrate adequate levels of cortisol throughout the day, without excess peak (cortisol e.g., >1000 nmol/L (36.25 µg/dL)) or trough (e.g., <100 nmol/L (3.625 µg/dL)) levels before or after doses.


In clinical practice, there is no reliable measure to be certain if patients are receiving optimal glucocorticoid replacement therapy. As a result, patients may be over- or under- treated with resultant morbidity (65). There is a significant increase in 11β-HSD1 activity resulting in abnormalities in corticosteroid metabolism in patients with ACTH deficiency treated with conventional doses of hydrocortisone (66). In ACTH-deficient patients daily hydrocortisone dose exceeding 20mg/day is associated with increase waist to hip ratio. The induction of 11β-HSD1 is associated with central adiposity and has an important role in the development of the metabolically adverse hypopituitary phenotype.


Conventional hydrocortisone cannot mimic the circadian rhythms of cortisol release; in particular the early morning rise in cortisol which slowly declines throughout the day. This has led to the development of a modified release formulation of hydrocortisone (MR-HC, Chronocort®) which can be taken late at night thus allowing a delayed and sustained release (75).  A study in healthy men demonstrated that MR-HC 20mg and 10mg, given at 2300 and 0700 hours respectively, could achieve a near normal cortisol circadian rhythm (76). A subsequent phase II study demonstrated that the MR-HC mimics the normal circadian pattern closer to physiological baseline (77); however, the studied preparation is no longer available. An alternative modified formulation (Plenadren®) incorporates an immediate release and delayed release components, which displays diurnal plasma cortisol levels similar to physiological profile. Once daily Plenadren® has been shown to reduce weight, blood pressure and improve glucose metabolism when compared with thrice daily dosing (78).


Another newer oral immediate-release granule formulation of HC (Alkindi®) was approved in EU in 2018. This is an immediate-release hydrocortisone preparation specifically designed for pediatric dosing, which is available in four doses: 0.5mg, 1mg, 2mg and 5mg (79).


Table 5 summarizes the glucocorticoid compounds currently available for adrenal insufficiency.


Table 5. Compounds Available for Adrenal Insufficiency

Glucocorticoid

Timing

Dose

Hydrocortisone

2-3 times/day; waking, early PM, and at least 6 hours from bedtime

10-20mg

Prednisolone

Once in morning

3-5mg

Modified release hydrocortisone (Chronocort®)

2times/day; waking and before bed

10mg in AM and 20mg at bedtime

Modified release hydrocortisone (Plenadren®)

Once daily in early morning

Equal to standard HC dose or a 20% increase

Oral immediate release granules (Alkindi®)

Once daily in early morning

Equal to appropriate pediatric hydrocortisone dosing


The effects of continuous subcutaneous hydrocortisone infusion (CSHI) have been compared with conventional oral hydrocortisone in patients with Addison’s disease (80). CSHI produced a more physiological circadian rhythm, normalization of morning ACTH and restoration of nocturnal serum cortisol levels. These infusions are cumbersome and impractical outside of expert centers. Despite a more circadian pattern of cortisol exposure, subcutaneous hydrocortisone infusion was not associated with improved quality of life scores, casting doubt on the potential quality of life effects of circadian cortisol delivery (81).


There is a push to design orally active delayed or sustained release formulations of hydrocortisone to aid the physiological replacement of hydrocortisone and ultimately improve quality of life and side effect profiles in patients requiring lifelong glucocorticoid replacement.


Patients with ACTH deficiency receiving hydrocortisone therapy are unable to respond to surgery, trauma, infections, and severe illnesses by increasing their cortisol concentrations. They therefore require supplemental hydrocortisone therapy with increased oral doses during minor illness, or administration of intramuscular hydrocortisone 100mg four times per day with more severe disease or if oral intake is compromised. When intramuscular injections are contraindicated, a continuous intravenous infusion of hydrocortisone at a rate of 1-3mg per hour provides satisfactory replacement for the severely ill patient. Maintenance mineralocorticoid is not required since aldosterone secretion is usually preserved.


Patients should carry a 'steroid card' and wear a 'medic-alert' bracelet to indicate their requirement for supplemental hydrocortisone in the event of severe illness or trauma. They and their families should understand the importance of life-long compliance, be taught to double the hydrocortisone dose in the event of pyrexial illness, and understand the need for parenteral glucocorticoid replacement if vomiting or diarrhea occurs. An 'emergency' ampoule of hydrocortisone should be provided for domiciliary emergency intramuscular injection and the patient instructed on its use.


Dehydroepiandrosterone (DHEA) is an androgen produced by the adrenal cortex and is also under the regulation of corticotrophin, and is thus deficient in hypopituitarism. In hypopituitarism, DHEA supplementation (25-50mg per day) has shown benefit with respect to well-being and sexual function (82,83). Furthermore, in patients who are replaced with GH, DHEA can augment the IGF-1 response hence leading to a reduction of GH dose in females (84). Currently, there is no licensed preparation of DHEA available, and it is considered to be a food supplement rather than a bioactive drug. However, not all patients respond. Moreover, the androgenic side effects such as greasy skin, acne, and increased body hair may be a limiting factor although generally responsive to dose reduction.


Secondary Hypothyroidism


Synthetic levothyroxine sodium (for example, Synthroid) is the preferred form of replacement. It has a long half-life, allowing a once daily dose. Liothyronine (T3) displays superior gastrointestinal absorption, but its short half-life requires two to three daily doses. Use of T3 is largely restricted to thyroid cancer patients undergoing frequent isotopic imaging or treatment, and occasionally the initiation of thyroid hormone replacement when a gradual increase is desired. Although some experts consider using a T4/T3 combination as an experimental treatment for patients with persistent hypothyroid symptoms on LT4 since patients with normal thyrotropin levels may have lower T3 levels, the evidence is primarily limited to athyreotic patients.(85,86)


Commencing thyroid hormone replacement in patients with severe, untreated ACTH deficiency may result in hypoadrenal crisis. In the situation of combined deficiency, hydrocortisone should always be commenced before thyroxine. The duration of hypopituitarism and presence of co-morbidities, especially ischemic heart disease, should be considered. Young patients with a short history of hypopituitarism and TSH deficiency may commence an initial thyroxine dose of 100µg daily. On the other hand, in patients with a long history of hypopituitarism or elderly patients, a low dose of 25-50µg daily should be commenced, in order to minimize the risk of precipitation of cardiac events.


Alteration of the hypothalamic-pituitary-thyroid axis following growth hormone replacement is well documented (87-89). GHD will mask central hypothyroidism in a significant proportion of hypopituitary patients both in children and adults. It has been observed that apparently euthyroid hypopituitary patients will require commencement or an increase in thyroxine replacement following initiation of GH replacement. A higher target serum free T4 in the upper half of reference range is appropriate in the GH deficient patient who is not on GH replacement.


Unlike primary hypothyroidism, in which serum TSH is a sensitive marker of under-or over-replacement, there is no biochemical marker to indicate the optimum level of replacement in TSH deficiency. The serum free T4 is the best marker for assessing replacement adequacy in hypopituitarism. By analogy with serum T4 levels in adequately replaced primary hypothyroidism, a conventional recommendation is to maintain serum free T4 in the upper part of the reference range for normal individuals (90). Serum total T4 levels are elevated artefactually by conditions which increase serum thyronine binding globulin, especially estrogen administration.


Gonadotrophin Deficiency


Choice of replacement ranges from oral, transdermal, intramuscular, or subcutaneous administration of gonadal steroids to gonadotropin or gonadotropin-releasing hormone therapy if and when fertility is desired.


WOMEN


Estrogen replacement should be offered to all women with secondary hypogonadism under the age of 50 years in order to avoid immediate symptoms of estrogen deficiency and prevent premature reduction in bone mineral density. The addition of progesterone is mandatory if the uterus is intact in order to avoid unopposed estrogen stimulation of the endometrium with the attendant risk of hyperplasia and neoplasia. The standard regimen for replacement involves the daily administration of estrogen with progesterone co-administrated for 12-14 consecutive days during a 4-week cycle; menses occur cyclically after progesterone withdrawal. Alternatively, a continuous regimen may be employed in which estrogen and progesterone are combined. The latter may be preferred by older patients and there are no adverse effects described apart from unpredictable menstrual bleeding during the initial few months of therapy in a minority of patients. However, since the risk-benefit profile of estrogen therapy is influenced by numerous factors, such as age, treatment-onset since menopause, and existing comorbidities, shared decision making is essential when determining what and route to administer as well as when to stop this treatment.


Estrogen replacement can be administrated via the oral, transdermal, and subcutaneous routes. Oral estrogens undergo extensive hepatic first-pass metabolism necessitating average doses of 1-2mg estradiol per day, or equivalent.


Transdermal preparations are usually applied twice weekly and provide 50-100µg mcg of estradiol per 24 hours in a cyclical combination with a progestogen. Skin irritation may occur but transdermal therapy is the first choice in patients with complex pituitary disease since it avoids the effects of oral estrogen on other hormone binding proteins. Furthermore, in women on concomitant GH replacement, IGF-1 generation is greater when transdermal rather than oral estrogen is used, therefore decreasing the dose of GH required. Subcutaneous implants are inserted every six months, but tachyphylaxis is a frequent problem and limits the value of this regimen.


In addition to relieve vasomotor symptoms and reduce risk of bone loss, hormone therapy may be prescribed on the market to seeking for cardioprotection. According to recent research from the combined Women’s Health Initiative (WHI) studies, women who start hormone therapy closer to the period of natural menopause have a decreased risk of coronary heart disease than women who wait longer after menopause. However, this replacement is not advised for either primary or secondary cardiovascular disease prevention (91).


Concerning the negative effects of estrogen replacement, it has been well established that estrogen, particularly oral estrogen, increases the risk of venous thromboembolism; although transdermal hormone therapy does not seem to enhance this risk (92). In terms of breast cancer, risk varies depending on hormonal formulation and length of treatment. In light of this, selective estrogen receptor modulators (SERMs) have an important role and have obtained licensing for this purpose. Raloxifene has very little effect on the vasomotor symptoms of estrogen deficiency, but is beneficial in prevention and treatment of osteoporosis as well as chemoprevention of breast cancer. Tibolone, an agent with estrogenic, progestogenic, and weak androgenic activity, can provide an alternative treatment for postmenopausal symptoms and also exerts favorable effects on bone.


In some patients with combined LH/FSH and ACTH deficiency, low libido may persist despite conventional estrogen and progesterone replacement. This could be a consequence of complete androgen deficiency and some studies have shown that low dose testosterone replacement, e.g., 50-100mg subcutaneous implants every 6 months, is effective for treating hypoactive sexual desire disorder. The guideline also recommends considering a 6-month therapeutic trial of transdermal testosterone for women who fit this diagnosis (93). Oral combinations of estradiol and testosterone are also available. FSH and LH injections are necessary for fertility; recombinant forms of both are now available and this treatment is usually supervised through fertility clinics.


MEN


Apart from relief of the symptoms of hypogonadism, androgen replacement is also important in maintaining bone integrity, muscle mass, and normal erythropoiesis (94).


The most common method of androgen replacement is as an intramuscular depot injection of testosterone ester (e.g., testosterone enanthate, 250mg intramuscularly three weekly). The ensuing supraphysiological peaks and troughs of serum testosterone may lead to fluctuations in mood, libido, and energy levels but treatment is generally very well tolerated.  Depot testosterone injection has become available; testosterone undecanoate (Nebido), can be administrated intramuscularly every three months (95), and maintains physiological testosterone levels without major fluctuation.


Oral testosterone undecanoate is administered two or three times a day. It is extensively metabolized to dihydrotestosterone in the intestine and is absorbed via the lymphatic system. It is generally well tolerated and is most useful in patients with partial hypogonadism or in those who are unable to tolerate depot injections.


Testosterone pellets, implanted subcutaneously at a dose between 400-600mg, will provide normal testosterone levels as well as physiological levels of estradiol and dihydrotestosterone for up to six months (96). Peak serum testosterone levels are seen 2-4 weeks after placement with a gradual decline thereafter. The main disadvantage is the need for a skin incision and the occasional complication of local infection and extrusion of the pellets.


Several other systems for testosterone delivery are available and include patches (97) and gels (98) applied to the skin and buccal bioadhesive tablets (99). Transdermal gel (Testogel, Testim) has become very popular; it must be applied daily to maintain desirable serum testosterone levels. Patches can cause skin irritation in approximately 50% of patients. Buccal testosterone (Striant) is placed on the buccal mucosa above the incisor tooth; testosterone is slowly released over 12 hours. However, gum irritation and inconvenience have been reported.


Induction of spermatogenesis requires injections of FSH and LH; our own practice is to administer FSH 300 units three times weekly and LH 1500 units twice weekly; increases in sperm density are not evident for at least 4 months.


Monitoring Testosterone Replacement


Testosterone levels can be measured in blood as a guide of the adequacy of replacement. With intramuscular depot injections, serum testosterone usually peaks at approximately one week after injection with a nadir prior to the next injection. The nadir serum testosterone concentration should approximate the lower end of the normal reference range and this may require adjustment of the frequency of injections. Random serum testosterone is often low or low normal on oral testosterone undecanoate, but the additional measurement of serum dihydrotestosterone is useful.


Published guidelines (100) addressed the concerns of the risk for either benign or malignant prostate disease. There is no evidence that the incidence of prostate carcinoma in patients on testosterone replacement is greater than background population risk. Referral to a urologist is recommended if the patient has prostatic symptoms or an abnormal digital rectal examination or elevated serum prostate specific antigen (PSA) increasing by more than 1.4ng/mL over 12 months. With the increasing use of long-acting testosterone, it is important to monitor the hematocrit to detect polycythemia. The hematocrit should return to normal before testosterone may be reinstituted at a lower dose.


The available evidence suggests that testosterone replacement should be offered cautiously in patients with a low risk of recurrence for prostatic neoplasm who have been treated with radical prostatectomy and in whom the PSA has normalized (101). Similarly, a retrospective study of patients treated with prostatectomy as primary management with a low PSA at baseline of testosterone therapy and concurrent use of 5α reductase reported that there was no increase in PSA at 15 months (56). However, patients with no definitive surgery treated with brachytherapy or external beam radiation and a raised PSA at baseline should not be offered this treatment.


Growth Hormone Deficiency


The rationale and protocol for growth hormone replacement in adults is discussed in detail in the "Adult Growth Hormone Deficiency" chapter.


Diabetes Insipidus


1-desamino-8-D-arginine-vasopressin (DDAVP) is a synthetic analogue of arginine vasopressin which produces prolonged antidiuresis after intravenous, intranasal or oral administration in patients with AHD. A therapeutic trial of DDAVP, 10-20 mcg intranasally should control polyuria for up to 16 hours. Patients with AHD must have instant improvement in symptoms. In the acute clinical setting, for example where diabetes insipidus follows pituitary surgery, DDAVP is best administrated via the subcutaneous route at a dose of 0.5-1μg. Doses of DDAVP that are too high can lead to hyponatremia if patients continue to drink inappropriately despite antidiuresis. Patient education is required to achieve optimum symptom control particularly at night and to maintain a normal serum osmolality and sodium concentration (102). Slight undertreatment, with normal water homeostasis being maintained by thirst mechanisms, is the preferred approach. Many patients demonstrate adequate control of the condition with a single bedtime dose of intranasal DDAVP but an additional morning dose may be required. Mild degrees of AHD may be treated with oral DDAVP up to 600µg daily in divided doses. If ADH deficiency is accompanied by a reduced thirst threshold, it is most important to monitor body weight and urine output on a fixed dose of DDAVP and adjust fluid intake accordingly.


A recent guideline has been developed for inpatient treatment of diabetes insipidus highlighting that this can develop into a life-threatening situation if inappropriately managed (103). This again highlights that there is an increased risk of mortality and adverse outcomes in patient with hypopituitarism admitted for acute medical conditions especially ones with diabetes insipidus (104).


GUIDELINES


Wierman ME, Arlt W, Basson R, Davis SR, Miller KK, Murad MH, Rosner W, Santoro N. Androgen therapy in women: a reappraisal: an Endocrine Society clinical practice guideline. J Clin Endocrinol Metab 2014 Oct;99(10):3489-510.


Fleseriu M, Hashim IA, Karavitaki N, Melmed S, Murad MH, Salvatori R, Samuels MH. Hormonal Replacement in Hypopituitarism in Adults: An Endocrine Society Clinical Practice Guideline. J Clin Endocrinol Metab. 2016 Nov;101(11):3888-3921.


Bhasin S, Brito JP, Cunningham GR, Hayes FJ, Hodis HN, Matsumoto AM, Snyder PJ, Swerdloff RS, Wu FC, Yialamas MA. Testosterone Therapy in Men With Hypogonadism: An Endocrine Society Clinical Practice Guideline. J Clin Endocrinol Metab. 2018 May 1;103(5):1715-1744


REFERENCES


  1. Achermann JC, Jameson JL. Fertility and infertility: genetic contributions from the hypothalamic-pituitary-gonadal axis. Mol Endocrinol 1999;13:812-818
  2. Dattani MT, Martinez-Barbera JP, Thomas PQ, Brickman JM, Gupta R, Martensson IL, Toresson H, Fox M, Wales JK, Hindmarsh PC, Krauss S, Beddington RS, Robinson IC. Mutations in the homeobox gene HESX1/Hesx1 associated with septo-optic dysplasia in human and mouse. Nat Genet 1998;19:125-133
  3. Parks JS, Brown MR, Hurley DL, Phelps CJ, Wajnrajch MP. Heritable disorders of pituitary development. J Clin Endocrinol Metab 1999;84:4362-4370
  4. Fofanova O, Takamura N, Kinoshita E, Parks JS, Brown MR, Peterkova VA, Evgrafov OV, Goncharov NP, Bulatov AA, Dedov II, Yamashita S. Compound heterozygous deletion of the PROP-1 gene in children with combined pituitary hormone deficiency. J Clin Endocrinol Metab 1998;83:2601-2604
  5. Deladoey J, Fluck C, Buyukgebiz A, Kuhlmann BV, Eble A, Hindmarsh PC, Wu W, Mullis PE. "Hot spot" in the PROP1 gene responsible for combined pituitary hormone deficiency. J Clin Endocrinol Metab 1999;84:1645-1650
  6. Radovick S, Nations M, Du Y, Berg LA, Weintraub BD, Wondisford FE. A mutation in the POU-homeodomain of Pit-1 responsible for combined pituitary hormone deficiency. Science 1992;257:1115-1118
  7. Aarskog D, Eiken HG, Bjerknes R, Myking OL. Pituitary dwarfism in the R271W Pit-1 gene mutation. Eur J Pediatr 1997;156:829-834
  8. Cohen LE, Wondisford FE, Salvatoni A, Maghnie M, Brucker-Davis F, Weintraub BD, Radovick S. A "hot spot" in the Pit-1 gene responsible for combined pituitary hormone deficiency: clinical and molecular correlates. J Clin Endocrinol Metab 1995;80:679-684
  9. Fantes J, Ragge NK, Lynch SA, McGill NI, Collin JR, Howard-Peebles PN, Hayward C, Vivian AJ, Williamson K, van H, V, Fitzpatrick DR. Mutations in SOX2 cause anophthalmia. Nat Genet 2003;33:461-463
  10. Kelberman D, de Castro SC, Huang S, Crolla JA, Palmer R, Gregory JW, Taylor D, Cavallo L, Faienza MF, Fischetto R, Achermann JC, Martinez-Barbera JP, Rizzoti K, Lovell-Badge R, Robinson IC, Gerrelli D, Dattani MT. SOX2 plays a critical role in the pituitary, forebrain, and eye during human embryonic development. J Clin Endocrinol Metab 2008;93:1865-1873
  11. Errichiello E, Gorgone C, Giuliano L, Iadarola B, Cosentino E, Rossato M, Kurtas NE, Delledonne M, Mattina T, Zuffardi O. SOX2: Not always eye malformations. Severe genital but no major ocular anomalies in a female patient with the recurrent c.70del20 variant. Eur J Med Genet 2018;61:335-340
  12. Stankiewicz P, Thiele H, Schlicker M, Cseke-Friedrich A, Bartel-Friedrich S, Yatsenko SA, Lupski JR, Hansmann I. Duplication of Xq26.2-q27.1, including SOX3, in a mother and daughter with short stature and dyslalia. Am J Med Genet A 2005;138:11-17
  13. Takagi M, Ishii T, Torii C, Kosaki K, Hasegawa T. A novel mutation in SOX3 polyalanine tract: a case of Kabuki syndrome with combined pituitary hormone deficiency harboring double mutations in MLL2 and SOX3. Pituitary2014;17:569-574
  14. Jones GE, Robertson L, Warman P, Craft EV, Cresswell L, Vasudevan PC. 14q22.3 Microdeletion encompassing OTX2 in a five-generation family with microphthalmia, pituitary abnormalities, and intellectual disability. Ophthalmic Genet 2016;37:352-353
  15. Burris TP, Guo W, McCabe ER. The gene responsible for adrenal hypoplasia congenita, DAX-1, encodes a nuclear hormone receptor that defines a new class within the superfamily. Recent Prog Horm Res 1996;51:241-259
  16. Bick D, Franco B, Sherins RJ, Heye B, Pike L, Crawford J, Maddalena A, Incerti B, Pragliola A, Meitinger T, . Brief report: intragenic deletion of the KALIG-1 gene in Kallmann's syndrome. N Engl J Med 1992;326:1752-1755
  17. Couture C, Saveanu A, Barlier A, Carel JC, Fassnacht M, Fluck CE, Houang M, Maes M, Phan-Hug F, Enjalbert A, Drouin J, Brue T, Vallette S. Phenotypic homogeneity and genotypic variability in a large series of congenital isolated ACTH-deficiency patients with TPIT gene mutations. J Clin Endocrinol Metab 2012;97:E486-495
  18. Katznelson L, Alexander JM, Klibanski A. Clinical review 45: Clinically nonfunctioning pituitary adenomas. J Clin Endocrinol Metab 1993;76:1089-1094
  19. Kovacs K, Scheithauer BW, Horvath E, Lloyd RV. The World Health Organization classification of adenohypophysial neoplasms. A proposed five-tier scheme. Cancer 1996;78:502-510
  20. Adams CB. The management of pituitary tumours and post-operative visual deterioration. Acta Neurochir (Wien ) 1988;94:103-116
  21. DeVile CJ, Grant DB, Hayward RD, Stanhope R. Growth and endocrine sequelae of craniopharyngioma. Arch Dis Child 1996;75:108-114
  22. Adamson TE, Wiestler OD, Kleihues P, Yasargil MG. Correlation of clinical and pathological features in surgically treated craniopharyngiomas. J Neurosurg 1990;73:12-17
  23. Ross DA, Norman D, Wilson CB. Radiologic characteristics and results of surgical management of Rathke's cysts in 43 patients. Neurosurgery 1992;30:173-178
  24. Sala E, Moore JM, Amorin A, Carosi G, Martinez H, Jr., Harsh GR, Arosio M, Mantovani G, Katznelson L. Natural history of Rathke's cleft cysts: A retrospective analysis of a two centres experience. Clin Endocrinol (Oxf) 2018;89:178-186
  25. Takeuchi J, Handa H, Nagata I. Suprasellar germinoma. J Neurosurg 1978;49:41-48
  26. Ho DM, Liu HC. Primary intracranial germ cell tumor. Pathologic study of 51 patients. Cancer 1992;70:1577-1584
  27. Janmohamed S, Grossman AB, Metcalfe K, Lowe DG, Wood DF, Chew SL, Monson JP, Besser GM, Plowman PN. Suprasellar germ cell tumours: specific problems and the evolution of optimal management with a combined chemoradiotherapy regimen. Clin Endocrinol (Oxf) 2002;57:487-500
  28. Max MB, Deck MD, Rottenberg DA. Pituitary metastasis: incidence in cancer patients and clinical differentiation from pituitary adenoma. Neurology 1981;31:998-1002
  29. Bills DC, Meyer FB, Laws ER, Jr., Davis DH, Ebersold MJ, Scheithauer BW, Ilstrup DM, Abboud CF. A retrospective analysis of pituitary apoplexy. Neurosurgery 1993;33:602-608
  30. Wakai S, Fukushima T, Teramoto A, Sano K. Pituitary apoplexy: its incidence and clinical significance. J Neurosurg 1981;55:187-193
  31. Randeva HS, Schoebel J, Byrne J, Esiri M, Adams CB, Wass JA. Classical pituitary apoplexy: clinical features, management and outcome. Clin Endocrinol (Oxf) 1999;51:181-188
  32. Barkan AL. Pituitary atrophy in patients with Sheehan's syndrome. Am J Med Sci 1989;298:38-40
  33. Jenkins PJ, Chew SL, Lowe DG, Afshart F, Charlesworth M, Besser GM, Wass JA. Lymphocytic hypophysitis: unusual features of a rare disorder. Clin Endocrinol (Oxf) 1995;42:529-534
  34. Asa SL, Bilbao JM, Kovacs K, Josse RG, Kreines K. Lymphocytic hypophysitis of pregnancy resulting in hypopituitarism: a distinct clinicopathologic entity. Ann Intern Med 1981;95:166-171
  35. Cheung CC, Ezzat S, Smyth HS, Asa SL. The spectrum and significance of primary hypophysitis. J Clin Endocrinol Metab 2001;86:1048-1053
  36. Thodou E, Asa SL, Kontogeorgos G, Kovacs K, Horvath E, Ezzat S. Clinical case seminar: lymphocytic hypophysitis: clinicopathological findings. J Clin Endocrinol Metab 1995;80:2302-2311
  37. Annane D, Sebille V, Troche G, Raphael JC, Gajdos P, Bellissant E. A 3-level prognostic classification in septic shock based on cortisol levels and cortisol response to corticotropin. JAMA 2000;283:1038-1045
  38. Oksanen V. Neurosarcoidosis: clinical presentations and course in 50 patients. Acta Neurol Scand 1986;73:283-290
  39. Chapelon C, Ziza JM, Piette JC, Levy Y, Raguin G, Wechsler B, Bitker MO, Bletry O, Laplane D, Bousser MG, . Neurosarcoidosis: signs, course and treatment in 35 confirmed cases. Medicine (Baltimore) 1990;69:261-276
  40. Stern BJ, Krumholz A, Johns C, Scott P, Nissim J. Sarcoidosis and its neurological manifestations. Arch Neurol 1985;42:909-917
  41. Willman CL, Busque L, Griffith BB, Favara BE, McClain KL, Duncan MH, Gilliland DG. Langerhans'-cell histiocytosis (histiocytosis X)--a clonal proliferative disease. N Engl J Med 1994;331:154-160
  42. Kaltsas GA, Powles TB, Evanson J, Plowman PN, Drinkwater JE, Jenkins PJ, Monson JP, Besser GM, Grossman AB. Hypothalamo-pituitary abnormalities in adult patients with langerhans cell histiocytosis: clinical, endocrinological, and radiological features and response to treatment. J Clin Endocrinol Metab 2000;85:1370-1376
  43. Basaria S, Ayala AR, Guerin C, Dobs AS. A rare pituitary lesion. J Endocrinol Invest 2000;23:189-192
  44. Ferreiro J, Vinters HV. Pathology of the pituitary gland in patients with the acquired immune deficiency syndrome (AIDS). Pathology 1988;20:211-215
  45. Milligan SA, Katz MS, Craven PC, Strandberg DA, Russell IJ, Becker RA. Toxoplasmosis presenting as panhypopituitarism in a patient with the acquired immune deficiency syndrome. Am J Med 1984;77:760-764
  46. Littley MD, Shalet SM, Beardwell CG, Ahmed SR, Applegate G, Sutton ML. Hypopituitarism following external radiotherapy for pituitary tumours in adults. Q J Med 1989;70:145-160
  47. Schneider HJ, Kreitschmann-Andermahr I, Ghigo E, Stalla GK, Agha A. Hypothalamopituitary dysfunction following traumatic brain injury and aneurysmal subarachnoid hemorrhage: a systematic review. JAMA 2007;298:1429-1438
  48. Personnier C, Crosnier H, Meyer P, Chevignard M, Flechtner I, Boddaert N, Breton S, Mignot C, Dassa Y, Souberbielle JC, Piketty M, Laborde K, Jais JP, Viaud M, Puget S, Sainte-Rose C, Polak M. Prevalence of pituitary dysfunction after severe traumatic brain injury in children and adolescents: a large prospective study. J Clin Endocrinol Metab 2014;99:2052-2060
  49. de BH, Blok GJ, van d, V. Clinical aspects of growth hormone deficiency in adults. Endocr Rev 1995;16:63-86
  50. Christ ER, Carroll PV, Russell-Jones DL, Sonksen PH. The consequences of growth hormone deficiency in adulthood, and the effects of growth hormone replacement. Schweiz Med Wochenschr 1997;127:1440-1449
  51. Carroll PV, Christ ER, Bengtsson BA, Carlsson L, Christiansen JS, Clemmons D, Hintz R, Ho K, Laron Z, Sizonenko P, Sonksen PH, Tanaka T, Thorne M. Growth hormone deficiency in adulthood and the effects of growth hormone replacement: a review. Growth Hormone Research Society Scientific Committee. J Clin Endocrinol Metab 1998;83:382-395
  52. Bulow B, Hagmar L, Eskilsson J, Erfurth EM. Hypopituitary females have a high incidence of cardiovascular morbidity and an increased prevalence of cardiovascular risk factors. J Clin Endocrinol Metab 2000;85:574-584
  53. Rosen T, Wilhelmsen L, Landin-Wilhelmsen K, Lappas G, Bengtsson BA. Increased fracture frequency in adult patients with hypopituitarism and GH deficiency. Eur J Endocrinol 1997;137:240-245
  54. Maghnie M, Cosi G, Genovese E, Manca-Bitti ML, Cohen A, Zecca S, Tinelli C, Gallucci M, Bernasconi S, Boscherini B, Severi F, Arico M. Central diabetes insipidus in children and young adults. N Engl J Med 2000;343:998-1007
  55. Trainer PJ, Besser GM. The Bart's Protocols. Churchill Livingstone; 1995.
  56. Leibowitz RL, Dorff TB, Tucker S, Symanowski J, Vogelzang NJ. Testosterone replacement in prostate cancer survivors with hypogonadal symptoms. BJU Int 2010;105:1397-1401
  57. SR P, A G, DE P, SR A, J F-S, TA H. A retrospective audit of the combined pituitary function test, using the insulin stress test, TRH and GnRH in a district laboratory. Clin Endocrinol (Oxf). Vol 361992:135-139.
  58. Jones SL, Trainer PJ, Perry L, Wass JA, Bessser GM, Grossman A. An audit of the insulin tolerance test in adult subjects in an acute investigation unit over one year. Clin Endocrinol (Oxf) 1994;41:123-128
  59. Hurel SJ, Thompson CJ, Watson MJ, Harris MM, Baylis PH, Kendall-Taylor P. The short Synacthen and insulin stress tests in the assessment of the hypothalamic-pituitary-adrenal axis. Clin Endocrinol (Oxf) 1996;44:141-146
  60. Littley MD, Gibson S, White A, Shalet SM. Comparison of the ACTH and cortisol responses to provocative testing with glucagon and insulin hypoglycaemia in normal subjects. Clin Endocrinol (Oxf) 1989;31:527-533
  61. Simsek Y, Karaca Z, Tanriverdi F, Unluhizarci K, Selcuklu A, Kelestimur F. A comparison of low-dose ACTH, glucagon stimulation and insulin tolerance test in patients with pituitary disorders. Clin Endocrinol (Oxf) 2015;82:45-52
  62. Hoffman DM, O'Sullivan AJ, Baxter RC, Ho KK. Diagnosis of growth-hormone deficiency in adults. Lancet 1994;343:1064-1068
  63. Consensus guidelines for the diagnosis and treatment of growth hormone (GH) deficiency in childhood and adolescence: summary statement of the GH Research Society. GH Research Society. J Clin Endocrinol Metab2000;85:3990-3993
  64. Ghigo E, Bellone J, Aimaretti G, Bellone S, Loche S, Cappa M, Bartolotta E, Dammacco F, Camanni F. Reliability of provocative tests to assess growth hormone secretory status. Study in 472 normally growing children. J Clin Endocrinol Metab 1996;81:3323-3327
  65. Valetto MR, Bellone J, Baffoni C, Savio P, Aimaretti G, Gianotti L, Arvat E, Camanni F, Ghigo E. Reproducibility of the growth hormone response to stimulation with growth hormone-releasing hormone plus arginine during lifespan. Eur J Endocrinol 1996;135:568-572
  66. Maghnie M, Cavigioli F, Tinelli C, Autelli M, Arico M, Aimaretti G, Ghigo E. GHRH plus arginine in the diagnosis of acquired GH deficiency of childhood-onset. J Clin Endocrinol Metab 2002;87:2740-2744
  67. Garcia JM, Biller BMK, Korbonits M, Popovic V, Luger A, Strasburger CJ, Chanson P, Medic-Stojanoska M, Schopohl J, Zakrzewska A, Pekic S, Bolanowski M, Swerdloff R, Wang C, Blevins T, Marcelli M, Ammer N, Sachse R, Yuen KCJ. Macimorelin as a Diagnostic Test for Adult GH Deficiency. J Clin Endocrinol Metab 2018;103:3083-3093
  68. Fenske W, Refardt J, Chifu I, Schnyder I, Winzeler B, Drummond J, Ribeiro-Oliveira A, Jr., Drescher T, Bilz S, Vogt DR, Malzahn U, Kroiss M, Christ E, Henzen C, Fischli S, Tonjes A, Mueller B, Schopohl J, Flitsch J, Brabant G, Fassnacht M, Christ-Crain M. A Copeptin-Based Approach in the Diagnosis of Diabetes Insipidus. N Engl J Med 2018;379:428-439
  69. Christ-Crain M. Diabetes Insipidus: New Concepts for Diagnosis. Neuroendocrinology 2020;110:859-867
  70. Fleseriu M, Hashim IA, Karavitaki N, Melmed S, Murad MH, Salvatori R, Samuels MH. Hormonal Replacement in Hypopituitarism in Adults: An Endocrine Society Clinical Practice Guideline. J Clin Endocrinol Metab 2016;101:3888-3921
  71. Groves RW, Toms GC, Houghton BJ, Monson JP. Corticosteroid replacement therapy: twice or thrice daily? J R Soc Med 1988;81:514-516
  72. Bleicken B, Hahner S, Loeffler M, Ventz M, Decker O, Allolio B, Quinkler M. Influence of hydrocortisone dosage scheme on health-related quality of life in patients with adrenal insufficiency. Clin Endocrinol (Oxf) 2010;72:297-304
  73. Peacey SR, Guo CY, Robinson AM, Price A, Giles MA, Eastell R, Weetman AP. Glucocorticoid replacement therapy: are patients over treated and does it matter? Clin Endocrinol (Oxf) 1997;46:255-261
  74. Swords FM, Drake WM, Carroll PV, Monson JP. Hormonal therapy for hypopituitarism. Encyclopaedia of Endocrine Disease. Vol 22004:662-671.
  75. Newell-Price J, Whiteman M, Rostami-Hodjegan A, Darzy K, Shalet S, Tucker GT, Ross RJ. Modified-release hydrocortisone for circadian therapy: a proof-of-principle study in dexamethasone-suppressed normal volunteers. Clin Endocrinol (Oxf) 2008;68:130-135
  76. Debono M, Ghobadi C, Rostami-Hodjegan A, Huatan H, Campbell MJ, Newell-Price J, Darzy K, Merke DP, Arlt W, Ross RJ. Modified-release hydrocortisone to provide circadian cortisol profiles. J Clin Endocrinol Metab 2009;94:1548-1554
  77. Verma S, Vanryzin C, Sinaii N, Kim MS, Nieman LK, Ravindran S, Calis KA, Arlt W, Ross RJ, Merke DP. A pharmacokinetic and pharmacodynamic study of delayed- and extended-release hydrocortisone (Chronocort) vs. conventional hydrocortisone (Cortef) in the treatment of congenital adrenal hyperplasia. Clin Endocrinol (Oxf) 2010;72:441-447
  78. Johannsson G, Nilsson AG, Bergthorsdottir R, Burman P, Dahlqvist P, Ekman B, Engstrom BE, Olsson T, Ragnarsson O, Ryberg M, Wahlberg J, Biller BM, Monson JP, Stewart PM, Lennernas H, Skrtic S. Improved cortisol exposure-time profile and outcome in patients with adrenal insufficiency: a prospective randomized trial of a novel hydrocortisone dual-release formulation. J Clin Endocrinol Metab 2012;97:473-481
  79. Porter J, Withe M, Ross RJ. Immediate-release granule formulation of hydrocortisone, Alkindi(R), for treatment of paediatric adrenal insufficiency (Infacort development programme). Expert Rev Endocrinol Metab 2018;13:119-124
  80. Oksnes M, Bjornsdottir S, Isaksson M, Methlie P, Carlsen S, Nilsen RM, Broman JE, Triebner K, Kampe O, Hulting AL, Bensing S, Husebye ES, Lovas K. Continuous subcutaneous hydrocortisone infusion versus oral hydrocortisone replacement for treatment of addison's disease: a randomized clinical trial. J Clin Endocrinol Metab 2014;99:1665-1674
  81. Ho W, Druce M. Quality of life in patients with adrenal disease: A systematic review. Clin Endocrinol (Oxf) 2018;89:119-128
  82. Johannsson G, Burman P, Wiren L, Engstrom BE, Nilsson AG, Ottosson M, Jonsson B, Bengtsson BA, Karlsson FA. Low dose dehydroepiandrosterone affects behavior in hypopituitary androgen-deficient women: a placebo-controlled trial. J Clin Endocrinol Metab 2002;87:2046-2052
  83. Brooke AM, Kalingag LA, Miraki-Moud F, Camacho-Hubner C, Maher KT, Walker DM, Hinson JP, Monson JP. Dehydroepiandrosterone improves psychological well-being in male and female hypopituitary patients on maintenance growth hormone replacement. J Clin Endocrinol Metab 2006;91:3773-3779
  84. Brooke AM, Kalingag LA, Miraki-Moud F, Camacho-Hubner C, Maher KT, Walker DM, Hinson JP, Monson JP. Dehydroepiandrosterone (DHEA) replacement reduces growth hormone (GH) dose requirement in female hypopituitary patients on GH replacement. Clin Endocrinol (Oxf) 2006;65:673-680
  85. Evered D, Young ET, Ormston BJ, Menzies R, Smith PA, Hall R. Treatment of hypothyroidism: a reappraisal of thyroxine therapy. Br Med J 1973;3:131-134
  86. Gullo D, Latina A, Frasca F, Le Moli R, Pellegriti G, Vigneri R. Levothyroxine monotherapy cannot guarantee euthyroidism in all athyreotic patients. PLoS One 2011;6:e22552
  87. Agha A, Walker D, Perry L, Drake WM, Chew SL, Jenkins PJ, Grossman AB, Monson JP. Unmasking of central hypothyroidism following growth hormone replacement in adult hypopituitary patients. Clin Endocrinol (Oxf) 2007;66:72-77
  88. Martins MR, Doin FC, Komatsu WR, Barros-Neto TL, Moises VA, Abucham J. Growth hormone replacement improves thyroxine biological effects: implications for management of central hypothyroidism. J Clin Endocrinol Metab 2007;92:4144-4153
  89. Losa M, Scavini M, Gatti E, Rossini A, Madaschi S, Formenti I, Caumo A, Stidley CA, Lanzi R. Long-term effects of growth hormone replacement therapy on thyroid function in adults with growth hormone deficiency. Thyroid 2008;18:1249-1254
  90. Gammage M, Franklyn J. Hypothyroidism, thyroxine treatment, and the heart. Heart 1997;77:189-190
  91. Shufelt CL, Manson JE. Menopausal Hormone Therapy and Cardiovascular Disease: The Role of Formulation, Dose, and Route of Delivery. J Clin Endocrinol Metab 2021;106:1245-1254
  92. Mehta J, Kling JM, Manson JE. Risks, Benefits, and Treatment Modalities of Menopausal Hormone Therapy: Current Concepts. Front Endocrinol (Lausanne) 2021;12:564781
  93. Wierman ME, Arlt W, Basson R, Davis SR, Miller KK, Murad MH, Rosner W, Santoro N. Androgen therapy in women: a reappraisal: an Endocrine Society clinical practice guideline. J Clin Endocrinol Metab 2014;99:3489-3510
  94. Bhasin S, Storer TW, Berman N, Yarasheski KE, Clevenger B, Phillips J, Lee WP, Bunnell TJ, Casaburi R. Testosterone replacement increases fat-free mass and muscle size in hypogonadal men. J Clin Endocrinol Metab 1997;82:407-413
  95. Harle L, Basaria S, Dobs AS. Nebido: a long-acting injectable testosterone for the treatment of male hypogonadism. Expert Opin Pharmacother 2005;6:1751-1759
  96. Handelsman DJ, Conway AJ, Boylan LM. Pharmacokinetics and pharmacodynamics of testosterone pellets in man. J Clin Endocrinol Metab 1990;71:216-222
  97. Arver S, Dobs AS, Meikle AW, Caramelli KE, Rajaram L, Sanders SW, Mazer NA. Long-term efficacy and safety of a permeation-enhanced testosterone transdermal system in hypogonadal men. Clin Endocrinol (Oxf) 1997;47:727-737
  98. Swerdloff RS, Wang C, Cunningham G, Dobs A, Iranmanesh A, Matsumoto AM, Snyder PJ, Weber T, Longstreth J, Berman N. Long-term pharmacokinetics of transdermal testosterone gel in hypogonadal men. J Clin Endocrinol Metab 2000;85:4500-4510
  99. Korbonits M, Slawik M, Cullen D, Ross RJ, Stalla G, Schneider H, Reincke M, Bouloux PM, Grossman AB. A comparison of a novel testosterone bioadhesive buccal system, striant, with a testosterone adhesive patch in hypogonadal males. J Clin Endocrinol Metab 2004;89:2039-2043
  100. Bhasin S, Cunningham GR, Hayes FJ, Matsumoto AM, Snyder PJ, Swerdloff RS, Montori VM. Testosterone therapy in adult men with androgen deficiency syndromes: an endocrine society clinical practice guideline. J Clin Endocrinol Metab 2006;91:1995-2010
  101. Landau D, Tsakok T, Aylwin S, Hughes S. Should testosterone replacement be offered to hypogonadal men treated previously for prostatic carcinoma? Clin Endocrinol (Oxf) 2012;76:179-181
  102. Odeh M, Oliven A. Coma and seizures due to severe hyponatremia and water intoxication in an adult with intranasal desmopressin therapy for nocturnal enuresis. J Clin Pharmacol 2001;41:582-584
  103. Levy M, Prentice M, Wass J. Diabetes insipidus. BMJ 2019;364:l321
  104. Ebrahimi F, Kutz A, Wagner U, Illigens B, Siepmann T, Schuetz P, Christ-Crain M, Mueller B, Christ ER. Excess Mortality Among Hospitalized Patients With Hypopituitarism-A Population-Based, Matched-Cohort Study. J Clin Endocrinol Metab 2020;105


The Neurohypophysis: Endocrinology of Vasopressin and Oxytocin

ABSTRACT


The neurohypophysis is the structural foundation of a neuro-humoral system coordinating fluid balance and reproductive function through the action of two peptide hormones: vasopressin and oxytocin. Vasopressin is the principle endocrine regulator of renal water excretion, facilitating adaptive physiological responses to maintain plasma volume and plasma osmolality. Oxytocin is important in parturition and lactation. Data support a wider role for both peptides in the neuro-regulation of complex behavior. Clinically, deficits in the production or action of vasopressin manifest as diabetes insipidus. An understanding of the physiology and pathophysiology of vasopressin is also critical in approaching the diagnosis and management of hyponatremia, the most common electrolyte disturbance in clinical practice. This chapter explores the anatomy, physiology, and pathophysiology of the neurohypophysis, vasopressin and oxytocin: highlighting developments in the neural basis of osmo-sensing; the mechanism of action of vasopressin and oxytocin; together with a description of the cell and molecular biology underpinning some of the disease processes in which both the structure and functions of the two hormones are involved.


INTRODUCTION


The neurohypophysis consists of three parts: the supraoptic and paraventricular nuclei of the hypothalamus; the supraoptico-hypophyseal tract; and the posterior pituitary. The neurohypophysis is one component of a complex neurohumoral system coordinating physiological responses to changes in both the internal and external environment. This chapter will concentrate on the physiology and pathophysiology of two hormones made by the hypothalamus and posterior pituitary, vasopressin (AVP) and oxytocin (OT). These hormones have key roles in water balance and reproductive function.


ANATOMY, CELL BIOLOGY AND PHYSIOLOGY OF THE OF THE HYPOTHALAMO-POSTERIOR PITUITARY AXIS


Anatomy Of the Neurohypophysis


The posterior pituitary is derived from the forebrain during development and is composed predominantly of neural tissue. It lies below the hypothalamus, with which it forms a structural and functional unit: the neurohypophysis. The supraoptic nucleus (SON) is situated along the proximal part of the optic tract. It consists of the cell bodies of discrete vasopressinergic and oxytotic magnocellular neurons projecting to the posterior pituitary along the supraoptico-hypophyseal tract. The paraventricular nucleus (PVN) also contains discrete vasopressinergic and oxytotic magnocellular neurons, also projecting to the posterior pituitary along the supraoptico-hypophyseal tract. The PVN contains additional, smaller parvocellular neurons that project to the median eminence and additional extra-hypothalamic areas including forebrain, brain stem, and spinal cord. Some of these parvocellular neurons are vasopressinergic. A group of those projecting via the median eminence co-secrete VP and corticotrophin releasing hormone (CRH), and terminate in the hypophyseal-portal bed of the anterior pituitary. These and other vasopressinergic parvocellular neurons terminating in the hypophyseal-portal bed have a role in the regulation of adrenocorticotrophin (ACTH) release from the anterior pituitary gland, acting synergistically with CRH produced by other hypothalamic neurons. A schematic overview of the anatomy of the neurohypophysis and its major connections is shown in Figure 1.


Figure 1. Schematic representation of the anatomy of the neurohypophysis, and its major afferent and efferent connections.


The posterior pituitary receives an arterial blood supply from the inferior hypophyseal artery and the artery of the trabecula (a branch of the superior hypophyseal artery), derivatives of the internal carotid artery and its branches. The SON and PVN receive an arterial supply from the supra-hypophyseal, anterior communicating, anterior cerebral, posterior communicating and posterior cerebral arteries, all derived from the circle of Willis. Venous drainage of the neurohypophysis is via the dural, cavernous, and inferior petrosal sinuses.


Molecular-Cell Biology of Vasopressin and Oxytocin


AVP is a 9 amino acid peptide with a disulphide bridge between the cysteine residues at positions 1 and 6 (Figure 2). Most mammals have the amino-acid arginine at position 8, though in the Pig family arginine is substituted by lysine. The structure of OT differs from that of AVP by only 2 amino acids: isoleucine for phenylalanine at position 3; and leucine for arginine at position 8. Non-mammalian species have a variety of peptides very similar to AVP and OT, suggesting they derive from a common ancestral gene.


Figure 2. The structural and chemical characteristics of Vasopressin and Oxytocin. The cyclical peptides differ in only 2 amino acid positions. Both contain disulphide bridges between Cysteine residues at positions 1 and 6


THE VASOPRESSIN-NEUROPHYSIN AND OXYTOCIN-EUROPHYSIN GENES


The genes encoding AVP and OT are in a head-to-head tandem array on chromosome 20p13 in Man, separated by 12 Kb of DNA. Each has 3 exons, and encodes a polypeptide precursor with a modular structure: an amino-terminal signal peptide; the AVP or OT peptide; a hormone-specific mid-molecule peptide termed a neurophysin (NPI and NPII for OT and AVP respectively); and a carboxyl-terminal peptide known as copeptin (Figure 3). There is considerable homology between the NP sequences of the AVP-NP and OT-NP genes, positions 10-74 of the NP sequences being highly conserved at the amino acid level.


Figure 3. Structural organization of the Vasopressin-neurophysin II gene, and processing of its product. The AVP-NPII gene has 3 exons. Translation of the mRNA yields a larger preprohormone precursor, subsequently modified through substantial post-translational modification. The OT gene has a similar structure, and its product undergoes similar processing and post-translational modification. AVP: Vasopressin. NPII: Neurophysin II. OsRE: osmo-sensitive response element. GRE: glucocorticoid response element. ERE: estrogen response element. AP1-RE: AP1 response element.


Regulatory control of AVP gene expression is mediated through positive and negative elements in the proximal promoter. Several transcription factors bind to these elements. AP1, AP2 and CREB stimulate AVP gene expression. The glucocorticoid receptor (GR) represses expression (1, 2). The human, rat and mouse OT promoters contain half estrogen-response elements, and IL-6 response elements (3). The inter-genic region between the AVP and OT genes contains regulatory elements responsible for selective expression. The region -288 to -116 5′ upstream of the AVP gene promoter confers cell-type (magnocellular neuron) specific expression of the AVP gene (4). AVP gene expression can also be regulated at a post-transcriptional level. The length of the poly (A) tail of AVP mRNA increases in response to water deprivation, influencing mRNA stability (4). AVP mRNA also contains a dendritic localization sequence (DLS). Interaction of the DLS with a multifunctional poly(A) binding protein (PABP) may play key role in RNA stabilization, initiation of translation and translational silencing (5).


Synthesis And Release of Vasopressin and Oxytocin


Synthesis of the AVP and OT precursors occurs in the cell bodies of discrete vasopressinergic and oxytotic magnocellular neurosecretory neurons within the supraoptic (SON) and paraventricular (PVN) nuclei of the hypothalamus. Generation of the mature hormone entails post-translational modification of the large primary precursor (Figure 4). Following ribosomal translation of the respective mRNA, the carboxyl terminal domain of the precursor is glycosylated, and the product packaged in vesicles of the regulated secretory pathway. These migrate along the axons of the magnocellular neurons, during which the precursor is cleaved by basic endopeptidases into the mature hormone and the associated NP and copeptin. These are stored in secretory granules within the terminals of the magnocellular neurons in the posterior pituitary. Increased firing frequency of vasopressinergic and oxytotic neurons opens voltage-gated Ca2+ channels in these nerve terminals. This, in turn, leads to transient Ca2+ influx, fusion of the neurosecretory granules with the nerve terminal membrane, and release of the hormone and its NP and copeptin into the systemic circulation in equimolar quantities. NPs act as carrier proteins for AVP and OT during axonal migration, and appear to serve no other function. The function of copeptin remains unclear to date, it has been postulated to play a role as a prolactin-releasing factor, but never confirmed (6, 7). Another role as a chaperone-like molecule involved in the folding of the AVP precursor has been speculated (8) .In addition, it was reported to interact with the calnexin–calreticulin system (9), which prevents the export of misfolded, glucose-tagged proteins from the endoplasmic reticulum.


Figure 4. Schematic overview of the post-translational processing of the AVP-NP II gene product. Sequential modification of 164 amino-acid AVP-NPII preprohormone in endoplasmic reticulum and golgi lead to trafficking through the regulated secretory pathway and ultimately release from neurosecretory vesicles in the posterior pituitary. AVP-NPII precursor is complexed as tetramers or high oligomers during processing. A small amount of partially processed precursor is released through the constitutive secretory pathway. OT is processed in a similar manner.


AVP and OT circulate unbound to plasma proteins, though AVP does bind to specific receptors on platelets. AVP concentrations in platelet-rich plasma are 5-fold higher than in platelet-depleted plasma (10). AVP and OT have short circulating half-lives of 5-15 minutes. Several endothelial and circulating endo- and amino-peptidases degrade the peptides. A specific placental cysteine amino-peptidase degrades AVP and OT rapidly during pregnancy and the peri-partum period.


The Physiology of The Secretion of Vasopressin and Thirst


AVP is a key component in the regulation of fluid and electrolyte balance, through direct effects on renal water handling. However, the physiology of AVP has a wider context, encompassing roles in the integrated response to changes in cardiovascular status.


VASOPRESSIN RECEPTORS


There are three distinct AVP receptor (V-R) subtypes (Table 1). All have seven transmembrane spanning domains, and all are G protein coupled. They are encoded by different genes and differ in tissue distribution, down-stream signal transduction and function. The human V2-R gene maps to Xq28. Interestingly, the V2-R is up regulated by its ligand (11).


Table 1. Vasopressin Receptor Subtypes


Vasopressin receptor


V1a

V1b

V2

Expression

Vascular smooth muscle

Liver

Platelets

CNS

Pituitary corticotroph

Basolateral membrane of distal nephron

Amino acid structure

418 amino acids (human)

424 amino acids (human)

370 amino acids (human)

Second messenger system

Gq/11mediated phospholipase C activation: Ca2+, inositol triphosphate & diacyl glycerol mobilization

As V1a

Gs mediated adenylate cyclase activation: cAMP production & protein kinase A stimulation

Physiological effects

●Smooth muscle contraction

●Stimulation of glycogenolysis.

●Enhanced platelet adhesion ●Neurotransmitter & neuromodulatory function

Enhanced ACTH release

Increased synthesis & assembly of aquaporin-2


VASOPRESSIN AND RENAL WATER HANDLING  


Although AVP has multiple actions, its principle physiological effect is in the regulation of water resorption in the distal nephron, the structure and transport processes of which allow the kidney to both concentrate and dilute urine in response to the prevailing circulating AVP concentration. Active transport of solute out of the thick ascending loop of Henle generates an osmolar gradient in the renal interstitium, which increases from renal cortex to inner medulla, a gradient through which distal parts of the nephron pass end route to the collecting system. AVP stimulates the expression of a specific water channel protein (aquaporin) on the luminal surface of the interstitial cells lining the collecting duct. The presence of aquaporin (AQP) in the wall of the distal nephron allows resorption of water from the duct lumen along an osmotic gradient, and excretion of concentrated urine. To date, 13 different AQPs have been identified in Man, seven of which (AQP1-4, AQP6-8) are found in the kidney. AQPs act as passive pores for small substrates and are divided into 2 families: the water only channels; and the aquaglyceroporins that can conduct other small molecules such as glycerol and urea. Most substrates are neutral. However, this is not always the case. For example, AQP6 is a gated ion channel. AQPs are involved in a variety of cell processes: small molecule permeation; gas conduction and cell-cell interaction. As with other membrane channels, specific structural arrangements within the primary, secondary, and tertiary structure convey the three functional characteristics of permeation, selectivity, and gating. The structure of AQPs involves 2 tandem repeats, each formed from 3 transmembrane domains, together with 2 highly conserved loops containing the signature motif asparagine-proline-alanine (NPA). All AQPs form homotetramers in the membrane, providing 4 functionally independent pores with an additional central pore formed between the 4 monomers. Water can pass through all the 4 independent channels of water-permeable AQPs. There are data to suggest that the central pore may act as independent channel in some AQPs (12-14). AQP1 is constitutively expressed in the apical and basolateral membranes of the proximal tubule and descending loop of Henle, where it facilitates isotonic fluid movement. Loss of function mutations of AQP1 in man lead to defective renal water conservation (15). AQP2 is expressed on the luminal surface of collecting duct cells and is the water channel responsible for AVP-dependent water transport from the lumen of the nephron into the collecting duct cells. V2-R activation in collecting duct cells produces a biphasic increase in expression of AQP2. Ligand-receptor binding triggers an intracellular phosphorylation cascade ultimately resulting in phosphorylation of the nuclear transcription factor CREB and expression of c-Fos. In turn, these transcription factors stimulate AQP2 gene expression through CRE and AP-1 elements in the AQP2 gene promoter. In addition, AVP stimulates an immediate increase in AQP2 expression by accelerating trafficking and assembly of pre-synthesized protein into functional, homo-tetrameric water channels.


Maximum diuresis occurs at plasma AVP concentrations of 0.5 pmol/l or less. As AVP levels rise, there is a sigmoid relationship between plasma AVP concentration and urine osmolality, with maximum urine concentration achieved at plasma AVP concentrations of 3-4 pmol/L (Figure 5). Following persistent AVP secretion, antidiuresis may diminish. Down-regulation of both V2-R function and AQP2 expression may be responsible for this escape phenomenon.


Figure 5. The relationship of plasma AVP concentration to urine osmolality. Shaded area represents range of normal; single line indicates representative individual. AVP has additional effects at other sites in the nephron: decreasing medullary blood flow; stimulating active urea transport in the distal collecting duct; and stimulating active sodium transport into the renal interstitium. AVP up-regulates the bumetanide-sensitive sodium-potassium-chloride cotransporter (SLC12A1) in the thick ascending loop of Henle through both a rapid acceleration of post-translational processing/trafficking and an increase in SCLC12A1 gene expression. Together, these contribute to the generation and maintenance of a hypertonic medullary interstitium, and augment AVP-dependent water resorption (16).


REGULATION OF VASOPRESSIN RELEASE


Osmoregulation of Vasopressin


Plasma osmolality is the most important determinant of AVP secretion. The osmoregulatory systems for thirst and AVP secretion, and in turn the actions of AVP on renal water excretion, maintain plasma osmolality within narrow limits of 284 to 295 mOsmol/kg. The relationship between plasma osmolality and plasma AVP concentration has 3 characteristics.


  • The osmotic threshold or 'set point' for AVP release.
  • The shape of the line describing changes in plasma AVP concentration with changing plasma osmolality
  • The sensitivity of the osmoregulatory mechanism coupling plasma osmolality and AVP release.


Increases in plasma osmolality increase plasma AVP concentrations in a linear manner (Figure 6). The abscissal intercept of this line indicates the mean 'osmotic threshold' for AVP release (284 mOsmol/kg): the mean plasma osmolality above which plasma AVP increases in response to increases in plasma osmolality. AVP levels increase from a basal rate through activation of stimulatory osmoreceptor afferents, and decrease to minimal values when this drive is removed and synergistic inhibitory afferents are activated. The slope of the line relating plasma osmolality to plasma AVP concentration reflects the sensitivity of osmoregulated AVP release. There are considerable inter-individual variations in both the threshold and sensitivity of AVP release. However, they are remarkably reproducible within an individual over time (17).


Figure 6. The relationship of plasma AVP concentration to changes in plasma osmolality during controlled hypertonic stimulation. AVP concentration determined during progressive hypertonicity induced by infusion of 855 mmol/l saline in a group of healthy adults. Increases in plasma osmolality increase plasma AVP concentrations in a linear manner, defined by the function, plasma AVP = 0.43 (plasma osmolality - 284), r = +0.96. The abscissal intercept of this regression line indicates the mean 'osmotic threshold' for AVP release: the mean plasma osmolality above which plasma AVP starts to increase. The shaded area represents the range of normal response. LD represents the limit of detection of the assay, 0.3 pmol/l.


There are situations where the normal relationship between plasma osmolality and AVP concentration breaks down:


  • Rapid changes of plasma osmolality: rapid increases in plasma osmolality result in exaggerated AVP release.
  • During the act of drinking: drinking rapidly suppresses AVP release, through afferent pathways originating in the oropharynx.
  • Pregnancy: the osmotic threshold for AVP release is lowered in pregnancy.
  • Whether aging is accompanied by changes in AVP concentrations is controversial.


As befits its major function and physiological role, AVP production by the neurohypophysis is influenced by sensory signals reflecting osmotic status and blood pressure/circulating volume. The relationships of the SON and PVN with the autonomic afferents and central nervous system nuclei responsible for osmo- and baroregulation are key to the physiological regulation of AVP. Functional osmoreceptors are situated in anterior circumventricular structures: the subfornicular organ (SFO), and the organum vasculosum of the lamina terminalis (OVLT). Local fenestrations in the blood brain barrier at these sites allow neural tissue direct contact with the circulation. Subsequent sensory input to the SON and PVN is via glutaminergic afferents. Moreover, these neurons integrate osmolar status with additional endocrine signals reflecting circulating volume status through the action of angiotensin II (A-II), relaxin, and atrial natriuretic peptide (ANP). A-II and relaxin excite both OT and AVP magnocellular neurons. In contrast, ANP inhibits AVP neuron activity. AVP neurons themselves have independent osmo-sensing properties and V-Rs are present on vasopressinergic neurons of both the PVN and SON, highlighting the potential for auto-control of AVP release through direct osmoregulation and short loop feedback (18). AVP magnocellular neurons in the SON and PVN co-express the peptide Apelin and its G-protein coupled receptor. A ‘yin and yang’ relationship has been proposed between AVP and these 36 amino-acid peptides (and indeed it’s shorter active derivatives Apelin-17 and Apelin-13). Intra-cerebroventricular injection of Apelin-17 inhibits the phasic firing of AVP magnocellular neurons, reducing AVP release and stimulating aquaresis. Hypertonic stress and water loading have reciprocal effects on plasma AVP and Apelin concentrations. Apelin receptors are also co-expressed in AVP target cells in the renal collecting duct. AVP and Apelin are thus regulated in opposite directions to maintain volume and osmolar homeostasis (19-22).


Changes in the osmotic environment of osmo-sensitive neurons in the OVLT, SFO and vasopressinergic neurons of the SON and PVN result in altered cell volume. These physical changes alter the activity of the stretch-sensitive cationic channel TRPV1, expressed on the cell surface of these neurons. TRPVI thus acts as the transduction mechanism linking changes in osmolality to altered membrane potential and firing frequency. Osmoregulatory function is not lost in Trpv1−/−mice, indicating additional osmo-sensing pathways must be in operation (23).


A related, but distinct osmo-sensory input feeds additional data on peripheral osmolar status to the neurohypophysis. Hepatic portal blood vessels contain sensory neurons responsive to changes in the osmolality of peripheral blood. In contrast to central mechanisms, the key transducing element of the peripheral process is the stretch-sensitive ion channel, TRPV4. Plasma osmolality is frequently elevated in patients after liver transplant in which the donor organ is denervated, demonstrating the function of this peripheral pathway (24).


Osmosensitivity of AVP release is influenced by circadian rhythms. AVP release increases during sleep. This effect is mediated by clock neurons projecting from the suprachismatic nucleus, increasing the activity of osmosensory afferent input to the SON (25).


Baroregulation of Vasopressin


Reductions in circulating volume stimulate AVP release. Falls in arterial blood pressure of 5 to 10 per cent are necessary to increase circulating AVP concentrations in man. Progressive reduction in blood pressure produces an exponential increase in plasma AVP, in contrast to the linear increases of osmoregulated AVP release. Baroregulatory influences on neurohypophyseal AVP release derive from aortic arch, carotid sinus, cardiac atrial, and great vein stretch-sensitive afferents via cranial nerves IX and X. Ascending projections are via the nucleus tractus solitarius (NTS) in the brain stem. From the NTS, further afferents project to the SON and PVN, which also receive additional adrenergic afferents from other brain stem nuclei involved in cardiovascular control, such as the locus coeruleus. These nuclei integrate a number of afferent inputs that reflect volume status. Ascending baroregulatory pathways must affect some tonic inhibition of AVP release, as interruption increases plasma AVP levels (26, 27). Osmoregulated AVP responses can be modified by factors triggered as part of the coordinated neurohumoral response to changes in circulating volume and blood pressure. A-II amplifies the proportional relationship between osmolality and action potential firing in the SON. The peptide produces this effect through polymerization of intracellular actin filaments, resulting in altered cell shape, a mechanism that is synergistic with those mediating responses to changes in extracellular osmolality. A-II thus enhances osmosensitivity. This mechanism underpins the changes in osmo-regulated AVP release in hypo- and hypervolemia: the osmotic threshold and sensitivity of AVP release is lowered by hypovolemia; while the converse is found in hypervolemia and hypertension (19).


Additional Mechanisms Regulating Vasopressin Release


A number of other stimuli influence AVP release independent of osmotic and hemodynamic status.


  • Nausea and emesis
  • Unspecific stress
  • Pain
  • Manipulation of abdominal contents
  • Immune-response mediators and inflammatory triggers


These stimuli contribute to high plasma AVP values observed in acute illness and after surgery.


ADDITIONAL EFFECTS OF VASOPRESSIN


Cardiovascular Effects


AVP is a potent pressor agent; its effects mediated through a specific receptor (V1-R) expressed by vascular smooth muscle cells. Though systemic effects on arterial blood pressure are only apparent at high concentrations, AVP is important in maintaining blood pressure in mild volume depletion. The most striking vascular effects of AVP are in the regulation of regional blood flow. The sensitivity of vascular smooth muscle to the pressor effects of AVP varies according to the vascular bed. Vasoconstriction of splanchnic, hepatic and renal vessels occur at AVP concentrations close to the physiological range. Furthermore, there are differential pressor responses within a given vascular bed. Selective effects on intrarenal vessels lead to redistribution of renal blood flow from medulla to cortex. Baroregulated AVP release thus constitutes one of the key physiological mediators of an integrated hemodynamic response to volume depletion.4.2.


Effects on the Pituitary


AVP is an ACTH secretagogue, acting through pituitary corticotroph-specific V1b-Rs. Though the effect is weak in isolation, AVP and CRF act synergistically. AVP and CRF co-localize in neurohypophyseal parvocellular neurons projecting to the median eminence and the neurohypophyseal portal blood supply of the anterior pituitary. Levels of both AVP and CRF in these neurons are inversely related to glucocorticoid levels, consistent with a role in feedback regulation.


Effects of AVP on Regulation of Bone Mass


AVP exerts its action both on osteoblasts and osteoclasts thru AVPR1 and AVPR2 receptors (28). Mice studies showed that AVP upregulates osteoclast differentiation genes and inhibits osteoblast formation. Mice rendered deficient in AVPr1a (Avpr1a-/-) have a high bone mass, and they show an increase in osteoblastogenesis after additional inhibition of AVPR2 (29) .


The AVP effect is opposed by oxytocin, which stimulates osteoblast formation and inhibits mature osteoclast activation. Mice studies showed that both haploinsufficiency for oxytocin and deletion of the oxytocin receptor (Oxr-/-) result in osteopenia (30). The role of both hormones in the regulation of skeletal physiology remains to be further explored (31).


Behavioral Effects of Vasopressin


Vasopressinergic fibers and V-Rs are present in CNS neural networks anatomically and functionally independent of the neurohypophysis, including the cerebral cortex and limbic system. An increasing amount of data highlight the role of central vasopressinergic systems in mediating complex social behavior. Data in Man link V1a-R gene sequence variation with a range of normal and abnormal behavior patterns, including gender dimorphic behavior. Dysregulation of central AVP action may be a distal end point in complex conditions characterized by altered social and emotional behavior (32, 33).


Thirst


Renal free water clearance can be reduced to a minimum by the antidiuretic actions of vasopressin, but water loss is not completely eliminated, and insensible water loss from respiration and sweating is a continuous process. To maintain water homeostasis, water must also be consumed to replace the obligate urinary and insensible fluid losses. This is regulated by thirst. Thirst and drinking are key processes in the maintenance of fluid and electrolyte balance. Thirst perception and the regulation of water ingestion involve complex, integrated neural and neurohumoral pathways. As with those mediating AVP release, the osmoreceptors regulating thirst are situated in the OVLT, effectively outside the blood-brain barrier and distinct from those mediating AVP release. Neural activity in and around the OVLT remains active in hyperosmolar states following immediate satiety of thirst, indicating that other centers must be involved in thirst perception. The anterior cingulate cortex and insular cortex receive input from osmo-sensitive afferents and have been implicated as key higher centers in thirst pathways (20). There is a linear relationship between thirst and plasma osmolalities in the physiological range. The mean osmotic threshold for thirst perception is 281 mOsm/kg, similar to that for AVP release. Thirst occurs when plasma osmolality rises above this threshold. As with osmoregulated AVP release, the characteristics of osmoregulated thirst remain consistent within an individual on repeated testing, despite wide inter-individual variation.


As with AVP release, there are also specific physiological situations in which the relationship between plasma osmolality and thirst breaks down.


  • The act of drinking: reduces osmotically stimulated thirst.
  • Extracellular volume depletion: this stimulates thirst through volume-sensitive cardiac afferents and the generation of circulating and intra-cerebral A-II, a powerful dipsogen.
  • Pregnancy, the luteal phase of the menstrual cycle and super ovulation syndrome: these states reduce the osmolar threshold for thirst.
  • Aging: both thirst appreciation and fluid intake can be blunted in the elderly


The act of drinking reduces thirst perception before any change in plasma osmolality. This effect is produced through three mechanisms: oropharyngeal sensory afferents; gastro-intestinal stretch-sensitive afferents; and peripheral osmoreceptors in the hepatic portal vein. Recent data have highlighted how thirst-promoting neurons in the SFO integrate sensory inputs from the oropharynx (drinking and food composition) with central osmolar status to influence thirst perception. This complex mechanism effectively explains anticipatory changes in water consumption that precede changes in plasma osmolality (34). As with AVP release, hypovolemia resets the relationship between plasma osmolality and thirst. A-II is one of the key mediators of this physiological response. Peripheral A-II generation can act on central osmoreceptors, to increase both thirst and AVP release. An independent, intra-cerebral A-II system is activated in parallel. A-II is a powerful central dipsogen.


The Physiology of Oxytocin


OT binds to specific G-protein coupled cell surface receptors (OT-Rs) on target cells to mediate a variety of physiological effects, largely concerned with reproductive function. The classical physiological roles of OT are the regulation of lactation, parturition and reproductive behavior. Data from transgenic animals with targeted disruption of the oxytocin gene (and thus lacking OT) have forced a review of this dogma (35).


OXYTOCIN AND LACTATION


In the rat, stimulation of vagal sensory afferents in the nipple by the act of suckling triggers reflex synchronized firing of oxytotic magnocellular neurons in the neurohypophysis, and corresponding pulsatile OT release. OT acts on OT-Rs on smooth muscle cells lining the milk ducts of the breast, initiating milk ejection. OT is essential for completion of this milk ejection reflex in rodent. Mice lacking OT fail to transfer milk to their suckling young. This deficit is corrected by injection of OT. In contrast, women lacking posterior pituitary function can breast-feed normally, illustrating that OT is not necessary for lactation in man. Pituitary lactotrophs express OT-R mRNA, and OT released into the hypophyseal portal blood supply from the median eminence can stimulate prolactin release. However, the role of OT in the physiology of prolactin release remains unclear.


OXYTOCIN AND PARTURITION


OT is a uterotonic agent. In many mammals, there is both an increase in OT secretion and an increase in uterine responsiveness to OT during parturition (3). These data suggest a key role for the hormone in the initiation and progression of labor. Falling progesterone concentrations toward the end of pregnancy lead to up-regulation of uterine myometrial OT-Rs, enhanced contractility, and increased sensitivity to circulating OT. Stretching of the 'birth canal' during parturition leads to the stimulation of specific autonomic afferents, reflex firing of oxytotic neurons and OT release. A positive feedback loop is formed, OT stimulating uterine contraction further and enhancing the production of additional local uterotonic mediators such as prostaglandins. The difficulties of analyzing pulsatile release, and the short circulating half-life of the hormone (due to placental cysteine aminopeptidase), have made it difficult to demonstrate increased circulating OT levels in women during labor. Mice lacking OT have normal parturition. Moreover, women with absent posterior pituitary function can have a normal labor. However, the importance of OT in the birth process is highlighted by the effectiveness of OT antagonists in the management of pre-term labor (36). The role of OT in parturition is not limited to maternal responses. Maternal OT produces a switch to inhibitory GABAergic signaling in the fetal CNS. This, in turn, increases fetal neuronal resistance to damage that may occur during delivery. OT therefore mediates direct adaptive mother-fetal signaling during parturition in line with a wider-ranging role in maternal-fetal physiology (37).


OXYTOCIN AND BEHAVIOUR


OT-R expression is widespread in the CNS of many species, and OT has widespread roles as a neurotransmitter. The central oxytocinergic system and related limbic networks affect complex neural circuits of socio-emotional behavior and promote pro-social effects such as in-group favoritism and protection against social threats, interpersonal trust and attachment, empathy, and emotion recognition (38-41). In humans, brain regions such as the amygdala, hippocampus, cingulate cortex, and nucleus accumbens, which play a key role in human socio-emotional behavior, show a high density of OT-R expression. In some cases, these overlap those involving AVP (32, 33).


OT knockout (OT-KO) models have been used to identify aspects of dysfunctions in social behavior. Generally, an impairment in forming social memories and higher anxiety-related behaviors were observed (42-44). These results were substantiated by the fact that central administration of OT rescued OT-KO mice from these changes. In the context of behavior; OT facilitates both lordosis and the development of maternal behavior patterns in rat (3). However, mice lacking OT exhibit normal sexual and maternal behavior, suggesting the behavioral effects to be species-specific or the potential for considerable redundancy in neural pathways. In humans, lower endogenous OT or impaired signaling has been linked with mental disorders associated with social deficits, such as autism spectrum disorder (ASD), anxiety and depression disorder or borderline personality disorder (45-50). In these disorders, no OT deficiency per se has been proven; the evidence is largely based on observational studies with individual variations in social behavior associated with alteration in peripheral OT levels, in genes involved in OT signaling or OT-R polymorphisms (51-53). In ASD, recent data have highlighted associations with the single nucleotide polymorphisms (SNPs) rs7632287, rs237887, rs2268491 and rs2254298 (54-56). Intranasal OT has been investigated to ameliorate symptoms of these conditions. However, overall, the effect size is inconsistent, and the results of these studies are controversial. Central oxytocinergic transmission reduces anxiety behavior and hypothalamo-pituitary-adrenal stress responses in female rats. It may be that OT has a complex role in the stress response, with context-dependent differential effects. It buffers responses to social stress, reduces cortisol levels during conflict situations, improves self-representations in patients with anxiety disorder, and reduces amygdala response to emotional stimuli, consequently reducing fear reactivity and anxiety (57-63).


Only limited research has been devoted to the role of OT in patients with hypothalamic-pituitary dysfunction and focused primarily on patients with craniopharyngioma (CP). These data assume direct tumor-induced or post-surgical damage to the SON/PVN and consequent disruption of the oxytocinergic system (64-68). Results demonstrate personality changes and increased psycho-social comorbidities – including anxiety, depression, and social withdrawal (64, 69-71). This was confirmed by a systematic review showing behavioral dysfunctions in 57%, and social impairment and difficulties holding relationships in 40% (72). Interestingly, the age of onset appears to influence the type of socio-behavioral dysfunction: while adult-onset had higher levels of anxiety and depression, younger patients had more impact in the domains of social isolation. Research in patients with confirmed posterior pituitary dysfunction, i.e., CDI, demonstrated higher depression and anxiety levels, self-reported autistic traits, lower joy when socializing and worse scores on an emotional recognition task than healthy adults (73, 74).


Similar to other hormones, single basal OT levels are unreliable and insufficient in identifying a deficiency (75) with inconclusive results in patients with hypothalamic-pituitary dysfunction. Research still disagrees regarding the precise relationship between peripheral OT and centrally generated behavior. Cerebrospinal fluid (CSF) concentrations of OT are more likely to mirror the behavioral effects than plasma concentrations, and whether plasma levels may serve as a surrogate for CSF OT is controversially discussed (76, 77). Accordingly, peripheral levels of OT correlate to central levels only after stimulation but not at baseline (78). Established pituitary provocation tests do not show a consistent strong OT increase to test for a suspected deficiency (79). OT-R expression is widespread in the CNS of many species and OT has widespread roles as a neurotransmitter, including neural networks that mediate a range of complex behaviors. In some cases, these overlap those involving AVP (32, 33).


CLINICAL PROBLEMS SECONDARY TO DEFECTS IN THE HYPOTHALAMO-POSTERIOR PITUITARY AXIS


Defects in the production or action of AVP manifest as clinical problems in maintaining plasma sodium concentration and fluid balance, reflecting the key role of the hormone in these processes. A further group of related clinical conditions reflect primary defects in thirst. In some cases, the two may coincide, reflecting the close anatomical and functional relationship of both processes.


Diabetes Insipidus


CLASSIFICATION (see Figure 7)


Diabetes insipidus (DI) is characterized by production of dilute urine in excess of >50 ml/kg/24 hours in adults. DI arises through one of four mechanisms (Figure 7 and Table 2).


  • Deficiency of AVP: central diabetes insipidus (CDI). Also called Arginine Vasopressin Deficiency
  • Inappropriate, excessive water drinking: primary polydipsia.
  • Renal resistance to the antidiuretic action of AVP: nephrogenic diabetes insipidus (NDI). Also called Arginine Vasopressin Resistance
  • increased vasopressinase expression in pregnancy: Gestational diabetes insipidus

Figure 7. Different forms of hypotonic polyuria (80)


Table 2. Classification of Hypotonic Polyuria (80)

Type of hypotonic polyuria

Basic defect

Causes

Central DI

Deficiency in AVP synthesis or secretion

Acquired

·       Trauma (surgery, deceleration injury)

Neoplastic (craniopharyngioma, meningioma, germinoma, metastases)

·       Vascular (cerebral/ hypothalamic hemorrhage, infarction or ligation of anterior communicating artery aneurysm)

·       Granulomatous (histiocytosis, sarcoidosis)

·       Infectious (meningitis, encephalitis, tuberculosis)

·       Inflammatory/autoimmune (lymphocytic infundibuloneurohypophysitis, IgG4 neurohypophysitis)

·       Drug/toxin-induced

·       Osmoreceptor dysfunction (adipsic DI)

·       Others (hydrocephalus, ventricular/suprasellar cyst, trauma, degenerative disease)

·       Idiopathic

Congenital

·       Autosomal dominant: AVP gene mutation

·       Autosomal recessive: Wolfram Syndrome (DIDMOAD)

·       X-linked recessive

Primary Polydipsia

Excessive osmotically unregulated fluid intake

·       Dipsogenic (downward resetting of the thirst threshold; idiopathic or similar lesions as with central DI)

·       Psychosis intermittent hyponatremia polydipsia (PIP syndrome)

·       Compulsive water drinking

·       Health enthusiasts

Nephrogenic DI

Reduced renal sensitivity to antidiuretic effect of physiological AVP levels

Acquired

·       Drug exposure (lithium, demeclocycline, cisplatin etc.)

·       Hypercalcemia, hypokalemia

·       Infiltrating lesions (sarcoidosis, amyloidosis, multiple myeloma etc.)

·       Vascular disorders (sickle cell anemia)

·       Mechanical (polycystic kidney disease, ureteral obstruction)

Congenital

·       X-linked AVPR2 gene mutations

·       autosomal recessive or dominant AQP2 gene mutations

Gestational DI

Exaggerated enzymatic metabolism of circulating AVP hormone

Increased AVP metabolism

·       Pregnancy


Central Diabetes Insipidus (CDI) (Arginine Vasopressin Deficiency)


CDI (also known as neurogenic or cranial DI) is the result of partial or complete lack of osmoregulated AVP secretion. Plasma AVP concentrations are inappropriately low with respect to prevailing plasma osmolalities. Presentation with CDI implies destruction or loss of function of more than 80% of vasopressinergic magnocellular neurons. It is rare (estimated prevalence of 1: 25000), with an equal gender distribution. Though persistent polyuria can lead to dehydration, most patients can maintain water balance through appropriate polydipsia if given free access to water.


Most cases of CDI are acquired. Trauma (head injury or surgery) can produce CDI through damage to the hypothalamus, pituitary stalk, or posterior pituitary. Pituitary stalk trauma may lead to a triphasic disturbance in water balance, an immediate polyuric phase followed within days by a more prolonged period (up to several weeks) of antidiuresis suggestive of AVP excess. This second phase can be followed by reversion to CDI, or recovery. This characteristic 'triple response' reflects initial axonal damage; the subsequent unregulated release of large amounts of pre-synthesized AVP; and either recovery or development of permanent CDI (as determined by the magnitude of initial damage to vasopressinergic neurons). All phases of the response are not apparent in all cases.


Hypothalamic tumors (e.g., craniopharyngioma) or pituitary metastases (e.g., breast or bronchus) can present with CDI. However, primary pituitary tumors rarely cause CDI. In childhood, craniopharyngioma and germinoma/teratoma are a relatively common cause (81). 


When obvious causes are not present, most cases of CDI will be “idiopathic”. However, the possibility of an autoimmune process should be considered, as many idiopathic cases are considered to be autoimmune in origin (82). A well-recognized cause of autoimmune CDI is lymphocytic infundibulohypophysitis (83).


Familial forms are rare, but are a recognized cause of CDI in childhood. Most reported cases are expressed as autosomal dominant and the genetic defect is usually in the biologically inactive neurophysin or in the signal peptide of the pre-prohormone. Lack of normal cleavage of the signal peptide from the prohormone and abnormal folding of the vasopressin/neurophysin precursor are thought to produce fibrillar aggregations in the endoplasmic reticulum, which is cytotoxic to the neuron, explaining the dominant phenotype (84, 85). Wolfram syndrome is a rare autosomal recessive disease with diabetes insipidus, diabetes mellitus, optic atrophy, and deafness (DIDMOAD). The genetic defect is for the protein wolframin that is found in the endoplasmic reticulum and is important for folding proteins (86). Wolframin is localized to chromosome 4. It is involved in beta-cell proliferation and intracellular protein processing and calcium homeostasis, producing a wide spectrum of endocrine and central nervous system (CNS) disorders. Diabetes insipidus is usually a late manifestation and is associated with decreased magnocellular neurons in the paraventricular and supraoptic nuclei (87, 88).


Primary Polydipsia (PP)


PP is a polyuric syndrome secondary to excess fluid intake. PP can be associated with organic structural brain lesions, e.g. sarcoidosis of the hypothalamus (89) and craniopharyngioma (90). It can also be produced by drugs that cause a dry mouth or by any peripheral disorder causing an elevation of renin and/or angiotensin. However, mostly there is no identifiable pathologic etiology; in this circumstance the disorder is often associated with psychiatric syndromes. Series of patients in psychiatric hospitals have shown that as many as 42% have some form of polydipsia and for over half of those there was no obvious explanation for the polydipsia (91). It also seems to be increasingly prevalent in health conscious people who voluntarily change their drinking habits with the aim to improve their well-being, in which case it is often called habitual polydipsia (92).


Nephrogenic Diabetes Insipidus (NDI)


NDI is due to renal resistance to the antidiuretic effects of AVP. Genetic variants of NDI usually present in infancy (93). In these forms, NDI can occur as a result of mutations in the V2 receptor and mutations of the aquaporin 2 water channels. Over 90% of cases are X-linked recessive in males, and over 200 different mutations of the V2 receptor have been reported affecting all aspects of receptor function: expression; ligand binding; and G-protein coupling. Most lead to complete loss of function, though a few are associated with a mild phenotype. 10% of kindreds with familial NDI have an autosomal recessive form, with normal V2-R function. Affected individuals harbor loss of function mutations of the AQP2 gene. Most mutations occur in the region coding for the transmembrane domain of the protein. Additional rare kindreds have been described harboring a mutation in the portion of the gene encoding the carboxyl-terminal intracellular tail of AQP2. The NDI of these kindreds is inherited as an autosomal dominant trait, mutant protein sequestering the product of the wild type AQP2 allele within mixed tetramers in a dominant-negative manner.


The development of NDI in an adult is less likely to reflect a genetic cause. The commonest cause of acquired NDI in clinical practice is lithium therapy, with other causes including hypokalemia, hypercalcemia, and release of bilateral urinary tract obstruction associated with downregulation of aquaporin 2 and decreased function of vasopressin (94, 95). NDI secondary to lithium is characterized by dysregulated AQP2 expression and trafficking along the whole collecting duct as well as dysregulated expression of the amiloride-sensitive epithelial sodium channel (ENaC) in the cortical collecting duct. Lithium enters collecting duct cells through ENaC expressed on the apical cell membrane and leads to inhibition of glycogen synthase kinase type 3 (GSK-3) signaling pathways. NDI secondary to lithium toxicity can persist after drug withdrawal, and may be irreversible. Demeclocycline is another commonly recognized drug to causes NDI and is sometimes used clinically to treat SIAD. The final common pathway producing NDI in many of these cases is down-regulation of AQP2 expression (96).


Gestational Diabetes Insipidus


In normal pregnancy, physiologic adaptations include expansion of blood volume and decreased plasma osmolality and serum sodium. Thirst and increased fluid intake are commonly reported in pregnancy, but in some patients the increased thirst is driven by marked polyuria, which may point to the presence of diabetes insipidus. Two types of transient diabetes insipidus must be differentiated in pregnancy, both caused by the placental enzyme cysteine aminopeptidase, named oxytocinase, which enzymatically degrades oxytocin (97). Because of the close structural homology between AVP and oxytocin, this enzyme also metabolizes AVP. In the first type of pregnancy-associated DI, the activity of oxytocinase is abnormally elevated. This syndrome has been referred to as vasopressin resistant diabetes insipidus of pregnancy (98) and has been reported to be associated with preeclampsia, acute fatty liver, and coagulopathies. Symptoms usually develop at the end of the second or early third trimester and it is more common during multiple pregnancy (99). In the second type of pregnancy-associated DI, the accelerated metabolic clearance of vasopressin produces DI in a patient with borderline pre-existing vasopressin function from a mild nephrogenic diabetes insipidus or partial central diabetes insipidus. Vasopressin is rapidly destroyed and the neurohypophysis is unable to keep up with the increased demand. Symptoms in this second type usually appear early in pregnancy (100).


INVESTIGATIONS FOR DIAGNOSIS


Investigations have the following three aims:


  • To confirm DI
  • To classify the DI into central or nephrogenic DI or PP (or gestational DI in case of pregnancy)
  • To establish the etiology of the specific form of DI


After establishing polyuria and polydipsia, and excluding hyperglycemia, hypokalemia, hypercalcemia, and significant renal insufficiency, attention should be focused on the AVP axis.

For many years, the indirect water deprivation test was the gold standard for differential diagnosis of diabetes insipidus. This test indirectly assesses AVP activity by measurement of the urine concentration capacity during a prolonged period of dehydration, and again after a subsequent injection of an exogenous synthetic AVP variant, desmopressin. Interpretation of the test results goes back to the publication of Miller et al (101). If upon thirsting, urinary osmolality remains <300mOsm/kg and does not increase >50% after desmopressin injection, complete nephrogenic DI is diagnosed. If the urinary osmolality increase after desmopressin injection is >50%, complete central DI is diagnosed. In partial central DI and primary polydipsia, urinary concentration increases to 300–800mosm/kg, with an increase of >9% (in partial central DI) and <9% (in primary polydipsia), respectively, after desmopressin injection. However, these published criteria are based on post hoc data from only 36 patients, who had a wide overlap in their urinary osmolalities. Furthermore, the diagnostic criteria for this test are derived from a single study with post-hoc assessment (101) and have not been prospectively validated. Consequently, the indirect water deprivation test has been shown to have considerable diagnostic limitations with an overall diagnostic accuracy of 70%, and an accuracy of only 41% in patients with primary polydipsia (102).


Several reasons exist for this limited diagnostic outcome of the indirect water deprivation test. First, chronic polyuria itself can affect renal concentration capacity, through renal washout (103) (104, 105) or downregulation of AQP2 expression in the kidneys (106). This may lead to a reduced renal response to osmotic stimulation or exogenous desmopressin in different forms of chronic polyuria. Second, in patients with AVP deficiency, urine concentration can be higher than expected (107, 108), especially in those patients with impaired glomerular function, or can result from a compensatory increase in AVPR2 expression in patients with chronic central DI (109). Finally, patients with acquired nephrogenic DI are often only partially resistant to AVP, resulting in a clinical presentation that is similar to partial central DI.


To overcome these limitations, direct measurement of AVP levels has been proposed. In a study published in 1981, patients with central DI were reported to have AVP levels below a calculated normal area (defining the normal relationship between plasma osmolality and AVP levels), whereas AVP levels were above the normal area in patients with nephrogenic DI and within the normal area in patients with primary polydipsia (110). However, despite these promising initial results, direct measurement of AVP levels failed to enter routine clinical use for various reasons. First, several technical limitations of the AVP assay result in a high preanalytical instability of AVP in samples (111). Second, the accuracy of diagnoses using commercially available AVP assays has been disappointing, with correct diagnoses in only 38% of patients with DI, and particularly poor differentiation between partial central DI and primary polydipsia (102, 112). Third, an accurate definition of the normal physiological area defining the relationship between plasma AVP levels and osmolality is still lacking, especially for commercially available assays (113, 114), which is a crucial prerequisite for the identification of AVP secretion outside the normal range in patients suspected of having DI (102).


Copeptin, the C-terminal segment of the AVP prohormone, is an easy-to- measure AVP surrogate that is very stable ex vivo (111), mirroring AVP concentrations. Two studies have shown that a basal copeptin level >21.4pmol/l without prior thirsting unequivocally identifies nephrogenic DI, rendering a further water deprivation test unnecessary in these patients (102, 115). For the differentiation between patients with primary polydipsia and central DI, results of a study including 144 patients (116) showed that an osmotically stimulated copeptin level >4.9pmol/l after infusion of 3% saline (aiming at a sodium level >150mmol/l) had an overall diagnostic accuracy of 96.5% (93.2% sensitivity and 100% specificity) in distinguishing between patients with primary polydipsia and those with central DI. The classic water deprivation test had an overall diagnostic accuracy of only 76.5%. Importantly, the hypertonic saline infusion test requires close monitoring of sodium levels to ascertain a diagnostically meaningful increase of plasma sodium within the hyperosmotic range while preventing a marked increase. Addition of copeptin measurement did not improve the diagnostic performance of the indirect water deprivation test, most likely due to the lack of osmotic stimulus by thirsting alone. Another study suggests that non-osmotically stimulated copeptin levels upon arginine infusion also provide a high diagnostic accuracy in differentiating central DI from PP (117). These data indicate that plasma copeptin is a promising biomarker to distinguish between different forms of polyuria–polydipsia syndrome. A possible diagnostic algorithm with and without the availability of copeptin measurement is shown in Figure 8.


Figure 8. Algorithm for the differential diagnosis of diabetes insipidus (Rev Christ-Crain, Nat Rev Primer)


In establishing the underlying mechanisms of central DI once the diagnosis is confirmed, imaging of the hypothalamus, pituitary and surrounding structures with MRI is essential. If no mass lesion is identified, imaging should be repeated after 6-12 months so that slow growing germ cell tumors are not missed. Idiopathic and familial central DI are often associated with loss of the normal hyper-intense signal of the posterior pituitary on T1-weighted images (Figure 9). Signal intensity is correlated strongly with AVP content of the gland (118). In the absence of appropriate history and diagnostic testing, the loss of a posterior pituitary bright spot does not make the diagnosis of central DI. Importantly, presence of an appropriate bright spot does not exclude the diagnosis of central DI.


Figure 9. Loss of the posterior pituitary 'bright spot' on T1 weighted MRI in hypothalamic diabetes insipidus. The normal posterior pituitary can be demonstrated as a 'bright spot' within the sella turcica on T1-weighted MRI (a). This increased signal intensity can be lost in HDI (b). An ectopic posterior pituitary 'bright-spot' can be seen some cases of childhood onset hypopituitarism, implying failure to complete normal developmental migration. Function can be normal despite the aberrant position

Evidence of anterior pituitary dysfunction should be looked for in central DI, though it is relatively uncommon in the adult population. Interestingly, evidence of organ-specific autoimmune disease is relatively common in adult patients with isolated central DI, consistent with an autoimmune basis for the condition (119). 


TREATMENT OF DIABETES INSIPIDUS


Treatment of Central DI


The primary aim of treatment in patients with diagnosed central DI should be to reduce polyuria and polydipsia to levels that allow maintenance of a normal lifestyle. The treatment of choice for those with significant symptoms is the synthetic, long-acting AVP analogue DDAVP. The long half-life, selectivity for AVPR2 and availability of multiple preparations renders desmopressin an ideal treatment for central DI. Optimal dosage and dosing intervals should be determined for each patient. The available treatment options are the intranasal spray, oral tablets, sublingual tablets or a parenteral injection, in divided doses. Oral preparations provide greater convenience and are usually preferred by patients. However, starting with a nasal spray initially is preferable because of greater consistency of absorption and physiological effect, after which the patient can be switched to an oral preparation. After trying both preparations, the patient can then choose which they prefer for long-term treatment. A satisfactory schedule can generally be determined using modest doses of desmopressin. The maximum dose of desmopressin required rarely exceeds 0.2 mg orally, 120 µg sublingually or 10 µg (one nasal spray) given 2–3 times daily. These doses usually produce plasma desmopressin levels higher than those required to cause maximum antidiuresis but reduce the need for more frequent treatment (120).


Hyponatremia is the major complication of desmopressin therapy — a 27% incidence of mild hyponatremia (serum sodium 131–134 mmol/l) and a 15% incidence of more severe hyponatremia (serum sodium ≤130 mmol/lm) have been reported after long-term follow-up of patients with chronic central DI (121). Hyponatremia usually occurs if the patient is antidiuretic while continuing normal fluid intake. Severe hyponatremia in patients with central DI who are treated with desmopressin can be avoided first by monitoring serum electrolyte levels frequently during initiation of therapy and second, patients should be instructed to delay a scheduled dose of desmopressin once or twice weekly until polyuria recurs, thereby allowing excess retained fluid to be excreted. A recent publication showed that patients using this approach had a significantly lower the risk of hyponataemia compared to those who did not follow this approach (OR 0.4, 95%CI 0.3-0.7, p<0.01) (122).

Mostly, Desmopressin is a lifelong treatment. An exception is treatment of postsurgical central DI. If the patient is awake and responds to thirst, thirst is a sufficient guide for water replacement. If the duration of diabetes insipidus is transient, it is therefore acceptable to treat simply with fluid replacement, parenterally or orally. However, most patients who develop diabetes insipidus require desmopressin 0.5 to 2 μg subcutaneously, intramuscularly, or intravenously. Urine output will be reduced in 1 to 2 hours and the duration of effect is 6 to 24 hours. Care should be taken that hypotonic intravenous fluids are not given excessively after administering desmopressin, as the combination can lead to profound hyponatremia. Because there is always the possibility of developing the triphasic response due to pituitary stalk damage, it is recommended that polyuria should be recurrent before a decision to administer subsequent doses of desmopressin is made (123).


Patients with hypernatremia due to osmoreceptor dysfunction (adipsic central DI) should be treated acutely with the same treatment as any hyperosmolar patient. The long-term management of osmoreceptor dysfunction syndromes requires a thorough search for potentially treatable causes, combined with measures to prevent dehydration. Because hypodipsia cannot be cured, the focus of management is based on education of the patient and family about the importance of regulating their fluid intake according to their hydration status (124). This can be accomplished most efficaciously by establishing a daily schedule of fluid intake regardless of the patient's thirst, which can be adjusted in response to changes in body weight (125). As these patients will not drink spontaneously, daily fluid intake must be fixed and prescribed. If the patient has polyuria, desmopressin should also be prescribed, as in any patient with central DI. The success of the fluid prescription should be monitored periodically by measuring serum Na+concentration. In addition, periodic recalculation of the target weight (at which hydration status and serum Na+concentration are normal) might be required.


Treatment of NDI


Treatment of acquired nephrogenic DI should target the underlying cause (e.g., correction of hypercalcemia or hypokalemia), if possible. If not, different approaches are possible.


  • Low salt diet to minimize the osmotic load
  • For patients on long-term lithium therapy, amiloride prevents uptake of lithium in the collecting duct epithelial cells and thus the inhibitory effects of intracellular lithium on water transport (126).
  • Hydrochlorothiazide has been shown to reduce urine output in both central and nephrogenic DI (127, 128). Thiazides decrease salt reabsorption by inhibiting the thiazide-sensitive co-transporter SLC12A3 in the distal tubule. The loss of sodium reduces plasma volume, so that less water is presented to the collecting duct and lost in the urine.
  • In an animal model of nephrogenic DI, use of the NSAID indomethacin reduced water diuresis independently of AVP (129). A similar effect of prostaglandin synthesis inhibitors was later reported in patients with nephrogenic DI (130). Since these early studies, prostaglandin synthesis inhibitors have become an essential component of the treatment of nephrogenic DI
  • High dose DDAVP can produce a response in partial NDI


Treatment of PP


Treatment of primary polydipsia entails reduction of excessive fluid intakes, best done in a graded fashion to allow patients to slowly achieve a level of intake that reduced urine volume below polyuric levels (50 mL/kg BW). Measures to reduce mouth dryness (e.g., ice chips, hard candy to stimulate salivary flow) are useful adjuncts to reduce thirst. Pharmacologic therapies have been tried but without consistent evidence of success. A recent study suggests that GLP-1 analogues reduce fluid intake, urine output, and thirst perception(131).


Treatment of Gestational DI


Desmopressin is the only therapy recommended for treatment of diabetes insipidus during pregnancy. Desmopressin is reported to be safe for both the mother and the child (132, 133). During delivery, patients can maintain adequate oral intake and are therefore safe to continue administration of desmopressin. Physicians should be cautious about over administration of fluid parenterally during delivery because these patients will not be able to excrete the fluid and can develop water intoxication and hyponatremia. After delivery, plasma oxytocinase decreases and patients can recover completely or be asymptomatic with regard to fluid intake and urine excretion.


Syndrome Of Inappropriate Antidiuresis


HYPONATREMIA


Hyponatremia (serum sodium <135 mmol/l) is a clinical feature in some 15–20% of non-selected emergency admissions to hospital. It is associated with increased morbidity and mortality across a range of conditions. Moreover, data support the association of hyponatremia correction with improvements in clinical outcome. The relationship of serum sodium and outcome is not straightforward. Co-morbidity and disease severity, rather than hyponatremia per se, may make a significant contribution to adverse outcome in these patients. Further data are needed to clarify whether the relationship between sodium levels and outcome is causal or the association of two variables linked with disease severity (134-137).


Hyponatremia is not invariably associated with a low serum osmolality; high concentrations of other circulating osmolytes (e.g., glucose) can lead to a fall in plasma sodium that is appropriate to maintain normal osmolar status. A reduced plasma aqueous phase secondary to dyslipidemia can result in artefactual hyponatremia with normal plasma osmolality, even when using an ion-specific electrode. This is consequent to the use of a standard dilution step in most clinical biochemistry laboratories. This type of artefactual hyponatremia is not seen when a direct potentiometric method is used, such as when using a blood-gas analyzer. In many clinical situations, hyponatremia is multifactorial (Table 4).


Table 4. Causes of Hyponatremia

Pseudohyponatremia

Reduced renal free water clearance

Hyperglycemia, Hyperlipidemia, Non-physiological osmolyte, Elevated paraprotein

Hypovolemia
Cardiac failure
Nephrotic syndrome
Hypothyroidism
Hypoadrenalism
SIAD
Nephrogenic syndrome of antidiuresis

Drugs
Renal failure
Portal hypertension & ascites

Hypoalbuminemia
Sepsis
Fluid sequestration

Sodium depletion

Renal loss

Diuretics
Salt wasting nephropathy Hypoadrenalism
Central salt wasting

Extra-renal loss

Gut loss

Excess water intake

Dipsogenic DI
Sodium-free, hypo-osmolar irrigant solutions
Dilute infant feeding formula
Exercise-associated hyponatremia


AVP plays a key role in many pathophysiological situations of which hyponatremia is a feature. Importantly however, even when AVP plays a role in the development of hyponatremia, AVP production may not be inappropriate. Hyponatremia may reflect an appropriate physiological response to volume depletion. To maintain circulating volume in hypovolemia, baroregulated AVP release may proceed despite plasma osmolalities below the osmotic threshold for AVP release. This can result in hyponatremia, which can become persistent. Though clinical assessment can identify the extracellular volume status of some patients, it is unreliable and has poor sensitivity and specificity (138).


PATHOPHYSIOLOGY AND DIAGNOSIS OF SIAD


An individual with hypoosmolar plasma, a normal circulating volume, and a plasma AVP concentration high for the prevailing osmolality, has the syndrome of inappropriate antidiuresis (SIAD). The clinical criteria to diagnose SIAD go back to Schwartz and Bartter (139) in 1967 and are summarized in Table 5.


Excretion of urine that is not maximally dilute in the context of dilute plasma (i.e., urine concentration greater than 100mOsm/Kg) indicates the action of AVP on renal water resorption. Importantly however, it does not define whether this action is appropriate (for instance in the context of hypovolemia and baro-stimulated AVP release) or inappropriate. Measurement of urinary sodium concentration is key in the differential diagnosis of SIAD from hypovolemia. Renal sodium excretion should be above 30mol/L to make a diagnosis of SIAD. Below this value, volume depletion needs to be considered more likely and below 20 mmol/L, hypovolemia is the likely cause of hyponatremia. SIAD is often associated with urine sodium concentrations of 60 mmol/L or more. SIAD is a volume-expanded state and there is evidence of mild sodium loss as other homeostatic regulators of volume homeostasis attempt to minimize volume expansion. The utility of urinary sodium concentration in defining the etiology of hyponatremia is limited by concurrent use of drugs that produce a natriuresis: diuretics, angiotensin converting enzyme inhibitors, and angiotensin II antagonists. In this situation, a serum urate <4 mg/dl, or a fractional urate excretion >12% can help differentiate SIAD from mild hypovolemia (140, 141).


Cortisol deficiency is a key differential diagnosis as secondary adrenal deficiency can present a biochemical picture identical to SIAD. Therefore, formal biochemical exclusion of adrenal insufficiency is mandatory before diagnosing SIAD.


Four patterns of abnormal AVP secretion have been identified (table 6). The same pattern has also been shown for copeptin (142). Absolute plasma AVP or copeptin concentrations may not be strikingly high and in fact AVP and copeptin measurement is not helpful in establishing the diagnosis (143). The key feature is that they are inappropriate for the prevailing plasma osmolality (10).


●      Table 5. Criteria for Diagnosis of SIAD

●      Low serum osmolality <275 mOsmol/kg H20

●      Elevated urine osmolality >100 mOsmol/kg H20 (inappropriately concentrated)

●      Clinical euvolemia (absence of signs of hypovolemia or hypervolemia)

●      Elevated urinary sodium excretion >30mEq/L with normal salt and water intake

●      Absence of other potential causes of euvolemic hypo-osmolality (glucocorticoid insufficiency, severe hypothyroidism)

●      Normal renal function and absence of diuretic use


Table 6. Classification of SIAD


Characteristics

Prevalence

SIAD Type A

Wide fluctuations in plasma AVP concentration independent of plasma osmolality

35%

SIAD Type B

Osmotic threshold for AVP release subnormal
Osmoregulation around subnormal osmolar set point

30%

SIAD Type C

Failure to suppress AVP release at low plasma osmolality
Normal response to osmotic stimulation


SIAD Type D

Normal osmoregulated AVP release
Unable to excrete water load.

<10%


Etiology of SIAD


Many conditions have been reported to cause SIAD, though the mechanism(s) of inappropriate AVP release are not clear in many cases (Table 7). SIAD is a non-metastatic manifestation of small cell lung cancer and other malignancies. Some tumors express AVP ectopically. However, excessive posterior pituitary AVP secretion also occurs in association with malignancy. The normal osmoregulated AVP release found in the Type D syndrome suggests an increase in renal sensitivity to AVP, or the action of an additional antidiuretic factor.


Table 7. Causes of SIAD

Neoplastic disease

Chest disorders

Carcinoma (bronchus, duodenum, pancreas, bladder, ureter, prostate)
Thymoma
Mesothelioma
Lymphoma, leukemia
Ewing's sarcoma
Carcinoid
Bronchial adenoma

Pneumonia
Tuberculosis
Empyema
Cystic fibrosis
Pneumothorax
Aspergillosis

Neurological disorders

Drugs

Head injury, neurosurgery
Brain abscess or tumor
Meningitis, encephalitis
Guillain-Barré syndrome
Cerebral hemorrhage
Cavernous sinus thrombosis
Hydrocephalus
Cerebellar and cerebral atrophy
Shy-Drager syndrome
Peripheral neuropathy
Seizures
Subdural hematoma
Alcohol withdrawal

Sulphonylureas
Alkylating agents & Vinca alkaloids
Thiazide diuretics
Dopamine antagonists
Tricyclic antidepressants
MAOIs
SSRIs
3,4-MDMA ("Ecstasy")
Anti-convulsants

Miscellaneous

Idiopathic
Psychosis
Porphyria
Abdominal surgery
Diverse non-osmotic stimuli (e.g., nausea, stress, pain)


SIAD is a common mechanism of drug-induced hyponatremia, and can reflect direct stimulation of AVP release from the hypothalamus; indirect action on the hypothalamus; or aberrant resetting of the hypothalamic osmostat (table 8). The prevalence of hyponatremia in patients taking high dose dopamine antagonists is greater than 25%, and is not restricted to one class of these drugs. Hyponatremia secondary to antidepressants is well recognized, occurring with most SSRIs, and the related drug Venlafaxine. It can arise in the first few weeks of treatment. Anticonvulsants are another common cause of SIAD and hyponatremia. The frequency in patients treated with carbamazepine (CBZ) ranges from 4.8 to 40%. Increased sensitivity of central osmoreceptors and increased renal responses to AVP have both been described with CBZ.


Table 8. Mechanisms of Drug Induced Hyponatremia

Reduction in free water clearance

Sodium depletion

SIAD

Dopamine antagonists
Tricyclic antidepressants
MAOIs
SSRIs
Venlafaxine
Carbamazepine
Oxcarbamazepine
Sodium valproate
3,4-MDMA ('ecstasy')
Clofibrate
Cyclophosphamide
Sulphonylureas

Diuretics

Spironolactone
Thiazides
Loop diuretics

AVP-like activity

DDAVP
Oxytocin

ACE inhibitors/Angiotensin II receptor antagonists

Potentiation of AVP action

NSAIDS
Carbamazepine
Sulphonylureas
Cyclophosphamide

Direct renal toxicity

Cyclophosphamide
Ifosfamide
Cisplatin
Carboplatin
Vincristine
Vinblastine


Exercise Associated Hyponatremia


Extreme endurance exercise is a profound physiological stressor. While the magnitude of the physiological stress is likely to reflect a number of factors, duration of the event and the effort entailed are likely to be major contributors. Non-osmoregulated AVP release is a feature of extreme endurance exercise: a reflection of the stressed state. When combined with reduced renal blood flow, another feature of extreme endurance exercise, this can lead to a marked antidiuretic state. If endurance athletes maintain a fluid intake in excess of water loss, hyponatremia will ensue. This can be further complicated if there is aggressive fluid resuscitation in the event of collapse. There is a positive correlation between the odds ratio for developing hyponatremia during extreme endurance exercise and the length of time taken to complete the event. Athletes developing hyponatremia also demonstrate weight gain over the course of the event, clearly implicating water intake in excess of water and electrolyte loss as the cause. Occasional runners should be advised to follow their thirst as they run and avoid rigid, time-based fluid intake. Health professionals attending endurance events need to be aware of the problem of exercise-associated hyponatremia. In addition, they should avoid attempting resuscitation with large volumes of hypotonic fluid in the absence of appropriate indications and without biochemical monitoring (144).


Figure 10. Exercise associated hyponatremia in triathletes. 1089 triathletes were studied. The mean plasma sodium level at the finish was 140.5±4.2 mmol/L (range 111-152). Among athletes completing the study events, 10.6% had documented hyponatremia: 8.7% mild; 1.6% severe; and 0.3% critical (3 athletes in total with plasma sodium levels 120, 119, and 111 mmol/L respectively). Multivariate analysis showed a significant association between development of hyponatremia and the following factors: female gender; longer times to complete a race. Critical hyponatremia occurred in participants who finished in the 12th and 14th hours of the race (145).


Nephrogenic Syndrome of Inappropriate Antidiuresis


The G-protein-coupled V2-R mediates the action of AVP on renal water excretion. Rare kindreds have been found that harbor constitutively activating mutations in the V2-R that led to AVP-independent, V2-R mediated, antidiuresis associated with persistent hyponatremia (Figure 11). This nephrogenic syndrome of inappropriate antidiuresis (NSIAD) was initially described in male infants with persistent hyponatremia in keeping with the haploinsufficiency associated with the V2-Rgene being on the X chromosome. However, subsequent studies have found the condition is not limited to males, expression of the condition being clearly identified in heterozygous females. The true prevalence of NSIAD is not known. However, as some 10% of patients with SIAD have been described as having undetectable AVP, it seems likely that at least some of these cases may be due to activating mutations of the V2-R (146, 147).


Figure 11. In vitro bioactivity of different V2-R constructs relative to wild type (WT) in a cAMP-dependent luciferase reporter system in the absence of AVP. The R137H construct is the V2-R found in X-linked NDI. R137C and R137L are receptor variants found in NSIAD. Constructs differ only by the amino acid at position 137. R137C and R137L found in NSIAD demonstrate constitutive, AVP-independent activity. R: arginine. H: histidine. C: cysteine. L: leucine.


Cerebral Salt Wasting


This acquired, primary natriuretic state remains a subject of controversy. It has been characterized as a combination of hyponatremia with hypovolemia associated with neurological or (more often) neurosurgical pathologies. The underlying mechanism(s) remain unclear, but increased release of natriuretic peptides and/or reduced sympathetic drive have been proposed. The diagnosis of cerebral salt wasting (CSW) hinges on the natural history: the development of hyponatremia being preceded by natriuresis and diuresis with ensuing clinical and biochemical features of hypovolemia. In contrast to SIAD, urea and creatinine are elevated and there may be postural hypotension. The simple observation of weight loss over the period in question can be helpful.


SIAD can occur in the same group of patients in whom CSW has been reported. Both CSW and SIAD are associated with urine sodium concentrations greater than 40mmols/L. However, the natriuresis of CSW is much more profound than that of SIAD and precedes the development of hyponatremia. CSW is a particular concern for the neurosurgical patient in whom autoregulation of cerebral blood flow is disturbed and in whom small reductions in circulating volume can reduce cerebral perfusion. The management of CSW is volume replacement with 0.9% saline; while the cause-directed approach to SIAD would often involve restriction of fluid. The clinical and practice context, together with the opposed cause-directed management approaches to CSW and SIAD can lead to significant tension. A cause-independent approach to the management of the neurosurgical patient with hyponatremia is often the practical and pragmatic approach to take: balancing management of hyponatremia with the need to avoid threatening cerebral perfusion and avoidable vasospasm (148). Importantly, in a prospective, single center study of 100 patients developing hyponatremia after subarachnoid hemorrhage not a single case of CSW was identified: hyponatremia was attributable to SIAD, glucocorticoid deficiency, or inappropriate fluid administration (Figure 12). Therefore, CSW is probably a very rare condition.


Figure 12. Hyponatremia after subarachnoid hemorrhage. Prospective study of 100 patients. Demographics, outcomes and etiology of hyponatremia noted. SAH: subarachnoid hemorrhage (149).


MANAGEMENT OF HYPONATREMIA SECONDARY TO SIAD


The morbidity and mortality of hyponatremia secondary to SIAD are the result of disturbance in central nervous system (CNS) function: the combined impact of cerebral oedema and direct neuronal dysfunction (Table 9). While it is intuitive that the greater the derangement in serum sodium should be associated with the most profound neurological disturbance, the relationship between serum sodium and neurological function is not simple. Patients with marked biochemical disturbance may have mild symptoms if hyponatremia develops over a prolonged period. This reflects CNS adaptation: brain edema being limited by efflux of organic solutes. This adaptation can complicate the management of hyponatremia. Rapid correction of serum sodium following the gradual development of hyponatremia (which has resulted in a degree of CNS adaptation) can lead to significant changes in brain volume as the osmolar gradient across the blood-brain barrier alters. This can trigger CNS demyelination (osmotic demyelination syndrome, ODS). This is a rare but serious complication of hyponatremia and its treatment. ODS develops within 1-4 days of rapid correction of serum sodium, irrespective of the method employed to achieve it. It can even occur when sodium levels are corrected slowly. Risk factors for ODS are severe liver disease, potassium depletion, malnutrition and profound hyponatremia, especially if <105mmol/L. Neurological manifestations include quadriplegia, opthalmoplegia, pseudo-bulbar palsy and coma.


Table 9. Clinical Features of Hyponatremia Secondary to SIAD

• Headache

• Nausea

• Vomiting

• Muscle cramps

• Lethargy

• Disorientation

• Seizure

• Coma

• Brain-stem herniation


Management of Hyponatremia Associated with Severe or Moderately Severe Symptoms


Hyponatremia associated with severe or moderately severe symptoms requires urgent management as an emergency. Treatment is cause-independent. Treatment should be given priority over establishing the etiology of hyponatremia. The aim of treatment is to reduce immediate risk through increasing serum sodium to a level that decreases morbidity and mortality. Importantly, the rate of increase in serum sodium must be at a rate that does not result in harm through precipitating ODS (Figure 13). The immediate target should not be to normalize serum sodium. Once the patient is stable, investigations to establish the cause of hyponatremia can begin, the outcome of which subsequently guiding cause-directed therapy (140, 150, 151).


Figure 13. Immediate, cause-independent management of hyponatremia associated with severe or moderately severe symptoms.


Previous strategies for the emergency management of hyponatremia have stratified patients based on presumed duration of the electrolyte disturbance. Furthermore, some have advocated hypertonic fluid administration volume and rates based on calculated deficits in serum sodium using a standard formula (152). A more pragmatic and reliable approach to patient stratification is to base the decision on use of hypertonic fluid on patient symptoms and signs; while the determining hypertonic fluid prescription by calculated serum sodium deficit is associated with a significant risk of over-correction (153). Over-correction of hyponatremia (increase in serum sodium above the recommended rate) should prompt review of the fluid regimen and consideration of active management with hypotonic fluid, with or without concurrent use of DDAVP (140, 154).


Two recent studies have compared bolus versus infusion hypertonic saline, both in favor of a bolus regimen. An Irish observational study compared outcomes for 22 hyponatremic patients treated with bolus 100ml 3% NaCl, compared to a historical cohort of 28 patients managed with 20ml/hour 3% NaCl infusion (155). Bolus hypertonic saline was associated with a faster elevation of serum sodium at 6 hours and significantly greater improvement in Glasgow Coma Scale at 6 hours. There were no cases of ODS in either group. A larger randomized trial from Korea included 178 patients with hyponatremia who were randomized to either bolus or infusion NaCl 3% (156). The results showed that both therapies were effective and safe, with no significant difference in overcorrection risk, but there was less need for therapeutic relowering in the bolus group compared to the slow continuous infusion. Bolus therapy is therefore currently recommended in guidelines. 


Management of SIAD Associated with Mild to Moderate Symptoms


Fluid restriction: Fluid restriction of 0.5–1L/day is the first-line treatment recommended by EU and US guidelines (157). It is a reasonable initial intervention when the clinical condition is not critical. All fluids need to be included in the restriction. As SIAD is associated with a degree of natriuresis, sodium intake should be maintained. Fluid restriction may need to be maintained for several days before sodium levels normalize and it is important that a negative fluid balance is confirmed during this period. As cause-directed therapy progresses (e.g., treatment of underlying infection or removal of drug causing SIAD), fluid restriction may be relaxed. A recent randomized controlled trial evaluated the efficacy of fluid restriction in comparison to no treatment showing a modest early rise in serum sodium of 3mmol/L in fluid restricted patients compared to 1mmol/L with no treatment. Similar results were seen in other recent trials (158).


Of note, fluid restriction is not always effective, and a clinically useful response is only seen in around half of hyponatremic patients. In a large hyponatremia registry fluid restriction was unsuccessful in 55% of cases (159). Factors predicting a poor response to fluid restriction include high urine osmolality (>500 mosm/L), and high urine sodium concentration (or high urine/serum electrolyte ratio i.e. (UNa + UK)/pNa > 1, i.e., ‘Furst equation’) (150, 160, 161).


Drug treatment in SIAD: If patients do not respond to fluid restriction, a second-line treatment has to be initiated. There are several different possibilities, which are discussed in the following.


Urea is a product of hepatic nitrogen metabolism which is renally excreted and has an osmotic effect to promote free water excretion. It is recommended as a second line treatment in the European and US guidelines(140, 150). The evidence base for the use of urea is limited due to the retrospective observational nature of most current studies. In fact, there are several observational studies of urea, but no randomized trials to date. A retrospective observational trial reported a mean increase in sodium levels of 7 mmol/L over 4 days, with no instances of rapid correction (162). Another retrospective study reported that the majority of patients normalized sodium levels within 48 hours despite fluid intake >2 L/d (163). Finally, in patients with SIAD in the context of subarachnoid hemorrhage urea treatment led to sodium normalization within a mean time of 3 days (164).


Although overcorrection has been described, there have been no published cases of ODS due to urea therapy. The main limitations are the difficult access and poor palatability due to bitter taste, which can be ameliorated by combining it with a small volume of orange juice. Urea therapy can cause an increase in serum urea concentration and blood urea nitrogen, but this does not necessarily represent deterioration in renal function or hypovolemia (162).


Tolvaptan is an oral vasopressin V2-receptor antagonist that blocks AVP action in the kidney, inducing water diuresis and thereby raising sodium levels. An intravenous alternative conivaptan is also approved, but its use is limited to a maximum duration of 4 days because of drug interaction effects with other agents metabolized by the CYP3A4 hepatic isoenzyme.

The efficacy of tolvaptan versus placebo was investigated in the randomized placebo-controlled SALT-1 and SALT-2 trials in patients with chronic eu- or hypervolemic hyponatremia (165). The results showed that tolvaptan increased sodium levels within 4 days by 4 mmol/L compared to only 1 mmol/L in the placebo group and an even higher increase within 30 days. The American expert panel recommends its use as a second-line treatment, whereas the European clinical practice guidelines recommend against the use of tolvaptan in moderate to profound hyponatremia, mainly due to lack of proven outcome benefit aside from increase in sodium levels and the concern of overcorrection. Importantly, discontinuing fluid restriction when vaptans are started, initiation of treatment in the hospital and regular sodium monitoring limit the risk for overcorrection. A lower initial dose of tolvaptan, 7.5 mg, which has been associated with lower rates of overcorrection, should also be considered (166). Common side effects of tolvaptan include dry mouth, thirst, and urinary frequency.


Sodium-glucose co-transporter 2 inhibitors are approved for treatment of diabetes and heart failure, but may also be beneficial in SIAD. The sodium-glucose co-transporter 2 in the proximal renal tubule is responsible for 90% of renal glucose resorption (167). Inhibition of SGLT2 leads to glycosuria, accompanied by an osmotic diuresis. A randomized trial of inpatients with SIAD compared 4 days of empagliflozin 25mg or placebo, in addition to fluid restriction (168). Plasma sodium increased by 10mmol/L over 4 days in the empagliflozin group, compared to 7mmol/L with placebo (p = 0.04). There was no hypotension or hypoglycemia observed. The relatively high sodium increment in the placebo group suggests that at least in some patients, reversible stimuli to AVP secretion may have been present. A second, randomized controlled cross-over study in 14 patients’ outpatients with chronic SIAD compared a 4-week treatment with empagliflozin 25mg/day to placebo, without concomitant fluid restriction. Empagliflozin treatment resulted in a serum sodium increase of 4.1mmol/L (p=0.004) under empagliflozin as compared to placebo. Treatment with empagliflozin was generally well tolerated with no events of sodium overcorrection, hypoglycemia, hypotension, urinary tract or genital infection occurring during the observation period (169). Future larger studies are needed to validate these findings.


Loop diuretics block the Na+-K+-2CL- cotransporter in the thick ascending limb of the loop of Henle and decrease delivery of sodium and chloride to the kidney medulla, decreasing the medullary gradient necessary for water reabsorption in the collecting duct. Salt tablets are added to replace loop diuretic-induced sodium losses. They are listed in the European practice guidelines as a second line therapy for SIAD in combination with salt tablets. However, a recent randomized controlled trial comparing the effect of FR alone versus FR plus loop diuretics versus FR plus loop diuretics plus salt tablets did not show a significant additive effect of loop diuretics or salt tablets (158). Acute kidney injury and hypokalemia were more common in patients receiving furosemide, therefore caution should be taken when adopting this strategy.


Demeclocycline has been used for many years in management of hyponatremia of SIAD. It produces a form of NDI and so increases renal water loss even in the presence of AVP. There is a lag time of some 3–4 days in onset of action and the effect is unpredictable occurring in 33-60% of patients. Photosensitive skin reactions are a significant additional adverse effect. There are very limited data to support long-term efficacy and a systematic review did not find good quality evidence for its use (170).

Lithium also induces nephrogenic diabetes insipidus and has therefore been tried as treatment for SIAD, however, due to adverse effects and questionable efficacy it is not recommended in European guidelines.


Adipsic And Hypodipsic Syndromes


Adipsic and hypodipsic disorders are characterized by inadequate spontaneous fluid intake due to defects in osmoregulated thirst. Patients deny thirst and do not drink, despite dehydration and hypovolemia. If the defect is mild, the resultant hypernatremia is often well tolerated. Severe disorders can lead to somnolence, seizures, and coma. Because of the close anatomical relationship of the osmoregulatory centers for thirst and AVP release, adipsic syndromes are often associated with defects in osmoregulated AVP release and HDI.


CLASSIFICATION AND ETIOLOGY


Four patterns of adipsic/hypodipsic syndrome are recognized (Table 10, Figure 14). Causes are outlined in Table 11. Patients with the Type A syndrome osmoregulate around a supra-normal osmolar set point and are protected from extreme hypernatremia, as are those with the Type B syndrome. In Type C adipsia, osmoregulated thirst and AVP release are absent. Patients present with adipsic diabetes insipidus. Precipitants include rupture and repair of anterior communicating artery (ACA) aneurysm, as the osmoreceptors mediating both thirst and AVP release receive a blood supply from perforating branches of the anterior cerebral artery and ACA. Some patients with the Type C syndrome have constitutive low level AVP release, and are at risk of dilutional hyponatremia.


Table 10. Classification of Adipsic and Hypodipsic Syndromes

Adipsia/hypodipsia Syndrome

Osmoregulated Thirst

Osmoregulated AVP release

Type A (essential hypernatremia)

Osmotic threshold increased
Normal sensitivity

Osmotic threshold increased
Normal sensitivity Normal non-osmotic stimulation

Type B

Normal osmotic threshold
Reduced sensitivity

Normal osmotic threshold
Reduced sensitivity
Normal non-osmotic stimulation

Type C

No response to osmotic stimulation

Persistent low level AVP release
No response to osmotic stimulation
Normal non-osmotic stimulation

Type D

No response to osmotic stimulation

Normal


Table 11. Causes of Adipsic and Hypodipsic Syndromes

Neoplastic (50%)

Primary

Craniopharyngioma
Germ cell tumor
Meningioma

Secondary

Pituitary tumor
Bronchial carcinoma
Breast carcinoma

Granulomatous (20%)
Histiocytosis
Sarcoidosis

Miscellaneous (15%)
Hydrocephalus
Ventricular cyst
Trauma

Toluene poisoning

Vascular (15%)
Internal carotid artery ligation
Anterior communicating artery aneurysm
Intra-hypothalamic hemorrhage


Figure 14. Patterns of plasma AVP and thirst responses to hypertonic stress in patients with adipsic syndromes. Normal range responses to osmolar stimulation are shown by the shaded areas. The 4 types of adipsic syndrome are demonstrated. Patients with the Type A syndrome osmoregulate around a higher osmolar set point, while those with the Type B syndrome mount AVP and thirst responses but with reduced sensitivity. Patients with the Type C syndrome have much reduced or absent AVP and thirst responses to osmolar stimulation. Those with the Type D syndrome demonstrate normal AVP responses to osmolar stimulation but much reduced thirst responses.


MANAGEMENT


As those with Type A and Type B adipsia are protected from extreme hypernatremia, treatment is to recommend an obligate fluid intake of about 2L/24 hours with appropriate adjustment for climate and season. If fluid balance cannot be maintained during intercurrent illness, hospital in-patient management may be required. The adipsic central diabetes insipidus of the Type C syndrome can be difficult to manage. The structural and vascular problems producing the syndrome often led to associated defects in short term memory and task organization, complicating long-term management. A pragmatic approach is to effectively dictate an acceptable urine output (1-2L/24 hours) with regular DDAVP (producing a fixed obligate antidiuresis). Together with an estimation of standard insensible fluid loss (approximately 0.4L), this can be set to create a fixed net fluid loss of some 2Ls. In turn, this can be balanced by a daily fluid intake that varies in response to depending on day-to-day fluctuations from a target weight at which the patient is euvolemic and normonatremic.


Daily fluid intake = 2L + (daily weight in Kg- target weight in Kg).


Plasma sodium should be checked weekly, to avoid the creeping development of hyper- and hyponatremia as dry weight changes. This approach can result in stable fluid balance and successful independent living (171).


REFERENCES


  1. Waller SJ, Ratty A, Burbach JP, and Murphy D. Transgenic and transcriptional studies on neurosecretory cell gene expression. Cell Mol Neurobiol. 1998;18(2):149-71.
  2. Iwasaki Y, Oiso Y, Saito H, and Majzoub JA. Positive and negative regulation of the rat vasopressin gene promoter. Endocrinology. 1997;138(12):5266-74.
  3. Russell JA, and Leng G. Sex, parturition and motherhood without oxytocin? J Endocrinol. 1998;157(3):343-59.
  4. Ponzio TA, Fields RL, Rashid OM, Salinas YD, Lubelski D, and Gainer H. Cell-type specific expression of the vasopressin gene analyzed by AAV mediated gene delivery of promoter deletion constructs into the rat SON in vivo. PLoS One. 2012;7(11):e48860.
  5. Mohr E, Kächele I, Mullin C, and Richter D. Rat vasopressin mRNA: a model system to characterize cis-acting elements and trans-acting factors involved in dendritic mRNA sorting. Prog Brain Res. 2002;139:211-24.
  6. Nagy G, Mulchahey JJ, Smyth DG, and Neill JD. The glycopeptide moiety of vasopressin-neurophysin precursor is neurohypophysial prolactin releasing factor. Biochem Biophys Res Commun. 1988;151(1):524-9.
  7. Hyde JF, and Ben-Jonathan N. The posterior pituitary contains a potent prolactin-releasing factor: in vivo studies. Endocrinology. 1989;125(2):736-41.
  8. Barat C, Simpson L, and Breslow E. Properties of human vasopressin precursor constructs: inefficient monomer folding in the absence of copeptin as a potential contributor to diabetes insipidus. Biochemistry. 2004;43(25):8191-203.
  9. Schrag JD, Procopio DO, Cygler M, Thomas DY, and Bergeron JJ. Lectin control of protein folding and sorting in the secretory pathway. Trends Biochem Sci. 2003;28(1):49-57.
  10. Bichet DG, Arthus MF, Barjon JN, Lonergan M, and Kortas C. Human platelet fraction arginine-vasopressin. Potential physiological role. J Clin Invest. 1987;79(3):881-7.
  11. Laycock JF, and Hanoune J. From vasopressin receptor to water channel: intracellular traffic, constraint and by-pass. J Endocrinol. 1998;159(3):361-72.
  12. King LS, and Yasui M. Aquaporins and disease: lessons from mice to humans. Trends Endocrinol Metab. 2002;13(8):355-60.
  13. Nielsen S, Kwon TH, Frøkiaer J, and Agre P. Regulation and dysregulation of aquaporins in water balance disorders. J Intern Med. 2007;261(1):53-64.
  14. Verkman AS. Aquaporins at a glance. J Cell Sci. 2011;124(Pt 13):2107-12.
  15. King LS, Choi M, Fernandez PC, Cartron JP, and Agre P. Defective urinary concentrating ability due to a complete deficiency of aquaporin-1. N Engl J Med. 2001;345(3):175-9.
  16. Knepper MA, Kwon TH, and Nielsen S. Molecular physiology of water balance. N Engl J Med. 2015;372(14):1349-58.
  17. McKenna K, and Thompson C. Osmoregulation in clinical disorders of thirst appreciation. Clin Endocrinol (Oxf). 1998;49(2):139-52.
  18. Prager-Khoutorsky M, and Bourque CW. Osmosensation in vasopressin neurons: changing actin density to optimize function. Trends Neurosci. 2010;33(2):76-83.
  19. Roberts EM, Newson MJ, Pope GR, Landgraf R, Lolait SJ, and O'Carroll AM. Abnormal fluid homeostasis in apelin receptor knockout mice. J Endocrinol. 2009;202(3):453-62.
  20. Azizi M, Iturrioz X, Blanchard A, Peyrard S, De Mota N, Chartrel N, et al. Reciprocal regulation of plasma apelin and vasopressin by osmotic stimuli. J Am Soc Nephrol. 2008;19(5):1015-24.
  21. Llorens-Cortes C, and Moos F. Apelin and vasopressin: two work better than one. J Neuroendocrinol. 2012;24(7):1085-6.
  22. Blanchard A, Steichen O, De Mota N, Curis E, Gauci C, Frank M, et al. An abnormal apelin/vasopressin balance may contribute to water retention in patients with the syndrome of inappropriate antidiuretic hormone (SIADH) and heart failure. J Clin Endocrinol Metab. 2013;98(5):2084-9.
  23. Bourque CW. Central mechanisms of osmosensation and systemic osmoregulation. Nat Rev Neurosci. 2008;9(7):519-31.
  24. Lechner SG, Markworth S, Poole K, Smith ES, Lapatsina L, Frahm S, et al. The molecular and cellular identity of peripheral osmoreceptors. Neuron. 2011;69(2):332-44.
  25. Trudel E, and Bourque CW. Circadian modulation of osmoregulated firing in rat supraoptic nucleus neurones. J Neuroendocrinol. 2012;24(4):577-86.
  26. Cunningham JT, Bruno SB, Grindstaff RR, Grindstaff RJ, Higgs KH, Mazzella D, et al. Cardiovascular regulation of supraoptic vasopressin neurons. Prog Brain Res. 2002;139:257-73.
  27. Ishikawa SE, and Schrier RW. Pathophysiological roles of arginine vasopressin and aquaporin-2 in impaired water excretion. Clin Endocrinol (Oxf). 2003;58(1):1-17.
  28. Verbalis J, and Usala R. Disorders of water and sodium homeostasis and bone. Current Opinion in Endocrine and Metabolic Research. 2018;3:83-92.
  29. Tamma R, Sun L, Cuscito C, Lu P, Corcelli M, Li J, et al. Regulation of bone remodeling by vasopressin explains the bone loss in hyponatremia. Proc Natl Acad Sci U S A. 2013;110(46):18644-9.
  30. Tamma R, Colaianni G, Zhu LL, DiBenedetto A, Greco G, Montemurro G, et al. Oxytocin is an anabolic bone hormone. Proc Natl Acad Sci U S A. 2009;106(17):7149-54.
  31. Sun L, Tamma R, Yuen T, Colaianni G, Ji Y, Cuscito C, et al. Functions of vasopressin and oxytocin in bone mass regulation. Proc Natl Acad Sci U S A. 2016;113(1):164-9.
  32. Aspé-Sánchez M, Moreno M, Rivera MI, Rossi A, and Ewer J. Oxytocin and Vasopressin Receptor Gene Polymorphisms: Role in Social and Psychiatric Traits. Front Neurosci. 2015;9:510.
  33. Dumais KM, and Veenema AH. Vasopressin and oxytocin receptor systems in the brain: Sex differences and sex-specific regulation of social behavior. Front Neuroendocrinol. 2016;40:1-23.
  34. Zimmerman CA, Lin YC, Leib DE, Guo L, Huey EL, Daly GE, et al. Thirst neurons anticipate the homeostatic consequences of eating and drinking. Nature. 2016;537(7622):680-4.
  35. Nishimori K, Young LJ, Guo Q, Wang Z, Insel TR, and Matzuk MM. Oxytocin is required for nursing but is not essential for parturition or reproductive behavior. Proc Natl Acad Sci U S A. 1996;93(21):11699-704.
  36. Goodwin TM, Valenzuela GJ, Silver H, and Creasy G. Dose ranging study of the oxytocin antagonist atosiban in the treatment of preterm labor. Atosiban Study Group. Obstet Gynecol. 1996;88(3):331-6.
  37. Tyzio R, Cossart R, Khalilov I, Minlebaev M, Hübner CA, Represa A, et al. Maternal oxytocin triggers a transient inhibitory switch in GABA signaling in the fetal brain during delivery. Science. 2006;314(5806):1788-92.
  38. Schulze L, Lischke A, Greif J, Herpertz SC, Heinrichs M, and Domes G. Oxytocin increases recognition of masked emotional faces. Psychoneuroendocrinology. 2011;36(9):1378-82.
  39. De Dreu CK, Greer LL, Van Kleef GA, Shalvi S, and Handgraaf MJ. Oxytocin promotes human ethnocentrism. Proc Natl Acad Sci U S A. 2011;108(4):1262-6.
  40. Kosfeld M, Heinrichs M, Zak PJ, Fischbacher U, and Fehr E. Oxytocin increases trust in humans. Nature. 2005;435(7042):673-6.
  41. Hurlemann R, Patin A, Onur OA, Cohen MX, Baumgartner T, Metzler S, et al. Oxytocin enhances amygdala-dependent, socially reinforced learning and emotional empathy in humans. J Neurosci. 2010;30(14):4999-5007.
  42. Mantella RC, Vollmer RR, Li X, and Amico JA. Female oxytocin-deficient mice display enhanced anxiety-related behavior. Endocrinology. 2003;144(6):2291-6.
  43. Ferguson JN, Young LJ, Hearn EF, Matzuk MM, Insel TR, and Winslow JT. Social amnesia in mice lacking the oxytocin gene. Nat Genet. 2000;25(3):284-8.
  44. Winslow JT, and Insel TR. The social deficits of the oxytocin knockout mouse. Neuropeptides. 2002;36(2-3):221-9.
  45. Leppanen J, Ng KW, Kim YR, Tchanturia K, and Treasure J. Meta-analytic review of the effects of a single dose of intranasal oxytocin on threat processing in humans. J Affect Disord. 2018;225:167-79.
  46. Kiani Z, Farkhondeh T, Aramjoo H, Aschner M, Beydokhti H, Esmaeili A, et al. Oxytocin effect in adult patients with autism: An updated systematic review and meta-analysis of randomized controlled trials. CNS Neurol Disord Drug Targets. 2022.
  47. Yoon S, and Kim YK. The Role of the Oxytocin System in Anxiety Disorders. Adv Exp Med Biol. 2020;1191:103-20.
  48. De Cagna F, Fusar-Poli L, Damiani S, Rocchetti M, Giovanna G, Mori A, et al. The Role of Intranasal Oxytocin in Anxiety and Depressive Disorders: A Systematic Review of Randomized Controlled Trials. Clin Psychopharmacol Neurosci. 2019;17(1):1-11.
  49. Jawad MY, Ahmad B, and Hashmi AM. Role of Oxytocin in the Pathogenesis and Modulation of Borderline Personality Disorder: A Review. Cureus. 2021;13(2):e13190.
  50. Carson DS, Berquist SW, Trujillo TH, Garner JP, Hannah SL, Hyde SA, et al. Cerebrospinal fluid and plasma oxytocin concentrations are positively correlated and negatively predict anxiety in children. Mol Psychiatry. 2015;20(9):1085-90.
  51. Parker KJ, Garner JP, Libove RA, Hyde SA, Hornbeak KB, Carson DS, et al. Plasma oxytocin concentrations and OXTR polymorphisms predict social impairments in children with and without autism spectrum disorder. Proc Natl Acad Sci U S A. 2014;111(33):12258-63.
  52. Kranz TM, Kopp M, Waltes R, Sachse M, Duketis E, Jarczok TA, et al. Meta-analysis and association of two common polymorphisms of the human oxytocin receptor gene in autism spectrum disorder. Autism Res. 2016;9(10):1036-45.
  53. Ebstein RP, Knafo A, Mankuta D, Chew SH, and Lai PS. The contributions of oxytocin and vasopressin pathway genes to human behavior. Horm Behav. 2012;61(3):359-79.
  54. Hammock EA, and Young LJ. Oxytocin, vasopressin and pair bonding: implications for autism. Philos Trans R Soc Lond B Biol Sci. 2006;361(1476):2187-98.
  55. LoParo D, and Waldman ID. The oxytocin receptor gene (OXTR) is associated with autism spectrum disorder: a meta-analysis. Mol Psychiatry. 2015;20(5):640-6.
  56. Lefevre A, and Sirigu A. The two fold role of oxytocin in social developmental disorders: A cause and a remedy? Neurosci Biobehav Rev. 2016;63:168-76.
  57. Heinrichs M, Baumgartner T, Kirschbaum C, and Ehlert U. Social support and oxytocin interact to suppress cortisol and subjective responses to psychosocial stress. Biol Psychiatry. 2003;54(12):1389-98.
  58. Sobota R, Mihara T, Forrest A, Featherstone RE, and Siegel SJ. Oxytocin reduces amygdala activity, increases social interactions, and reduces anxiety-like behavior irrespective of NMDAR antagonism. Behav Neurosci. 2015;129(4):389-98.
  59. Labuschagne I, Phan KL, Wood A, Angstadt M, Chua P, Heinrichs M, et al. Oxytocin attenuates amygdala reactivity to fear in generalized social anxiety disorder. Neuropsychopharmacology. 2010;35(12):2403-13.
  60. Ditzen B, Schaer M, Gabriel B, Bodenmann G, Ehlert U, and Heinrichs M. Intranasal oxytocin increases positive communication and reduces cortisol levels during couple conflict. Biol Psychiatry. 2009;65(9):728-31.
  61. Guastella AJ, Howard AL, Dadds MR, Mitchell P, and Carson DS. A randomized controlled trial of intranasal oxytocin as an adjunct to exposure therapy for social anxiety disorder. Psychoneuroendocrinology. 2009;34(6):917-23.
  62. Domes G, Heinrichs M, Gläscher J, Büchel C, Braus DF, and Herpertz SC. Oxytocin attenuates amygdala responses to emotional faces regardless of valence. Biol Psychiatry. 2007;62(10):1187-90.
  63. Kirsch P, Esslinger C, Chen Q, Mier D, Lis S, Siddhanti S, et al. Oxytocin modulates neural circuitry for social cognition and fear in humans. J Neurosci. 2005;25(49):11489-93.
  64. Karavitaki N, Brufani C, Warner JT, Adams CB, Richards P, Ansorge O, et al. Craniopharyngiomas in children and adults: systematic analysis of 121 cases with long-term follow-up. Clin Endocrinol (Oxf). 2005;62(4):397-409.
  65. Brandi ML, Gebert D, Kopczak A, Auer MK, and Schilbach L. Oxytocin release deficit and social cognition in craniopharyngioma patients. J Neuroendocrinol. 2020;32(5):e12842.
  66. Daubenbüchel AM, Hoffmann A, Eveslage M, Özyurt J, Lohle K, Reichel J, et al. Oxytocin in survivors of childhood-onset craniopharyngioma. Endocrine. 2016;54(2):524-31.
  67. Gebert D, Auer MK, Stieg MR, Freitag MT, Lahne M, Fuss J, et al. De-masking oxytocin-deficiency in craniopharyngioma and assessing its link with affective function. Psychoneuroendocrinology. 2018;88:61-9.
  68. Daughters K, Manstead ASR, and Rees DA. Hypopituitarism is associated with lower oxytocin concentrations and reduced empathic ability. Endocrine. 2017;57(1):166-74.
  69. Pereira AM, Schmid EM, Schutte PJ, Voormolen JH, Biermasz NR, van Thiel SW, et al. High prevalence of long-term cardiovascular, neurological and psychosocial morbidity after treatment for craniopharyngioma. Clin Endocrinol (Oxf). 2005;62(2):197-204.
  70. Karavitaki N, Cudlip S, Adams CB, and Wass JA. Craniopharyngiomas. Endocr Rev. 2006;27(4):371-97.
  71. Wijnen M, van den Heuvel-Eibrink MM, Janssen J, Catsman-Berrevoets CE, Michiels EMC, van Veelen-Vincent MC, et al. Very long-term sequelae of craniopharyngioma. Eur J Endocrinol. 2017;176(6):755-67.
  72. Zada G, Kintz N, Pulido M, and Amezcua L. Prevalence of neurobehavioral, social, and emotional dysfunction in patients treated for childhood craniopharyngioma: a systematic literature review. PLoS One. 2013;8(11):e76562.
  73. Eisenberg Y, Murad S, Casagrande A, McArthur M, Dugas LR, Barengolts E, et al. Oxytocin alterations and neurocognitive domains in patients with hypopituitarism. Pituitary. 2019;22(2):105-12.
  74. Aulinas A, Plessow F, Asanza E, Silva L, Marengi DA, Fan W, et al. Low Plasma Oxytocin Levels and Increased Psychopathology in Hypopituitary Men With Diabetes Insipidus. J Clin Endocrinol Metab. 2019;104(8):3181-91.
  75. McCullough ME, Churchland PS, and Mendez AJ. Problems with measuring peripheral oxytocin: can the data on oxytocin and human behavior be trusted? Neurosci Biobehav Rev. 2013;37(8):1485-92.
  76. Landgraf R, and Neumann ID. Vasopressin and oxytocin release within the brain: a dynamic concept of multiple and variable modes of neuropeptide communication. Front Neuroendocrinol. 2004;25(3-4):150-76.
  77. Ludwig M, and Leng G. Dendritic peptide release and peptide-dependent behaviours. Nat Rev Neurosci. 2006;7(2):126-36.
  78. Valstad M, Alvares GA, Egknud M, Matziorinis AM, Andreassen OA, Westlye LT, et al. The correlation between central and peripheral oxytocin concentrations: A systematic review and meta-analysis. Neurosci Biobehav Rev. 2017;78:117-24.
  79. Sailer CO, Winzeler B, Urwyler SA, Schnyder I, Refardt J, Eckert A, et al. Oxytocin levels in response to pituitary provocation tests in healthy volunteers. Eur J Endocrinol. 2021;185(3):355-64.
  80. Christ-Crain M, Bichet DG, Fenske WK, Goldman MB, Rittig S, Verbalis JG, et al. Diabetes insipidus. Nat Rev Dis Primers. 2019;5(1):54.
  81. Baylis PH, and Cheetham T. Diabetes insipidus. Arch Dis Child. 1998;79(1):84-9.
  82. Tomkins M, Lawless S, Martin-Grace J, Sherlock M, and Thompson CJ. Diagnosis and Management of Central Diabetes Insipidus in Adults. J Clin Endocrinol Metab. 2022;107(10):2701-15.
  83. Pivonello R, De Bellis A, Faggiano A, Di Salle F, Petretta M, Di Somma C, et al. Central diabetes insipidus and autoimmunity: relationship between the occurrence of antibodies to arginine vasopressin-secreting cells and clinical, immunological, and radiological features in a large cohort of patients with central diabetes insipidus of known and unknown etiology. J Clin Endocrinol Metab. 2003;88(4):1629-36.
  84. Birk J, Friberg MA, Prescianotto-Baschong C, Spiess M, and Rutishauser J. Dominant pro-vasopressin mutants that cause diabetes insipidus form disulfide-linked fibrillar aggregates in the endoplasmic reticulum. J Cell Sci. 2009;122(Pt 21):3994-4002.
  85. Brachet C, Birk J, Christophe C, Tenoutasse S, Velkeniers B, Heinrichs C, et al. Growth retardation in untreated autosomal dominant familial neurohypophyseal diabetes insipidus caused by one recurring and two novel mutations in the vasopressin-neurophysin II gene. Eur J Endocrinol. 2011;164(2):179-87.
  86. Rohayem J, Ehlers C, Wiedemann B, Holl R, Oexle K, Kordonouri O, et al. Diabetes and neurodegeneration in Wolfram syndrome: a multicenter study of phenotype and genotype. Diabetes Care. 2011;34(7):1503-10.
  87. Ghirardello S, Garrè ML, Rossi A, and Maghnie M. The diagnosis of children with central diabetes insipidus. J Pediatr Endocrinol Metab. 2007;20(3):359-75.
  88. Hilson JB, Merchant SN, Adams JC, and Joseph JT. Wolfram syndrome: a clinicopathologic correlation. Acta Neuropathol. 2009;118(3):415-28.
  89. Bell NH. Endocrine complications of sarcoidosis. Endocrinol Metab Clin North Am. 1991;20(3):645-54.
  90. Smith D, Finucane F, Phillips J, Baylis PH, Finucane J, Tormey W, et al. Abnormal regulation of thirst and vasopressin secretion following surgery for craniopharyngioma. Clin Endocrinol (Oxf). 2004;61(2):273-9.
  91. de Leon J, Dadvand M, Canuso C, Odom-White A, Stanilla J, and Simpson GM. Polydipsia and water intoxication in a long-term psychiatric hospital. Biol Psychiatry. 1996;40(1):28-34.
  92. Sailer C, Winzeler B, and Christ-Crain M. Primary polydipsia in the medical and psychiatric patient: characteristics, complications and therapy. Swiss Med Wkly. 2017;147:w14514.
  93. Bichet DG. Nephrogenic diabetes insipidus. Am J Med. 1998;105(5):431-42.
  94. Sands JM, and Bichet DG. Nephrogenic diabetes insipidus. Ann Intern Med. 2006;144(3):186-94.
  95. Robben JH, Knoers NV, and Deen PM. Cell biological aspects of the vasopressin type-2 receptor and aquaporin 2 water channel in nephrogenic diabetes insipidus. Am J Physiol Renal Physiol. 2006;291(2):F257-70.
  96. Grünfeld JP, and Rossier BC. Lithium nephrotoxicity revisited. Nat Rev Nephrol. 2009;5(5):270-6.
  97. Oiso Y. Transient diabetes insipidus during pregnancy. Intern Med. 2003;42(6):459-60.
  98. Barron WM, Cohen LH, Ulland LA, Lassiter WE, Fulghum EM, Emmanouel D, et al. Transient vasopressin-resistant diabetes insipidus of pregnancy. N Engl J Med. 1984;310(7):442-4.
  99. Davison JM, Sheills EA, Philips PR, Barron WM, and Lindheimer MD. Metabolic clearance of vasopressin and an analogue resistant to vasopressinase in human pregnancy. Am J Physiol. 1993;264(2 Pt 2):F348-53.
  100. Refardt J, and Christ-Crain M. Diabetes insipidus in pregnancy: how to advice the patient? Minerva Endocrinol. 2018;43(4):458-64.
  101. Miller M, Dalakos T, Moses AM, Fellerman H, and Streeten DH. Recognition of partial defects in antidiuretic hormone secretion. Ann Intern Med. 1970;73(5):721-9.
  102. Fenske W, Quinkler M, Lorenz D, Zopf K, Haagen U, Papassotiriou J, et al. Copeptin in the differential diagnosis of the polydipsia-polyuria syndrome--revisiting the direct and indirect water deprivation tests. J Clin Endocrinol Metab. 2011;96(5):1506-15.
  103. Van de Heijning BJ, Koekkoek-van den Herik I, Iványi T, and Van Wimersma Greidanus TB. Solid-phase extraction of plasma vasopressin: evaluation, validation and application. J Chromatogr. 1991;565(1-2):159-71.
  104. Wun T. Vasopressin and platelets: a concise review. Platelets. 1997;8(1):15-22.
  105. Preibisz JJ, Sealey JE, Laragh JH, Cody RJ, and Weksler BB. Plasma and platelet vasopressin in essential hypertension and congestive heart failure. Hypertension. 1983;5(2 Pt 2):I129-38.
  106. Cadnapaphornchai MA, Summer SN, Falk S, Thurman JM, Knepper MA, and Schrier RW. Effect of primary polydipsia on aquaporin and sodium transporter abundance. Am J Physiol Renal Physiol. 2003;285(5):F965-71.
  107. Berliner RW, and Davidson DG. Production of hypertonic urine in the absence of pituitary antidiuretic hormone. J Clin Invest. 1957;36(10):1416-27.
  108. Robertson RP, and Porte D, Jr. The glucose receptor. A defective mechanism in diabetes mellitus distinct from the beta adrenergic receptor. J Clin Invest. 1973;52(4):870-6.
  109. Block LH, Furrer J, Locher RA, Siegenthaler W, and Vetter W. Changes in tissue sensitivity to vasopressin in hereditary hypothalamic diabetes insipidus. Klin Wochenschr. 1981;59(15):831-6.
  110. Zerbe RL, and Robertson GL. A comparison of plasma vasopressin measurements with a standard indirect test in the differential diagnosis of polyuria. N Engl J Med. 1981;305(26):1539-46.
  111. Morgenthaler NG, Struck J, Alonso C, and Bergmann A. Assay for the measurement of copeptin, a stable peptide derived from the precursor of vasopressin. Clin Chem. 2006;52(1):112-9.
  112. Fenske W, and Allolio B. Clinical review: Current state and future perspectives in the diagnosis of diabetes insipidus: a clinical review. J Clin Endocrinol Metab. 2012;97(10):3426-37.
  113. Baylis PH. Diabetes insipidus. J R Coll Physicians Lond. 1998;32(2):108-11.
  114. Baylis PH, Gaskill MB, and Robertson GL. Vasopressin secretion in primary polydipsia and cranial diabetes insipidus. Q J Med. 1981;50(199):345-58.
  115. Timper K, Fenske W, Kühn F, Frech N, Arici B, Rutishauser J, et al. Diagnostic Accuracy of Copeptin in the Differential Diagnosis of the Polyuria-polydipsia Syndrome: A Prospective Multicenter Study. J Clin Endocrinol Metab. 2015;100(6):2268-74.
  116. Fenske W, Refardt J, Chifu I, Schnyder I, Winzeler B, Drummond J, et al. A Copeptin-Based Approach in the Diagnosis of Diabetes Insipidus. N Engl J Med. 2018;379(5):428-39.
  117. Winzeler B, Cesana-Nigro N, Refardt J, Vogt DR, Imber C, Morin B, et al. Arginine-stimulated copeptin measurements in the differential diagnosis of diabetes insipidus: a prospective diagnostic study. Lancet. 2019;394(10198):587-95.
  118. Kurokawa H, Fujisawa I, Nakano Y, Kimura H, Akagi K, Ikeda K, et al. Posterior lobe of the pituitary gland: correlation between signal intensity on T1-weighted MR images and vasopressin concentration. Radiology. 1998;207(1):79-83.
  119. Hannon MJ, Orr C, Moran C, Behan LA, Agha A, Ball SG, et al. Anterior hypopituitarism is rare and autoimmune disease is common in adults with idiopathic central diabetes insipidus. Clin Endocrinol (Oxf). 2012;76(5):725-8.
  120. Lam KS, Wat MS, Choi KL, Ip TP, Pang RW, and Kumana CR. Pharmacokinetics, pharmacodynamics, long-term efficacy and safety of oral 1-deamino-8-D-arginine vasopressin in adult patients with central diabetes insipidus. Br J Clin Pharmacol. 1996;42(3):379-85.
  121. Behan LA, Sherlock M, Moyles P, Renshaw O, Thompson CJ, Orr C, et al. Abnormal plasma sodium concentrations in patients treated with desmopressin for cranial diabetes insipidus: results of a long-term retrospective study. Eur J Endocrinol. 2015;172(3):243-50.
  122. Atila C, Loughrey PB, Garrahy A, Winzeler B, Refardt J, Gildroy P, et al. Central diabetes insipidus from a patient's perspective: management, psychological co-morbidities, and renaming of the condition: results from an international web-based survey. Lancet Diabetes Endocrinol. 2022;10(10):700-9.
  123. Loh JA, and Verbalis JG. Disorders of water and salt metabolism associated with pituitary disease. Endocrinol Metab Clin North Am. 2008;37(1):213-34, x.
  124. Eisenberg Y, and Frohman LA. ADIPSIC DIABETES INSIPIDUS: A REVIEW. Endocr Pract. 2016;22(1):76-83.
  125. Cuesta M, Hannon MJ, and Thompson CJ. Adipsic diabetes insipidus in adult patients. Pituitary. 2017;20(3):372-80.
  126. Batlle DC, von Riotte AB, Gaviria M, and Grupp M. Amelioration of polyuria by amiloride in patients receiving long-term lithium therapy. N Engl J Med. 1985;312(7):408-14.
  127. Crawford JD, and Kennedy GC. Chlorothiazid in diabetes insipidus. Nature. 1959;183(4665):891-2.
  128. Earley LE, and Orloff J. THE MECHANISM OF ANTIDIURESIS ASSOCIATED WITH THE ADMINISTRATION OF HYDROCHLOROTHIAZIDE TO PATIENTS WITH VASOPRESSIN-RESISTANT DIABETES INSIPIDUS. J Clin Invest. 1962;41(11):1988-97.
  129. Rosa RM, Bierer BE, Thomas R, Stoff JS, Kruskall M, Robinson S, et al. A study of induced hyponatremia in the prevention and treatment of sickle-cell crisis. N Engl J Med. 1980;303(20):1138-43.
  130. Usberti M, Dechaux M, Guillot M, Seligmann R, Pavlovitch H, Loirat C, et al. Renal prostaglandin E2 in nephrogenic diabetes insipidus: effects of inhibition of prostaglandin synthesis by indomethacin. J Pediatr. 1980;97(3):476-8.
  131. Winzeler B, Sailer CO, Coynel D, Zanchi D, Vogt DR, Urwyler SA, et al. A randomized controlled trial of the GLP-1 receptor agonist dulaglutide in primary polydipsia. J Clin Invest. 2021;131(20).
  132. Källén BA, Carlsson SS, and Bengtsson BK. Diabetes insipidus and use of desmopressin (Minirin) during pregnancy. Eur J Endocrinol. 1995;132(2):144-6.
  133. Ray JG. DDAVP use during pregnancy: an analysis of its safety for mother and child. Obstet Gynecol Surv. 1998;53(7):450-5.
  134. Waikar SS, Mount DB, and Curhan GC. Mortality after hospitalization with mild, moderate, and severe hyponatremia. Am J Med. 2009;122(9):857-65.
  135. Chawla A, Sterns RH, Nigwekar SU, and Cappuccio JD. Mortality and serum sodium: do patients die from or with hyponatremia? Clin J Am Soc Nephrol. 2011;6(5):960-5.
  136. Corona G, Giuliani C, Verbalis JG, Forti G, Maggi M, and Peri A. Hyponatremia improvement is associated with a reduced risk of mortality: evidence from a meta-analysis. PLoS One. 2015;10(4):e0124105.
  137. Refardt J, Pelouto A, Potasso L, Hoorn EJ, and Christ-Crain M. Hyponatremia Intervention Trial (HIT): Study Protocol of a Randomized, Controlled, Parallel-Group Trial With Blinded Outcome Assessment. Front Med (Lausanne). 2021;8:729545.
  138. Ball SG, and Iqbal Z. Diagnosis and treatment of hyponatraemia. Best Pract Res Clin Endocrinol Metab. 2016;30(2):161-73.
  139. Bartter FC, and Schwartz WB. The syndrome of inappropriate secretion of antidiuretic hormone. Am J Med. 1967;42(5):790-806.
  140. Spasovski G, Vanholder R, Allolio B, Annane D, Ball S, Bichet D, et al. Clinical practice guideline on diagnosis and treatment of hyponatraemia. Eur J Endocrinol. 2014;170(3):G1-47.
  141. Fenske W, Störk S, Koschker AC, Blechschmidt A, Lorenz D, Wortmann S, et al. Value of fractional uric acid excretion in differential diagnosis of hyponatremic patients on diuretics. J Clin Endocrinol Metab. 2008;93(8):2991-7.
  142. Fenske WK, Christ-Crain M, Hörning A, Simet J, Szinnai G, Fassnacht M, et al. A copeptin-based classification of the osmoregulatory defects in the syndrome of inappropriate antidiuresis. J Am Soc Nephrol. 2014;25(10):2376-83.
  143. Nigro N, Winzeler B, Suter-Widmer I, Schuetz P, Arici B, Bally M, et al. Evaluation of copeptin and commonly used laboratory parameters for the differential diagnosis of profound hyponatraemia in hospitalized patients: 'The Co-MED Study'. Clin Endocrinol (Oxf). 2017;86(3):456-62.
  144. Rosner MH. Exercise-associated hyponatremia. Semin Nephrol. 2009;29(3):271-81.
  145. Danz M, Pöttgen K, Tönjes PM, Hinkelbein J, and Braunecker S. Hyponatremia among Triathletes in the Ironman European Championship. N Engl J Med. 2016;374(10):997-8.
  146. Feldman BJ, Rosenthal SM, Vargas GA, Fenwick RG, Huang EA, Matsuda-Abedini M, et al. Nephrogenic syndrome of inappropriate antidiuresis. N Engl J Med. 2005;352(18):1884-90.
  147. Decaux G, Vandergheynst F, Bouko Y, Parma J, Vassart G, and Vilain C. Nephrogenic syndrome of inappropriate antidiuresis in adults: high phenotypic variability in men and women from a large pedigree. J Am Soc Nephrol. 2007;18(2):606-12.
  148. Yee AH, Burns JD, and Wijdicks EF. Cerebral salt wasting: pathophysiology, diagnosis, and treatment. Neurosurg Clin N Am. 2010;21(2):339-52.
  149. Hannon MJ, Behan LA, O'Brien MM, Tormey W, Ball SG, Javadpour M, et al. Hyponatremia following mild/moderate subarachnoid hemorrhage is due to SIAD and glucocorticoid deficiency and not cerebral salt wasting. J Clin Endocrinol Metab. 2014;99(1):291-8.
  150. Verbalis JG, Goldsmith SR, Greenberg A, Korzelius C, Schrier RW, Sterns RH, et al. Diagnosis, evaluation, and treatment of hyponatremia: expert panel recommendations. Am J Med. 2013;126(10 Suppl 1):S1-42.
  151. Ball S, Barth J, and Levy M. SOCIETY FOR ENDOCRINOLOGY ENDOCRINE EMERGENCY GUIDANCE: Emergency management of severe symptomatic hyponatraemia in adult patients. Endocr Connect. 2016;5(5):G4-g6.
  152. Adrogué HJ, and Madias NE. Hyponatremia. N Engl J Med. 2000;342(21):1581-9.
  153. Mohmand HK, Issa D, Ahmad Z, Cappuccio JD, Kouides RW, and Sterns RH. Hypertonic saline for hyponatremia: risk of inadvertent overcorrection. Clin J Am Soc Nephrol. 2007;2(6):1110-7.
  154. Sterns RH, Hix JK, and Silver S. Treating profound hyponatremia: a strategy for controlled correction. Am J Kidney Dis. 2010;56(4):774-9.
  155. Garrahy A, Dineen R, Hannon AM, Cuesta M, Tormey W, Sherlock M, et al. Continuous Versus Bolus Infusion of Hypertonic Saline in the Treatment of Symptomatic Hyponatremia Caused by SIAD. J Clin Endocrinol Metab. 2019;104(9):3595-602.
  156. Baek SH, Jo YH, Ahn S, Medina-Liabres K, Oh YK, Lee JB, et al. Risk of Overcorrection in Rapid Intermittent Bolus vs Slow Continuous Infusion Therapies of Hypertonic Saline for Patients With Symptomatic Hyponatremia: The SALSA Randomized Clinical Trial. JAMA Intern Med. 2021;181(1):81-92.
  157. Garrahy A, Galloway I, Hannon AM, Dineen R, O'Kelly P, Tormey WP, et al. Fluid Restriction Therapy for Chronic SIAD; Results of a Prospective Randomized Controlled Trial. J Clin Endocrinol Metab. 2020;105(12).
  158. Krisanapan P, Vongsanim S, Pin-On P, Ruengorn C, and Noppakun K. Efficacy of Furosemide, Oral Sodium Chloride, and Fluid Restriction for Treatment of Syndrome of Inappropriate Antidiuresis (SIAD): An Open-label Randomized Controlled Study (The EFFUSE-FLUID Trial). Am J Kidney Dis. 2020;76(2):203-12.
  159. Verbalis JG, Greenberg A, Burst V, Haymann JP, Johannsson G, Peri A, et al. Diagnosing and Treating the Syndrome of Inappropriate Antidiuretic Hormone Secretion. Am J Med. 2016;129(5):537.e9-.e23.
  160. Winzeler B, Lengsfeld S, Nigro N, Suter-Widmer I, Schütz P, Arici B, et al. Predictors of nonresponse to fluid restriction in hyponatraemia due to the syndrome of inappropriate antidiuresis. J Intern Med. 2016;280(6):609-17.
  161. Furst H, Hallows KR, Post J, Chen S, Kotzker W, Goldfarb S, et al. The urine/plasma electrolyte ratio: a predictive guide to water restriction. Am J Med Sci. 2000;319(4):240-4.
  162. Rondon-Berrios H, Tandukar S, Mor MK, Ray EC, Bender FH, Kleyman TR, et al. Urea for the Treatment of Hyponatremia. Clin J Am Soc Nephrol. 2018;13(11):1627-32.
  163. Decaux G, Andres C, Gankam Kengne F, and Soupart A. Treatment of euvolemic hyponatremia in the intensive care unit by urea. Crit Care. 2010;14(5):R184.
  164. Pierrakos C, Taccone FS, Decaux G, Vincent JL, and Brimioulle S. Urea for treatment of acute SIADH in patients with subarachnoid hemorrhage: a single-center experience. Ann Intensive Care. 2012;2(1):13.
  165. Schrier RW, Gross P, Gheorghiade M, Berl T, Verbalis JG, Czerwiec FS, et al. Tolvaptan, a selective oral vasopressin V2-receptor antagonist, for hyponatremia. N Engl J Med. 2006;355(20):2099-112.
  166. Sterns RH. Tolvaptan for the Syndrome of Inappropriate Secretion of Antidiuretic Hormone: Is the Dose Too High? Am J Kidney Dis. 2018;71(6):763-5.
  167. Braunwald E. Gliflozins in the Management of Cardiovascular Disease. N Engl J Med. 2022;386(21):2024-34.
  168. Refardt J, Imber C, Sailer CO, Jeanloz N, Potasso L, Kutz A, et al. A Randomized Trial of Empagliflozin to Increase Plasma Sodium Levels in Patients with the Syndrome of Inappropriate Antidiuresis. J Am Soc Nephrol. 2020;31(3):615-24.
  169. Refardt J, Imber C, Nobbenhuis R, Sailer C, Haslbauer A, Monnerat S, et al. Treatment Effect of the SGLT2-inhibitor Empagliflozin on chronic SIAD –results of a double-blind, randomized, crossover, placebo-controlled trial. J Am Soc Nephrolin press. 2022.
  170. Miell J, Dhanjal P, and Jamookeeah C. Evidence for the use of demeclocycline in the treatment of hyponatraemia secondary to SIADH: a systematic review. Int J Clin Pract. 2015;69(12):1396-417.
  171. Ball SG, Vaidja B, and Baylis PH. Hypothalamic adipsic syndrome: diagnosis and management. Clin Endocrinol (Oxf). 1997;47(4):405-9.


Adrenal Insufficiency

ABSTRACT


Adrenal insufficiency (AI) is an uncommon clinical condition resulting from inadequate glucocorticoid secretion or action, either at the basal state or during stress. Hypothalamic-pituitary-adrenal axis disturbance or primary adrenal failure itself is responsible for this condition. AI presentation can range from asymptomatic hormonal dysfunction to adrenal crisis. Prompt diagnosis and management are crucial since AI may be fatal if unrecognized or untreated. Among the various investigations, the appropriate tests should be performed in a timely manner in order to reverse hormonal and metabolic disturbances, treat associated conditions, and prevent acute crises. In this review, we will provide background knowledge regarding pathophysiology, clinical manifestations, underlying etiologies, hormonal investigations, and related treatments in AI.


CLINICAL RECOGNITION


Adrenal insufficiency (AI) is a life-threatening condition characterized by the failure of adrenocortical function. This failure results in impaired secretion of glucocorticoids (GCs) only or of GCs and mineralocorticoids (MCs) and adrenal androgens, which are crucial for energy, salt and fluid homeostasis, and androgenic activity. The disorder may be caused by adrenocortical disease, primary adrenal insufficiency (PAI), known as Addison’s disease, which is a rare disease with reported prevalence in Europe ranging from 39 cases/million in England in 1968 (1) to 221 cases/million in Iceland in 2016 (2), the highest prevalence reported. Depending on the study, the annual incidence of AI in Europe is estimated to range between 4.4 and 6.2 new cases per million people (3,4). AI may be secondary in the setting of conditions affecting the pituitary gland and the secretion of adrenocorticotropic hormone (ACTH) (secondary AI) and/or the hypothalamus and the secretion of corticotropin-releasing hormone (CRH) and/or other ACTH secretagogues such as vasopressin (tertiary AI). Central AI is estimated to have a prevalence between 150 and 280 per million, making it more prevalent than PAI (5-7). A prevalence of AI after pituitary surgery varies, with higher rates of up to 90% after craniopharyngioma surgery, while hypopituitarism has high prevalence after cranial radiation for non-pituitary tumors, but may take several years to develop.


The clinical manifestations of AI depend upon the extent of loss of adrenal function, and whether MCs and androgen production are preserved, whereby the renin-angiotensin-aldosterone system (RAAS) is intact in central AI. The presentation can be acute or insidious, depending on the underlying cause of the adrenal failure. The diagnosis may be delayed until an intercurrent illness, such as serious infection, acute stress, bilateral adrenal infarction, or hemorrhage, precipitates a life-threatening adrenal crisis. The symptoms of PAI are pleiotropic and non-specific, except for salt craving (Table 1).


Adrenal crisis is an acute deterioration in health which is associated with hypotension, acute abdominal symptoms, and marked laboratory abnormalities, which resolve after parenteral glucocorticoid administration. In PAI, the patients may have more severe symptoms which are due to concomitant MCs deficiency. This condition is commonly presented in PAI, but less common in central AI, in which a typical example would be pituitary apoplexy. Retrospective and prospective analysis revealed a prevalence of adrenal crises 6.6-8.3 cases/100 patient-years, with mortality 0.5/100 patient-years, mainly due to gastrointestinal and other infectious diseases (8). A recent retrospective case-control analysis of the European Adrenal Insufficiency Registry (EU-AIR) reported an incidence of adrenal crisis of 6.53 cases per 100 patient-years for PAI and 3.17 cases per 100 patient-years for central AI (9).


A significant feature to clinically differentiate PAI from central AI is skin pigmentation, which is nearly always present in long-standing PAI. The most probable cause of the pigmentation seems to be the increased stimulation of the melanocortin-1 receptor (MC1R) by elevated levels of ACTH itself with its intrinsic α-melanocyte stimulating hormone activity. The rest of the clinical features of secondary and tertiary AI are similar to those of PAI type (Table 1). Rarely, the presentation may be more acute in patients with pituitary apoplexy. Hyponatremia and compensatory water retention may be the result of an “inappropriate” increase in vasopressin secretion. The clinical manifestations of a pituitary or hypothalamic tumor, such as symptoms and signs of deficiency of other anterior pituitary hormones, headache or visual field defects, may also be present.


Another condition with a dissociation in GCs and MCs secretion presenting as AI is congenital adrenal hyperplasia (CAH), with a frequency of adrenal crisis of 5.8 cases/100 patient-years (4.9 cases/100 patient-years after correction for a neonatal salt-wasting crisis) and often respiratory infections, firstly in early childhood, followed by gastrointestinal infections at older ages (10).


Table 1. Symptoms, Physical Findings, and Laboratory Findings Associated with Adrenal Insufficiency

SYMPTOMS AND PHYSICAL FINDINGS

Adrenal crisis: hypotension (< 110mmHg systolic) and syncope/ shock (> 90%); volume depression

Non-specific symptoms:

·       Gastrointestinal symptoms: abdominal pain, flank pain, back pain, or lower chest pain: 86%- may mimic acute abdomen

·       Fever (66%)

·       Anorexia (early feature), nausea, vomiting (47%)

·       Abdominal rigidity or rebound tenderness (22%)

·       Diarrhea, which may alternate with constipation

·       Neuropsychiatric symptoms: Confusion, lethargy, disorientation, coma (42%)

PAI>SAI/TAI


Psychiatric symptoms: memory impairment, depression, anxiety, psychosis,reduced consciousness, delirium

Chronic AI

General malaise, weakness, fatigue, lassitude, generalized weakness

PAI/SAI

Hypoglycemia; increased risk in children, thin women, alcohol abuse, GH deficiency

SAI>>PAI


Sudden severe headache, loss of vision or visual field defect

SAI (pituitary apoplexy)

Skin

·       Hyperpigmentation: sun-exposed or pressure areas, recent scars (after AI manifestation), axillae, nipples, palmar creases, mucous membranes as buccal mucosa

·       Vitiligo (as marker of autoimmune disease)

Chronic PAI

Postural hypotension due to volume depletion, or improvement in blood pressure control in previously hypertensive patients, postural dizziness

PAI>>SAI

Salt craving (22%)

PAI

Autoimmune manifestations: vitiligo, autoimmune thyroid disease, type 1 diabetes, primary ovarian failure, autoimmune gastritis

PAI

Weight loss

Chronic PAI/SAI

Decreased axillary and pubic hair, loss of libido in females (DHEA deficiency), amenorrhea in women (in 25% due to chronic illness, weight loss or associated premature ovarian failure)

PAI/SAI

Auricular calcification


Low grade fever

PAI

Associated endocrinopathies in the context of autoimmune polyglandular syndrome

PAI

LABORATORY FINDINGS

Electrolyte abnormalities:

·       Hyponatremia: 85-90% (PAI: MCs deficiency; CAI: dilutional effect)

·       Hyperkalemia: 60-65% due to MCs deficiency

·       Metabolic acidosis

·       Mild hypercalcemia (uncommon)


PAI/SAIPAI

PAI

PAI

Azotemia

PAI

Liver enzymes abnormalities: may be observed in autoimmune hepatitis

PAI

Changes in blood count:

·       Mild anemia (normocytic normochromic)

·       Eosinophilia

·       Lymphocytosis


TSH with normal or low normal T4 (transient with ACTH; permanent with autoimmune thyroiditis)

PAI

 Erythrocyte Sedimentation Rate


ACTH: adrenocorticotropic hormone; AI: adrenal insufficiency; DHEA: dehydroepiandrosterone); GCs: glucocorticoids; GH: growth hormone; MCs: mineralocorticoids; PAI: primary AI, SAI: secondary AI, T4: thyroxine; TAI: tertiary AI; TSH: thyrotropin stimulating hormone


PATHOPHYSIOLOGY


The majority of cases of PAI are the result of gradual destruction of all three layers of the adrenal cortex. Clinical manifestations of this condition appear when the loss of the adrenocortical tissue of the combined glands is greater than 90%. In the initial phase of chronic gradual destruction, adrenal reserve is decreased, and although the basal steroid secretion is normal, the secretion in response to stress is suboptimal, resulting in inadequate GCs, MCs and androgen production, leading to partial ΑΙ; this is manifested by an inadequate cortisol response during stress. Any major or even minor stressor can precipitate an acute adrenal crisis, followed by a complete AI, since with further loss of adrenocortical tissue, even basal steroid secretion is decreased, leading to the clinical manifestations of the disease. Adrenal hemorrhage or infarction may lead to adrenal crisis, a medical emergency manifesting as hypotension and acute circulatory failure crisis due to MCs deficiency when the appropriate doses of GCs are not met to cover MCs requirements. On the other hand, GCs deficiency may also contribute to hypotension by decreasing vascular responsiveness to angiotensin II, norepinephrine/noradrenaline, and other vasoconstrictive hormones, reducing the synthesis of renin substrate, and increasing the production and effects of prostacyclin and other vasodilatory hormones. Combined GCs and MCs deficiency leads to increased urinary sodium loss and hypovolemia resulting in hypotension and electrolyte imbalance including hyponatremia and hyperkalemia. ‘Inappropriate’ anti-diuretic hormone (ADH) release and action on the renal tubule due to GCs deficiency contributes to the hyponatremia, although it could be argued that this attempt at volume maintenance is far from inappropriate. Low plasma cortisol concentrations reduce GCs negative feedback, which in turn increases the production and secretion of ACTH and other POMC-peptides. These mechanisms are responsible for the well-recognized hyperpigmentation by acting on the MC1R in the skin.


Conversely, ACTH deficiency in central AI leads to decreased secretion of cortisol and adrenal androgens, while MCs production remains normal, as MCs are principally regulated by the RAAS. In the early stages, basal ACTH secretion is normal, while its stress-induced release is impaired. With further loss, there is atrophy of zonae fasciculata and reticularis of the adrenal cortex. Therefore, basal cortisol secretion is decreased but aldosterone secretion by the zona glomerulosa is preserved. However, hypotension in central AI may still occur due to decreased vascular tone as a result of reduced vascular responsiveness to angiotensin II and noradrenaline.


DIAGNOSIS and DIFFERENTIAL DIAGNOSIS


Table 2. Etiology of Primary Adrenal Insufficiency (11-17)

Autoimmune

·      Sporadic: not associated with other autoimmune disorders

·      APS type 1 or autoimmune polyendocrinopathy-candidiasis-ectodermal dysplasia (APECED): Addison’s disease, chronic mucocutaneous candidiasis, hypoparathyroidism, dental enamel hypoplasia, pernicious anemia, alopecia, primary gonadal failure

·      APS type 2 or Schmidt’s syndrome: Addison’s disease, autoimmune thyroid disease, primary gonadal failure, type 1 diabetes, celiac disease, pernicious anemia, myasthenia gravis, vitiligo

·      APS type 4: Addison’s disease with other autoimmune diseases excluding autoimmune thyroid disease and type 1 diabetes

Infections

·       Tuberculosis

·       Fungal infections: histoplasmosis, cryptococcosis, candidiasis, African trypanosomiasis, paracoccidioidomycosis (South America)

·       Syphilis

·       Cytomegalovirus, HIV (up to 5% patients with AIDS)

Metastases

From lung, breast, kidney, colon cancers, melanoma, lymphoma

Infiltrations

·       Sarcoidosis

·       Amyloidosis

·       Haemochromatosis

Intra-adrenal hemorrhage

·       Drugs: anticoagulant, tyrosine kinase inhibitor

·       Trauma

·       Waterhouse-Friderichsen syndrome: mostly associated with meningococcal septicemia

Infarction

Anti-phospholipid syndrome

Hematological disorders

Lymphoma

Adrenoleukodystrophy (ABCD1 and ABCD2 gene mutations): X-linked disorder of very long chain fatty acid (VLCFA) metabolism, presents in childhood, may progress to severe spinal cord problems, adrenomyeloneuropathy (AMN), and cerebral demyelination causing dementia.

Kearns-Sayre syndrome (mitochondrial DNA deletions): progressive external ophthalmoplegia, bilateral pigmentary retinopathy, cardiac conductions, CNS dysfunction, endocrine abnormalities (Addison’s disease, hypogonadism, hypothyroidism, hypoparathyroidism, diabetes mellitus)

Wolman’s disease (LIPA gene mutations): inherited disorder of lysosomal enzyme, presented with abdominal distension from accumulation of foamy lipid droplet in various organs, along with adrenal calcification and malabsorption.

Congenital adrenal hyperplasia (CAH)

Autosomal recessive disorders of enzyme deficiency in adrenal steroidogenesis pathway, which can have various manifestations depending on their subtype and severity. Hence, this disease may be diagnosed in older individuals.

·       21-Hydroxylase deficiency (CYP21A2 gene mutation): the most common type, may be presented with salt wasting form in infancy, or simple virilizing form in later life if neonatal screening is not performed

·       11β-hydroxylase deficiency (CYP11B1 gene mutation): hyperandrogenism with hypertension in older children and adults

·       3β-hydroxysteroid dehydrogenase 2 deficiency (CYP3B2 gene mutation): neonatal wasting, ambiguous genitalia in boys, hyperandrogenism in girls

·       P450 oxidoreductase deficiency (POR gene mutation): abnormal genitalia with or without skeletal malformations, and with or without maternal virilization

·       P450 side-chain cleavage deficiency (CYP11A1 mutations): may be presented with neonatal salt wasting with 46,XY under-androgenization, or later onset of PAI and ambiguous genitalia

·       Congenital lipoid adrenal hyperplasia (StAR gene mutations): may be presented with varied severity of PAI and 46,XY DSD

Congenital adrenal hypoplasia

·       X-linked form (NR0B1 mutations or deletion): variable manifestations, hypogonadotropic hypogonadism, impaired spermatogenesis, hypoaldosteronism, shock

·       Xp21 contiguous gene syndrome (deletion of NR0B1, glycerol kinase and genes for Duchenne muscular deficiency): with psychomotor retardation, hepatic iron deposition

·       SF-1 linked (NR5A1 mutations or deletions): range from isolated adrenal failure to isolated gonadal failure, XY sex reversal, 46,XX DSD, gonadoblastoma, gonadal insufficiency

·       IMAGe syndrome (CDKN1C pathogenic variant): Intrauterine growth restriction, Metaphyseal dysplasia, Adrenal hypoplasia congenita, and Genital abnormalities in males

·       MIRAGE syndrome (SAMD9 pathogenic variant): Myelodysplasia, Infection, Restriction of growth, Adrenal hypoplasia, Genital phenotypes, and Enteropathy)

·       Familial steroid-resistant nephrotic syndrome with AI (SGPL1 mutations)

Inherited unresponsiveness to ACTH syndromes

Familial glucocorticoid deficiency (FGD): autosomal recessive cause of childhood onset AI, hyperpigmentation, hypoglycemia with normal MCs activity.

·       Type 1 variant (MC2R gene mutations)

·       Type 2 variant (MRAP gene mutations)

·       Other variants (MCM4, NNT, TXNRD2, GPX1, PRDX3, partial mutation of StAR and CYP11A1)

·       Triple A or Allgrove syndrome (AAAS gene mutations): Addison’s disease, Achalasia, Alacrima, along with neurodegenerative change with or without mental retardation

Iatrogenic

Bilateral adrenalectomy

Drugs

·       Inhibition of steroidogenesis: ketoconazole, fluconazole, etomidate, aminoglutethimide, suramin

·       Acceleration of cortisol metabolism: phenytoin, phenobarbital, thyroxine, rifampicin, St John’s Wort (Hypericum perforatum)

·       Promotion of adrenolytic activity: mitotane

·       Enhancement of autoimmunity: CTLA-4 inhibitors


Table 3. Etiology of Central Adrenal Insufficiency (18,19)

Pituitary, parasellar and hypothalamic masses

·       Pituitary adenomas, rarely carcinomas

·       Parasellar lesions: cysts, craniopharyngioma

·       Nonadenomatous neoplasms: meningioma, chordoma, glioma, germinoma, pituicytoma

·       Metastases: breast, lung, prostate, colon, lymphoma

Infections

·       Pituitary abscess: Gram-positive cocci

·       Tuberculosis

·       Syphilis, leptospirosis

·       Fungal infections: candidiasis, aspergillosis

·       Herpes/Varicella infection, SARS-CoV-2 virus

Infiltrations

·       Hypophysitis: lymphocytic, granulomatous, xanthomatous, necrotizing, IgG4-related, immunotherapy-induced, other autoimmune-associated

·       Hemochromatosis

·       Sarcoidosis

·       Histiocytosis X

·       Wegener’s granulomatosis

Hemorrhage

·       Pituitary apoplexy

Infarction

·       Sheehan’s syndrome

Iatrogenic

·       Pituitary surgery

·       Pituitary irradiation

Drugs

·       Steroid

·       Mifepristone: impaired GCs signal transduction

·       Somatostatin analogues

·       Opiates

·       Antipsychotics and antidepressants

Trauma

·       Traumatic brain injury

Transcription factor mutations

Hereditary ACTH deficiency can manifest as an isolated pituitary defect or as a combination of pituitary hormone deficiencies.

·       HESX1: panhypopituitarism, cognitive change, septo-optic dysplasia

·       OTX2: panhypopituitarism, neonatal hypoglycemia, pituitary hypoplasia, ectopic posterior pituitary

·       LHX4: panhypopituitarism

·       PROP1: panhypopituitarism

·       SOX3: panhypopituitarism, infundibular hypoplasia, mental retardation

·       TBX19: isolated ACTH deficiency

POMC and related processing

·       POMC gene mutations: AI, severe early-onset obesity, hyperphagia, red hair, pale skin

·       PC1 mutations: AI, abnormal glucose metabolism, early-onset obesity, hypogonadotropic hypogonadism, neonatal-onset persistent malabsorptive diarrhea

Prader-Willi syndrome: hypotonia, failure to thrive, obesity, multiple endocrine abnormalities (GH deficiency, central hypothyroidism, hypogonadotropic hypogonadism, central AI)

Familial corticosteroid binding-globulin deficiency: unexplained fatigue, hypotension

Idiopathic hypopituitarism

ACTH, adrenocorticotropic hormone; AI, adrenal insufficiency; APS, autoimmune polyglandular syndrome; CAH, congenital adrenal hyperplasia; DHEA, dehydroepiandrosterone; DSD, disorders of sexual development; GCs, glucocorticoids;GH, growth hormone; HPA, hypothalamic-pituitary-adrenal; MCs, mineralocorticoids; PAI, primary AI; POMC, pro-opiomelanocortin; TSH, thyrotropin stimulating hormone.


When an adrenal crisis is present, there is no need for immediate investigation to confirm AI but treatment should be initiated without delay as soon as clinically suspected. Clinical suspicion could be the case of a cancer patient under treatment with immunotherapy, particularly with the anti-CTLA-4 agent ipilimumab and signs and/or symptoms suspicious for AI, where the differential diagnosis of the rare metastatic involvement of adrenal or pituitary gland has to be also considered (20,21). In any case, confirmatory testing should be deferred until the patient has been stabilized; however, a blood sample taken at this time for cortisol and ACTH levels is extremely helpful for later assessment. In cases of insidious presentation, clinical suspicion of AI should be followed by diagnostic dynamic tests to confirm the inappropriately low cortisol secretion and whether cortisol deficiency is dependent or independent of ACTH deficiency by measuring ACTH levels (Table 4). In PAI, cortisol deficiency results in decreased feedback to the HPA axis, leading to increased secretion of ACTH to stimulate the adrenal cortex. Simultaneously, MCs deficiency causes increased release of renin by the juxtaglomerular apparatus of the kidneys.


In a non-acute setting, the diagnosis should be suspected based on the patient’s history and physical examinationalong with low morning cortisol levels, and confirmed by an ACTH stimulation test. Basal morning cortisol levels lower than 3μg/dL suggest ACTH deficiency. Conversely, morning cortisol higher than 15μg/dL indicates sufficient ACTH reserve. However, random cortisol levels are not advised for the diagnosis of AI. Additional tests are required to establish the diagnosis of AI if the cortisol levels are in the range of these cut-offs. Based on the pathophysiology, different dynamic tests have been proposed to diagnose this condition.


The classic short Synacthen test (SST; 250μg of ACTH [1-24], i.m. or i.v.) is considered the standard diagnostic method to detect AI, with a sensitivity of 92% (95% confidence interval, 81–97%) for the diagnosis of AI (22). On the other hand, no statistically significant difference was found between low-dose and high-dose ACTH stimulation tests (23,24). Low levels for age and sex of dehydroepiandrosterone sulphate (DHEAS) concentration (or less frequently, dehydroepiandrosterone, DHEA) represents an additional marker to increase the level of suspicion of PAI, but it is not per se diagnostic. A CRH test may also be used, but is less common and has limited availability, while a prolonged ACTH stimulation test is rarely required other than to distinguish secondary or tertiary deficiency (Table 4).


The insulin-induced hypoglycemia or insulin tolerance test (ITT), also previously known as the gold standard test, is performed by injecting 0.1 or 0.15u/kg of short-acting insulin intravenously after overnight fast, followed by serial measurements of venous glucose and cortisol over 2 hours. Importantly, this procedure must only be used if there is adequate supervision and experience. However, the ITT is beneficial in assessing growth hormone (GH) response simultaneously in patients with suspected co-existing deficiency in secondary AI, in which GH may not exceed 3-5μg/dL. It must be emphasized that all normative values quoted are assay-dependent, and using immunoassays or liquid chromatography with tandem mass spectrometry (LC-MS/MS) may result in a lower cut-off than the historic value of 18μg/dL derived from polyclonal antibody assay (25). Further investigations such as imaging studies, auto-antibodies, or microbiological screening should be arranged accordingly to identify the underlying cause of AI.


Table 4. Diagnostic Tests Used to Diagnose and Differentiate AI

Test/ procedure

Interpretation of the result/ comments

Cortisol physiologic response

Adrenal testing

Morning serum cortisol levels at 8-9am in combination with plasma ACTH

·   8-9am cortisol levels < 3μg/dL (80nmol/L) suggest AI (26).

·   In recent onset central AI within 4-6 weeks or severe stress such as sepsis, a ‘normal’ level may still indicate AI.

·   ACTH levels > 300ng/L (66pmol/L) or > 2-fold the ULN confirms PAI.

·       Cortisol levels > 14.5μg/dL (400nmol/L) indicates normal HPA axis (27).

·       Morning cortisol levels in early postoperative pituitary surgery higher than 10µg/dL (275nmol/L) are a predictor of corticotroph reserve (28,29).

SST or cosyntropin test or ACTH test; sampling at 8-9am for cortisol and ACTH level following by 250μg Synacthen for adults, children ≥ 2y of age (15μg/ kg for infants, 125μg for children < 2y of age) ACTH i.v. or i.m.; collect samples at 0, 30 and 60min for cortisol levels.

·       Peak cortisol levels < 18μg/dL indicate AI (depending on assay) (26).

·       Indicated when morning cortisol levels 3-15μg/dL.

·       Recent-onset central AI may produce a normal response.

·       SST can be performed at any time of the day but testing for cortisol levels should be collected at least 18–24 h after the last HC dose or longer for GCs.

·       Peak cortisol levels > 18µg/dL (430-500nmol/L) at 30 or 60 minutes (depending on assay).

·       Pregnancy: higher diagnostic cortisol cut-offs of 25μg/dL (700 nmol/L), 29μg/dL (800 nmol/L), and 32μg/dL (900nmol/L) for the first, second, and third trimesters, respectively (30).

Low-dose SST; 1μg ACTH i.v.; collect samples at 0, 30min for cortisol levels (31).

·       Peak cortisol levels < 18μg/dL indicate AI (depending on assay).

·       Indicated when suspected recent-onset central AI or a shortage of Synacthen itself.

·       Insufficient response to low-dose SST should be considered for other dynamic tests.

·       Peak cortisol level > 18µg/dL (500nmol/L)

Pituitary testing

CRH stimulation test; 1µg/kg or 100µg ovine or human CRH i.v.; collect samples at -5, -1, 0, 15, 30, 60, 90, and 120min for cortisol and ACTH levels (32).

·       Central AI demonstrates low ACTH levels that do not respond to CRH.

·       PAI shows high ACTH levels that rise after administration of CRH.

·       Limited use due to wide variation of responses.

·       Peak ACTH response should be 2-4 folds above baseline at 15 or 30min.

·       Peak cortisol level > 20µg/dL between 30 and 60min or incremental cortisol > 10µg/dL above baseline (33).

Prolonged ACTH stimulation test;

(A) 8-h protocol - 1mg depot Synacthen i.m. or 250μg cosyntropin i.v. infusion over 8h; collect serum samples hourly for cortisol and additional samples at 0, 1, 7, 8h for plasma ACTH levels.

(B) 24-h protocol - cosyntropin 250μg i.v. infusion over 24h on 2 or 3 consecutive days; take blood sample for 9am cortisol and ACTH level; then blood sample for serum cortisol levels at 30min, 60min, 120min, 4h, 8h, 12h and 24h.

·       Central AI illustrates a delayed response and typically has a much greater value at 24 and 48 hours than at 4 hours.

·       PAI shows no response at either time.

·       Useful in differentiating primary from central AI when ACTH level is equivocal

·       Helpful in detecting more subtle degrees of AI than standard SST.

A: serum cortisol levels > 20μg/dL (550nmol/L) at 30min, 60min; 25μg/dL (695nmol/L) at 6-8h after initiation of infusion (34,35).

B: serum cortisol levels at 4h > 36μg/dL (1000nmol/L) with no further increase beyond this time (36).

Hypothalamic testing

ITT; insulin 0.1-0.15 U/kg i.v. is administrated after overnight to achieve symptomatic hypoglycemia and blood glucose level lower than 40mg/dL (<2.2mmol/L); collect blood samples at -15, 0, 15, 30, 45, 60, 90 and 120min for glucose, cortisol, ACTH.

Repeat insulin dose if blood glucose does not fall to level of less than 40mg/dL at 45 min

·       AI is confirmed when a fall of glucose to less than 40mg/dL with corresponding an inability to demonstrate a cortisol response higher than 18μg/dL (37). Contraindications in patients with

basal cortisol < 3μg/dL, untreated hypothyroidism, electrocardiographic evidence or history of ischemic heart disease, or seizure.

·       Useful in diagnosis of coexisting GH deficiency.

Peak cortisol levels > 18μg/dL (500nmol/L).

Overnight metyrapone test; 30mg/kg (max 3g) metyrapone is given at midnight; serum cortisol, 11-deoxycortisol, and ACTH levels are measured at 8am the following day.

·       Alternative test when ITT is contraindicated.

·       Test is valid only when cortisol levels fall to lower than 10μg/dL.

·      Peak ACTH response > 200ng/L

·      11-deoxycortisol level > 7mg/dL

·      Sum of cortisol and 11-deoxycortisol should exceed 16.5μg/dL (38).

17-OHCS, 17-hydroxycorticosteroids; ACTH, adrenocorticophic hormone; AI, adrenal insufficiency; CBG, cortisol-binding globulin; CRH, corticotrophin releasing hormone; HC, hydrocortisone; h-CRH, human CRH; GCs, glucocorticoids; GH, growth hormone; i.m., intramuscular; ITT, insulin tolerance test; i.v., intravenous; MCs, mineralocorticoids; PAI, primary AI; SST, short Synacthen test; ULN, upper limit of normal.


The notion of Critical Illness-Related Corticosteroid Insufficiency (CIRCI) emerged to describe impairment of the HPA axis during critical illness that is characterized by the dysregulated systemic inflammation caused by the inadequate intracellular GC-mediated anti-inflammatory activity. The Society of Critical Care Medicine (SCCM) and European Society of Intensive Care Medicine (ESICM) have updated the guideline for the diagnosis and management of CIRCI, which was originally proposed in 2008 (39). The task force makes no recommendation on whether to use delta cortisol after SST or random plasma cortisol levels of less than 10μg/dL to diagnose CIRCI. However, some cohort studies found that patients with CIRCI had poorer outcomes than patients without CIRCI when total cortisol levels are less than 10μg/dL or delta cortisol after SST < 9μg/dL. This evidence may be helpful in deciding upon replacement treatment when CIRCI is suspected (Table 5) (40,41). Other diagnostic tests, such as salivary cortisol or serum ACTH, are not recommended to diagnose this condition. Additionally, markers of inflammation and coagulation, morbidity, length of intensive care unit (ICU) stay, and mortality should be taken in consideration. Nevertheless, this whole concept has been questioned, especially since cortisol-binding globulin and albumin are invariably decreased in severe critical illness, implying that simple measurement of total cortisol is likely to be an inaccurate reflection of the true state of the HPA axis. However, the guideline cautions against using plasma free cortisol levels rather than plasma total cortisol levels to diagnose CIRCI. Most recent evidence suggests that CIRCI is not a useful diagnostic or therapeutic description, and that during the acute phase of the response to severe sepsis there is no failure of the HPA axis and no need for corticosteroid therapy, although in the recovery phase this may become important.


Table 5. Tests Used in Adrenal Insufficiency in Critical Illness (but see text above)

Test

Indicators for poorer outcome

Cortisol

Random levels < 10μg/dL (275nmol/L)

SST

Delta peak/basal levels < 9μg/dL (250nmol/L)

SST: short Synacthen test


In the context of the different diseases associated with AI, additional investigations may be necessary (Table 4). CT scanning of adrenals should be performed to identify infectious diseases such as tuberculosis, tumors, or adrenal hemorrhage.


Table 6. Additional Studies Used in Patients with AI

Primary AI

Specific tests for autoimmune antibodies

·       Autoantibodies against CYP21A2 for the vast majority of autoimmune PAI.

·       Other antibodies against 17-hydroxylase and side-chain-cleavage enzyme are also identified.

·       It should be note that tests for autoantibodies are not standardized.

Other autoimmune markers and hormonal assays for evidence of APS

·       Autoantibodies against IFNa and IFNw for APS-1.

·       Serum calcium and PTH for hypoparathyroidism.

·       Autoantibodies for autoimmune thyroid disease and thyroid function test.

·       Autoimmune for insulin, GAD65, ICA, and ZnT8 along with blood glucose for autoimmune diabetes.

·       Antibody against parietal cell with or without intrinsic factor antibody for pernicious anemia.

·       Antibodies to tissue transglutaminase and anti-endomysial IgA antibody for celiac disease.

·       Liver function along with ANA, SMA, and anti-LKM1 antibodies for autoimmune hepatitis in those with abnormal liver biochemical tests.

Microbial and serological tests

·       Tuberculosis (tuberculin testing, early morning urine samples cultured for Mycobacterium tuberculosis)

·       Other infective cause.

CT / MRI scan

·       Calcified adrenals can be found in infection, hemorrhage, and malignancy.

·       Large adrenals with or without calcification can be seen in metastatic deposits and early phase of infection.

·       Small atrophic glands with calcified foci are commonly illustrated in chronic stage of infection.

·       Adrenal hemorrhage shrinks and attenuates gradually on CT and has a variable appearance on MRI depending on the stage of blood products.

·       Adrenal venous thrombosis, in turn raises internal pressure, resulting in the same hemorrhagic finding.

Chest radiograph

·       Clue for pulmonary manifestation of tuberculosis or fungal infection.

CT guided adrenal biopsy

·       Useful in confirming the diagnosis of adrenal metastasis from extra-adrenal malignancy, or certain infiltrations such as histoplasmosis.

Adrenoleukodystrophy

·       Circulating levels of VLCFA.

17-OH progesterone and 24-hour urine steroid profile

·       Classic CAH.

Secondary AI

Pituitary hormonal assessment

·       Pituitary hormone producing tumor or co-existing pituitary hormone deficiency.

Pituitary MRI scans

·       Pituitary or parasellar lesion.

Biopsy of pituitary

·       Occasionally necessary such as hypophysitis.

Other Investigations

Measurement of plasma renin and aldosterone in PAI to determine MCs reserve

·       High renin levels in combination with an inappropriately normal or low aldosterone concentration suggests PAI.

·       In early phase of evolving PAI, MCs deficiency may predominate and may be the only sign.

Measurement of serum DHEAS

·       Decreased DHEAS levels in women in both PAI (direct effect on adrenal cortex) and central AI (decrease in ACTH stimulus).

AI, adrenal insufficiency; ANA, antinuclear antibodies; anti-LKM, anti-liver microsomal; APS, autoimmune polyglandular syndrome; CAH, congenital adrenal hyperplasia; CT, computerized tomography; DHEAS, dehydroepiandrosterone sulphate; MRI, magnetic resonance imaging; SMA, anti-smooth muscle antibodies; VLCFA, very long-chain fatty acids.


As previously stated, laboratory tests should be interpreted with caution in specific situations, such as those affecting CBG concentration. Low CBG levels are commonly found in conditions characterized by inflammation, nephrotic syndrome, liver disease, the immediate postoperative period or requiring intensive care, or rare genetic disorders, whereas estrogen, pregnancy and mitotane can raise CBG levels. Systemic estrogen-containing drug prescriptions should be discontinued at least four weeks prior to testing. However, using an estrogen patch has no effect on CBG levels. Different diagnostic criteria should be considered according to the cortisol assay. If patients are currently on GCs replacement, omitting the steroid dose before testing is advised. The evening and morning dose of HC or prednisolone should be omitted, whereas the duration of drug withdrawal in patients taking other synthetic GCs may be longer. In pregnancy, higher diagnostic cortisol cut-offs of 25μg/dL (700nmol/L), 29μg/dL (800nmol/L), and 32μg/dL (900nmol/L) should be considered for the first, second, and third trimesters, respectively (30). In pituitary diseases, testing of GCs reserve is suggested before and after initiation of GH replacement or upon documentation of an unexplained improvement in co-existing diabetes insipidus (DI).


THERAPY


Acute Adrenal Insufficiency (Adrenal Crisis)


Adrenal insufficiency is a potentially life-threatening medical emergency when presented as an adrenal crisis, which requires prompt treatment with HC and fluid replacement. When clinical suspicion exists, treatment should be initiated without any delay while awaiting definitive proof of diagnosis. Blood samples should be obtained for later cortisol concentration measurements, and the management approach should be similar to that of any critically ill patient (Table 7, 8).


Table 7. Treatment of Acute Adrenal Insufficiency (Adrenal Crisis) - Management During Resuscitation of Critically Ill Patient.

Maintain airway and breathing.

·       Correct hypovolemia and reverse electrolyte abnormalities; caution should be taken in correcting chronic hyponatremia (not more than 12mmol in 24h, preferably < 8mmol) to prevent central pontine myelinolysis.

·       Replace glucocorticoid; clinical improvement especially blood pressure should be seen within 4-6h.

·       The half-life of HC is 90min after i.v. injection, and more prolonged after i.m. administration; switch to oral HC 40mg in the morning and 20mg in the afternoon if oral intake is resumed; taper to a standard dose of 10-20mg on awakening and 5-10mg in the early afternoon if there is no other major illness.

·       Some experts recommend dexamethasone while dynamic tests are awaited, as dexamethasone does not interfere with the assay, but HC is preferred for its MCs activity.

·       Regarding the electrolyte imbalances, no need for fludrocortisone replacement in an acute crisis since the MCs activity of HC and 0.9% NaCl infusion is sufficient.

Establish i.v. access with two large bore cannulas.

Collect venous blood samples for urea and electrolytes, glucose, full blood count, bicarbonate, infection screen, and store samples (plasma cortisol and ACTH measurement). Do not wait for blood results.

Rapid infusion of 1L isotonic saline solution (0.9% NaCl) within the 1st hour, followed by continuous i.v. isotonic saline solution guided by individual patient needs; usually infuse 2-3 L of normal saline solution within 12 hours; after this, fluid management should be guided by volume status, urine output and biochemical results; 50g/L (5%) dextrose in saline solution if there is evidence of hypoglycemia.

Inject i.v. 100mg of HC immediately (50-100mg/m2 for children) and then followed by 200mg/day (50–100mg/m2/d for children divided q 6h) of HC (via continuous i.v. therapy or 6-8 hourly i.v. injection) for 24h, reduce to HC 100mg/day on the following day; i.m. administration should be used if venous access is not possible; prednisolone may be used as an alternative drug if unavailable HC; dexamethasone is the least preferred and should be given only if no other glucocorticoid is available.

Use additional supportive measures as needed

For hypoglycemia

·       Dextrose 0.5-1g/kg of dextrose or 2-4mL/kg of D25W should be infused slowly at rate of 2-3mL/min; standard initial glucose dose is 25g.

Cardiac monitoring.

MCs replacement is not required if the HC dose exceeds 50mg/day.

ACTH, adrenocorticotropic hormone; HC, hydrocortisone; i.m., intramuscular; i.v., intravenous; MCs, mineralocorticoid.


Table 8. Treatment of Acute Adrenal Insufficiency (Adrenal Crisis) - After Patient Stabilization

Continue i.v. 0.9%NaCl; rate may be slower and maintained for 24-48h.

Search for and treat possible infectious precipitating causes of adrenal crisis; treat any associated condition(s).

Perform SST to confirm the diagnosis.

Differential diagnosis if needed.

Taper parenteral glucocorticoids over 1-3 days, depending on precipitating illness.

After the first 24 hours, HC dose can be reduced to 50mg q 6h and switched to oral HC 40mg in the morning and 20mg in the afternoon, then tapered to a standard dose of 10mg on awakening, 5mg at lunchtime and 5-10mg in the early afternoon.

In aldosterone deficiency, begin MCs replacement with fludrocortisone (100μg by mouth daily) when saline infusion ceased to prevent sodium loss, intravascular volume depletion and hyperkaliemia.

However, MCs replacement is not required if the HC dose exceeds 50mg/day.

ACTH, adrenocorticopic hormone; HC, hydrocortisone; i.m., intramuscular; i.v., intravenous; MCs, mineralocorticoids; SST, short Synacthen test.


Management of Chronic or Insidious Onset of Adrenal Insufficiency

The aim of replacement treatment in AI is to mimic the normal cortisol secretion rate, which is around 5-8mg/m2/day(42,43). Previously this rate was thought to be approximately 25-30mg/day of HC, but normal cortisol production rates seem to be about 8-15mg/day. Most patients can cope with less than 30mg/day (usually 15-25mg/day in divided doses). Doses are usually given upon waking with a smaller dose at lunchtime and then one in late afternoon. Weight-adjusted dosing may be associated with a better safety profile. Despite the various types of cortisol replacement regimens, no head–to-head comparison data is available to advocate one over the other. Decisions regarding the form and dose of GCs replacement therapy are based on crude end-points such as weight, well-being, and blood pressure,as well as on local availability, cost and clinical need (Table 9). Bone mineral density may be reduced on conventional doses of 30mg/day HC, highlighting the importance of aiming for effective but safe doses. Long-duration GCs can be administered once daily but may be associated with higher risk of side effects. Patients should be monitored for clinical symptoms.


Table 9. Glucocorticoid Replacement Schemes

Drug profile

Commonly used doses

Immediate-release HC (Hydrocortisone)

Short acting, given in 2-3 divided doses; this biologically active GCs approximately mimics the endogenous diurnal rhythm; obese individuals may require more GCs replacement than lean individuals; higher frequency regimes and size-based dosing may be beneficial in individual cases; high doses in the evening may disturb sleep and alter metabolism.

15-25 mg or 5-8 mg/m2/day; the highest dose in the morning on

awakening, the next in the early afternoon (2h after lunch) (2-dose regime) or at lunch and afternoon but not later than 4-6h before bedtime) (3-dose

regime); usually 10mg upon awakening, 5mg at lunchtime and 5mg in the late afternoon.

Dual-release HC (combination of immediate-release HC in the

outer-layer coat and extended-release core, PlenadrenÒ) (44,45).

Given once daily in the morning; resulting in higher morning and lower evening cortisol levels with no overnight cortisol rise. This may be advantageous in patients with high risk of metabolic comorbidities and in patients with poor administrative compliance.

20-30mg; lower dose may be sufficient in patients with some remaining endogenous cortisol production; identical total daily dose may be given when switching and clinical response needs to be monitored due to lower bioavailability than HC.

Modified-release HC

(delayed and sustained release in multiple microcrystals with polymer sheathing,

ChronocortÒ) (46).

Given twice daily as a “toothbrush regime”, with 2/3 of the total daily dose before bedtime (11p.m.) and 1/3 administered in the morning (7a.m.), resulting in overnight rise with morning peak of cortisol and near physiological cortisol levels throughout the day. This is beneficial for CAH patients since it prevents the ACTH-driven excess production of adrenal androgens.

Usual dose of HC; then titrated based on symptoms and 17OHP along with androstenedione measurement. (Phase 3 study)

Cortisone acetate (47).

Short acting but longer than HC; the peak of serum cortisol level is delayed compared to HC since the oral form requires a conversion to cortisol at liver to become active; available in oral preparation only.

20-35mg in 2-3 divided doses.

Prednisolone /prednisone

Long-acting, once-daily dose is sufficient; some may need additional 2.5mg in the evening; does not mimic diurnal rhythm of endogenous cortisol; better choice in patients with poor administrative compliance or in patients with poor quality of life on HC replacement; prednisone must be processed in liver to become prednisolone which is then able to cross the cellular membrane; cross-reaction occurs in most cortisol assays.

3-5mg once daily on waking.

Dexamethasone

Inter-individual variable metabolism makes it difficult to predict the adequate dose; dose needs to be titrated if patient is on hepatic enzyme inducing medications; it is not recommended in PAI because of risk of Cushingoid side effects; concurrent fludrocortisone replacement is necessary in PAI patients if dexamethasone is undeniable.

0.25-0.75mg once daily.

MCs replacement

(Fludrocortisone) (48).

Required only in PAI; doses may need to temporary increase by 50-100% in hot weather or conditions that promote excessive sweating; available in oral preparation only; if parenteral action required, use DOCA if available.

50-200μg (median 100μg) once daily in the morning with starting dose at 50-100μg.

Androgen replacement (DHEA) (49,50).

A trial of replacement can be offered to PAI women with low energy, low mood, and low libido, despite otherwise optimized GCs and MCs replacement; some evidence of benefit; not generally available on prescription, but obtained as a ‘health food’ supplement.

25–50mg as a single oral dose in the morning; replacement should be discontinued if no clinical benefit after initial 6-month trial.

AI, adrenal insufficiency; DHEA, dehydroepiandrosterone; DOCA, deoxycorticosterone acetate; GCs, glucocorticoids; i.m., intramuscular; i.v., intravenous; HC, hydrocortisone; MCs, mineralocorticoids; PAI, primary adrenal insufficiency.


It should be noted that while HC and prednisolone are active GCs, cortisone acetate and prednisone require activation via hepatic 11β-hydroxysteroid dehydrogenase type 1 to become biologically active.


Another novel aspect on the management of the chronic AI is the development in glucocorticoid formulation. A dual-release HC preparation that can be administered once daily upon awakening, Plenadren® (developed by Duocort, Viropharma, Shire Pharmaceuticals), which was approved for treatment of AI in adults since 2011. Moreover, another delayed- and sustained-release preparation of HC, ChronocortÒ, given twice daily before bedtime and in the morning, is currently undergoing the approval process for treatment of CAH patients (Table 9). Advances in understanding of the normal cortisol circadian rhythm in the setting of endogenous clock genes, as well as its importance in controlling innate immunity, metabolism, and stress may imply that some of these GCs replacement formulas will be superior over the traditional ones in the future.


One important aspect of the management of chronic PAI is patient and family education. Careful instructions should be given to up-titrate the daily dose in the event of intercurrent febrile illness, accident, or severe mental stress, such as an important examination (Table 10). If the patient is vomiting and cannot take medication by mouth, parenteral HC must be given urgently. Ideally, patients should wear a ‘medical-alert’ bracelet or necklace and carry the Emergency Medical Information Card, which should provide information on the patient’s diagnosis, prescribed medications and daily doses, and the physician involved in the patient’s care. Patients should also have supplies of HC for emergencies, and should be educated about how and when to administer them by the subcutaneous route. Rectal suppositories of prednisolone 100 mg, enemas of prednisolone 20mg/100mL, or HC acetate enema 10% have also been used, but they are clearly ineffective when diarrhea is present.


Table 10. Glucocorticoid Replacement Schemes During Illness


Examples of commonly used schemes

During minor illness


Increase dose by 2-3 times of usual

dosage for 3 days; do not change MC dose.

HC 25-75mg/day twice daily per oral, then taper rapidly to maintenance dose as patient recovers (usually 1-2 days); HC 50mg/m2/day i.m. or double/triple HC replacement doses in children.

During minor-to-moderate surgery

HC 50-100mg/day twice daily per oral or i.v., then taper rapidly to maintenance dose as patient recovers.

During major illness

Increase dose up to 10 times of usual dosage with continuous infusion of HC, or equivalent dexamethasone dosage, then decrease dose by half per day, to usual maintenance dose. Half dose 2nd postoperative day, maintenance dose 3rd postoperative day.

HC 100mg i.v., followed by continuous i.v. infusion of 200mg HC in 24h, then taper rapidly by half per day regarding course of illness; alternative administration of HC 50mg iv. or i.m. q 6h may be considered.

Major surgery with general anesthesia

HC 100mg i.v. just before induction of anesthesia, followed by continuous i.v. infusion of 200mg HC in 24h (alternatively 50mg every 6h i.v. or i.m.); then taper rapidly by half each day and switch to oral regime depending on clinical state; children: HC 50mg/m2 i.v. followed by HC 50–100mg/m2/d divided q 6h. Weight-appropriate continuous i.v. fluids with 5% dextrose and 0.2 or 0.45% NaCl.

Uncomplicated, outpatient dental procedures under local anesthesia and most radiologic studies

No extra supplementation is required.

Severe stress or trauma

Inject prefilled dexamethasone (4-mg) syringe.

Moderately stressful procedures (barium enema, endoscopy, or arteriography)

Extra supplementation is required only before the procedure.

100mg i.v. dose of HC just before the procedure

Pregnancy

HC should be increased 5-10mg/day in the last trimester (20–40% from the 24th week onward) to mimic physiologic increase in free cortisol; fludrocortisone dose adjustment may need in response to serum sodium and potassium levels; HC is preferred over the other GCs, whereas dexamethasone is warned as a contraindication since it is not inactivated in the placenta and can transfer to the fetus.

·       Last trimester: 5-10mg/day of HC usually (20–40% from the 24th week onward)

·       Laboratory: HC stress dosing with HC 100mg i.v. bolus, followed by continuous i.v. infusion of 200mg HC in 24h, and rapidly taper to pre-pregnancy doses after delivery.

HC, hydrocortisone; i.m., intramuscularly; i.v., intravenously; GCs, glucocorticoids


Regarding MC replacement therapy, the dose of fludrocortisone is titrated individually based on clinical examination, mainly body weight and blood pressure, and the levels of plasma renin activity (PRA).


Hydrocortisone is generally preferred for use in patients with AI because it has both GCs and MCs activity. Patients receiving prednisone or prednisolone, on the other hand, may require additional fludrocortisone due to their relatively low MCs activity. Notably, dexamethasone should not be used to treat PAI patients because its lack of MCs activity (51). After resolution of an adrenal crisis, the adequacy of MC replacement should be assessed by measuring supine and erect blood pressure, electrolytes and PRA. Inadequate fludrocortisone dose may cause postural hypotension with elevated PRA, whereas excessive administration results in the opposite. Mineralocorticoid replacement therapy is frequently neglected in patients with adrenal failure. The dose may be temporarily increased in the summer along with an increase in salt intake, particularly if patients are exposed to temperatures above 30ºC (85ºF) or other conditions causing increased sweating. Newborns and children may also require higher fludrocortisone because MCs sensitivity is lower.


In chronic central AI, GCs replacement is similar to that in PAI; however, measurement of plasma ACTH concentrations cannot be used to titrate the optimal GCs dose. Replacement of other anterior pituitary deficits may be also necessary, while changing doses of growth hormone and thyroxine may affect the GCs requirements. More specifically, the HPA axis should be evaluated prior to and following the initiation of GH replacement therapy since GH inhibits the conversion of cortisone to cortisol. Consequently, patients receiving GCs replacement may require higher doses once GH treatment is introduced (18,52).


For patients with either primary or central AI, the beneficial effects of adrenal androgen replacement therapy with 25 to 50mg/day of DHEA have been reported. To date, the reported benefit is principally confined to female patients and includes improvement in sexual function and well-being, but the effects are variable.


In children with PAI, HC in three or four divided doses with total starting daily dose of 8mg/m2 body surface area are preferred over synthetic long-acting GCs, such as prednisolone or dexamethasone. In the case of documented aldosterone deficiency, fludrocortisone treatment with a typical dosage of 100μg/day without body surface area adjustment is suggested, while sodium chloride supplements are needed in the newborn period until the age of 12 months. Most experience has been gained from the treatment of children with CAH; however, since in this case under treatment is confirmed by hyperandrogenism higher GCs therapy is usually given (22).


Other therapies have been studied such as rituximab with or without depot tetracosactide in newly diagnosed autoimmune PAI patients (53). The regenerative potential of adrenocortical stem cells combined with immunomodulatory treatment to stop the autoimmune destruction, adrenal transplantation, or gene therapy in forms of monogenic PAI may be a useful option in the future.


For CIRCI with septic shock, it has been suggested to use i.v. HC < 400mg/day for at least 3 days at full dose (rather than high-dose and short-course regimes) when they are not responsive to fluid and moderate- to high-dose vasopressor therapy (> 0.1μg/kg/min of norepinephrine or equivalent) (39). In hospitalized adults with community-acquired pneumonia a daily dose of < 400mg i.v. HC or equivalent has been suggested. GCs are also suggested in patients suffering from meningitis, cardiac arrest (methylprednisolone given during resuscitation or HC given for post-resuscitation shock), and cardiopulmonary bypass surgery (CPB) (250mg i.v. of methylprednisolone at anesthesia induction and at onset of CPB) or dexamethasone (1mg/kg perioperatively). Corticosteroids are not suggested for patients after major trauma or suffering from influenza. Nevertheless, it should be emphasized that this is a rapidly changing situation, and the use of corticosteroids in the ICU with severely ill patients remains controversial.


Despite concerns that patients with AI were more vulnerable to infection during the recent COVID-19 pandemic,adequately treated and well-trained AI patients demonstrated the same incidence of COVID-19-suggestive symptoms and disease severity as the people without AI.


FOLLOW-UP


Patients with chronic AI should be closely followed-up by an endocrinologist or a healthcare provider with endocrine expertise at least annually (for infants every 3 to 4 months) to ensure the adequacy of their GCs and/or MCsreplacement dose (Table 11, 12), to reduce the risk of adrenal crisis, to provide necessary education to patients, and to confirm that they have a prompt updated emergency pack with HC to treat an emergency. Clinical symptoms including body weight, postural blood pressure and energy levels should be monitored in order to avoid signs of frank GCs excess and adjust accordingly the dose of steroids. The ‘mapping’ of the dose has been suggested to assess the compliance and also help decide when tablets should be taken in problematic cases of reduced quality of life where the detailed questioning for daily habits, working patterns, general feelings of energy, mental concentration, daytime somnolence, and energy dips. Hormonal monitoring of GCs replacement, such as serum or salivary cortisol ‘day-curves’ is not routinely recommended, but can be useful in specific situations where the clinical response cannot be reliably used to adjust treatment or when malabsorption is suspected (54,55). In addition, the use of ACTH levels to assess GCs replacement is not suggested since it leads to over-replacement.


Similarly, MCs replacement should be monitored based on clinical assessment, which includes postural hypotension as measured by lying and standing blood pressure and pulse, symptoms of salt craving, oedema, blood electrolyte measurements. Reported well-being, normal blood pressure without orthostatic hypotension and electrolytes within the normal range indicate adequate replacement. PRA in the upper reference range has been found to be a useful predictor for a correct MCs dose (56,57). Liquorice and grapefruit juice enhance the MC effect of HC and should be avoided. Phenytoin potentiates hepatic clearance of GCs and increase fludrocortisone metabolism; therefore, and higher doses are needed when it is co-administered.


It is of note that in patients who develop hypertension while receiving fludrocortisone, the dose of fludrocortisone should be reduced and HC replacement should be adjusted. If blood pressure remains uncontrolled, anti-hypertensive treatment should be initiated without fludrocortisone discontinuation. First-line anti-hypertensive drugs to be selected are the angiotensin II receptor blockers or angiotensin-converting enzyme blockers to counterbalance the vasoconstrictive effects of elevated angiotensin II, second-line a dihydropyridine calcium blocker, while diuretics should be avoided and aldosterone receptor blockers are contraindicated.


Since AI might mask the presence of partial DI, urine output should be monitored after starting GCs replacement, or conversely, when DI has unreasonably improved, patients have to be tested for HPA reserve. With DHEA replacement, morning serum DHEAS levels should be measured before the intake of the daily dose aiming at the mid-normal range. An annual screening for autoimmune diseases, which includes autoimmune thyroid disease, type 1 diabetes, premature ovarian failure, coeliac disease, and autoimmune gastritis should be performed in PAI patients without other obvious cause of adrenal failure.


Special populations, like pregnant females, should be surveyed for clinical symptoms and signs of GCs over- and under-replacement including weight gain, fatigue, postural hypotension or hypertension, hyperglycemia, with at least once per trimester. Only sodium and potassium can be reliably monitored in blood and urine for the adequacy of replacement. In contrast, PRA monitoring is not advised since plasma renin physiologically increases during this time.

In children, monitoring of GCs replacement includes clinical assessment such as growth velocity, body weight, blood pressure, and energy levels (58).


Although familial autoimmune PAI is less frequent, genetic counselling is suggested in particular situations due to monogenic disorders.


Table 11. Assessment of Glucocorticoid Replacement

Under replacement

Lethargy, tiredness, nausea, poor appetite, weight loss, hyperpigmentation.
Low serum cortisol level on cortisol day curve (useful in specific cases for HC or cortisone replacement only)

Over replacement

Cushingoid appearance, weight gain, insomnia, peripheral edema, low bone mineral density.
High 24-h UFC, high serum cortisol on hydrocortisone day curve (useful in specific cases for HC or cortisone replacement only)


Table 12. Assessment of Mineralocorticoid Replacement

Inadequate replacement

Postural hypotension, light-headedness
High PRA (plasma renin activity, should be at the upper limit of normal)

Over replacement      

Hypertension, peripheral oedema, hypernatremia, hypokalemia


Patient Education


This is very crucial in the management of AI and for the prevention of adrenal crisis. All patients and their relatives should be educated about their condition and the emergency measures they should take at home to avoid crises, particularly concerning GCs adjustments in stressful events and preventive strategies including parenteral self- or lay-administration of emergency GCs particularly in situations of intercurrent illness, fever, or any type of stress. This information should be reinforced during annual follow-up visits by clinicians and if possible, through a structured patient education program. All patients should be given a steroid emergency card and medical-alert identification to inform health personnel of the need for increased GCs doses to avert or immediately treat adrenal crisis. Every patient should be equipped with a GCs injection kit for emergency use and be educated on how to use it (Table 13).


Table 13: Information and Equipment for Patients with AI

Steroid Sick Day Rules

Sick day rule 1: Patients should be advised to increase the oral GCs when the patient experiences fever or illness requiring bed rest, or when requiring antibiotics for an infection. For instance, the total oral GCs dose should be doubled (> 38°C) or tripled (> 39°C) for at least 72 hours; if the patient remains unwell after 72 hours, they should contact their caring physician. There is no need to increase the MCs dose.


Sick day rule 2: There should always be a supply of additional oral GCs on prescription for sick days and HC emergency injection kit prescription.


Sick day rule 3: Every patient should carry a medical alert bracelet or leaflet with information stating their conditions, treatment, physician, emergency phone number of endocrine specialist team, and proposed GCs regimen during adrenal crisis.


Sick day rule 4: Parenteral injection of GCs preparation, either i.m. or i.v. should be provided in case of severe illness, trauma, persistent vomiting, before moderately stressful procedure (i.e., barium enema endoscopy, arteriography), or before surgical intervention.


Steroid Emergency Pack

·                Every patient should be provided with this pack to keep at home.

·                The pack contains a vial of 100mg HC or 4mg dexamethasone, syringes, needles, also oral HC or prednisolone suppositories.

·                The patient and/ or any responsible family member should be educated to administer this medication i.m. or s.c. during an emergency situation including severe accident, significant hemorrhage, fracture, unconsciousness, diarrhea and vomiting, and they should call the emergency medical personal immediately (adults, i.m. or s.c. HC 100mg; children, i.m. HC 50mg/m2; infants, 25mg; school-age children, 50mg; adolescents, 100mg).

·                The expiry date on the pack should be checked regularly and replaced with a new pack if expired.

·                The patient should be advised to take the pack when travelling.

Medical-Alert bracelet or pendant and emergency steroid card

·                Every patient should wear or carry these in which the diagnosis and daily medication should be clearly documented.

Follow up

·                A regular visit in order to reinforce education and confirm understanding should be scheduled at least annually in a patient without specific problems or recent crises. Other circumstances, such as monitoring during infancy, may necessitate more frequent visits.

GCs, glucocorticoids; HC, hydrocortisone; i.m., intramuscularly; i.v., intravenously; HC, hydrocortisone; MCs, mineralocorticoids; s.c., subcutaneously


PROGNOSIS


The mortality of patients with PAI was increased in some studies and adrenal crisis was a significant cause of death, emphasizing the importance of educating patients with AI to prevent crises. Recent large cohorts confirmed the increased mortality of patients with ΑΙ, especially PAI. Although cardiovascular disease (CVD) was the leading cause of death, infectious diseases were found to pose the greatest risk in comparison to controls. Adrenal crisis was also found to be a common contributor, particularly in those with co-existing CVD. In addition, despite an adequate replacement dose, the quality of life of PAI patients remains impaired. This appears to be related to the delay in diagnosis.


GUIDELINES


Bornstein SR, Allolio B, Arlt W, Barthel A, Don-Wauchope A, Hammer GD, Husebye ES, Merke DP, Murad MH, Stratakis CA, Torpy DJ. Diagnosis and Treatment of Primary Adrenal Insufficiency: An Endocrine Society Clinical Practice Guideline. J Clin Endocrinol Metab. 2016 Feb;101(2):364-89.


Fleseriu M, Hashim IA, Karavitaki N, Melmed S, Murad MH, Salvatori R, Samuels MH. Hormonal Replacement in Hypopituitarism in Adults: An Endocrine Society Clinical Practice Guideline. J Clin Endocrinol Metab. 2016 Nov;101(11):3888-3921.


Annane D, Pastores SM, Rochwerg B, Arlt W, Balk RA, Beishuizen A, Briegel J, Carcillo J, Christ-Crain M, Cooper MS, Marik PE, Umberto Meduri G, Olsen KM, Rodgers SC, Russell JA, Van den Berghe G. Guidelines for the Diagnosis and Management of Critical Illness-Related Corticosteroid Insufficiency (CIRCI) in Critically Ill Patients (Part I): Society of Critical Care Medicine (SCCM) and European Society of Intensive Care Medicine (ESICM) 2017. Crit Care Med. 2017 Dec;45(12):2078-2088.


Pastores SM, Annane D, Rochwerg B. Corticosteroid Guideline Task Force of SCCM and ESICM. Guidelines for the Diagnosis and Management of Critical Illness-Related Corticosteroid Insufficiency (CIRCI) in Critically Ill Patients (Part II): Society of Critical Care Medicine (SCCM) and European Society of Intensive Care Medicine (ESICM) 2017. Crit Care Med. 2018 Jan;46(1):146-148.


Speiser PW, Arlt W, Auchus RJ, Baskin LS, Conway GS, Merke DP, Meyer-Bahlburg HFL, Miller WL, Muraf MH, Oberfield SE, White PC. Congenital Adrenal Hyperplasia Due to Steroid 21-Hydroxylase Deficiency: An Endocrine Society Clinical Practice Guideline. J Clin Endocrinol Metab. 2018 Nov;103(11):4043-4088.


REFERENCES


  1. Mason AS, Meade TW, Lee JA, Morris JN. Epidemiological and clinical picture of Addison's disease. Lancet 1968;2:744-747
  2. Olafsson AS, Sigurjonsdottir HA. Increasing Prevalence of Addison Disease: Results from a Nationwide Study. Endocr Pract 2016;22:30-35
  3. Erichsen MM, Lovas K, Skinningsrud B, Wolff AB, Undlien DE, Svartberg J, Fougner KJ, Berg TJ, Bollerslev J, Mella B, Carlson JA, Erlich H, Husebye ES. Clinical, immunological, and genetic features of autoimmune primary adrenal insufficiency: observations from a Norwegian registry. J Clin Endocrinol Metab 2009;94:4882-4890
  4. Chantzichristos D, Persson A, Eliasson B, Miftaraj M, Franzen S, Svensson AM, Johannsson G. Incidence, prevalence and seasonal onset variation of Addison's disease among persons with type 1 diabetes mellitus: nationwide, matched cohort studies. Eur J Endocrinol 2018;178:113-120
  5. Bates AS, Van't Hoff W, Jones PJ, Clayton RN. The effect of hypopituitarism on life expectancy. J Clin Endocrinol Metab 1996;81:1169-1172
  6. Nilsson B, Gustavasson-Kadaka E, Bengtsson BA, Jonsson B. Pituitary adenomas in Sweden between 1958 and 1991: incidence, survival, and mortality. J Clin Endocrinol Metab 2000;85:1420-1425
  7. Regal M, Paramo C, Sierra SM, Garcia-Mayor RV. Prevalence and incidence of hypopituitarism in an adult Caucasian population in northwestern Spain. Clin Endocrinol (Oxf) 2001;55:735-740
  8. Hahner S, Spinnler C, Fassnacht M, Burger-Stritt S, Lang K, Milovanovic D, Beuschlein F, Willenberg HS, Quinkler M, Allolio B. High incidence of adrenal crisis in educated patients with chronic adrenal insufficiency: a prospective study. J Clin Endocrinol Metab 2015;100:407-416
  9. Quinkler M, Murray RD, Zhang P, Marelli C, Petermann R, Isidori AM, Ekman B. Characterization of patients with adrenal insufficiency and frequent adrenal crises. Eur J Endocrinol 2021;184:761-771
  10. Reisch N, Willige M, Kohn D, Schwarz HP, Allolio B, Reincke M, Quinkler M, Hahner S, Beuschlein F. Frequency and causes of adrenal crises over lifetime in patients with 21-hydroxylase deficiency. Eur J Endocrinol 2012;167:35-42
  11. Achermann JC, Meeks JJ, Jameson JL. Phenotypic spectrum of mutations in DAX-1 and SF-1. Mol Cell Endocrinol 2001;185:17-25
  12. Aguisanda F, Thorne N, Zheng W. Targeting Wolman Disease and Cholesteryl Ester Storage Disease: Disease Pathogenesis and Therapeutic Development. Curr Chem Genom Transl Med 2017;11:1-18
  13. Fluck CE. MECHANISMS IN ENDOCRINOLOGY: Update on pathogenesis of primary adrenal insufficiency: beyond steroid enzyme deficiency and autoimmune adrenal destruction. Eur J Endocrinol 2017;177:R99-R111
  14. Prasad R, Hadjidemetriou I, Maharaj A, Meimaridou E, Buonocore F, Saleem M, Hurcombe J, Bierzynska A, Barbagelata E, Bergada I, Cassinelli H, Das U, Krone R, Hacihamdioglu B, Sari E, Yesilkaya E, Storr HL, Clemente M, Fernandez-Cancio M, Camats N, Ram N, Achermann JC, Van Veldhoven PP, Guasti L, Braslavsky D, Guran T, Metherell LA. Sphingosine-1-phosphate lyase mutations cause primary adrenal insufficiency and steroid-resistant nephrotic syndrome. J Clin Invest 2017;127:942-953
  15. Buonocore F, Achermann JC. Primary adrenal insufficiency: New genetic causes and their long-term consequences. Clin Endocrinol (Oxf) 2020;92:11-20
  16. Turk BR, Theda C, Fatemi A, Moser AB. X-linked adrenoleukodystrophy: Pathology, pathophysiology, diagnostic testing, newborn screening and therapies. Int J Dev Neurosci 2020;80:52-72
  17. Narumi S. Discovery of MIRAGE syndrome. Pediatr Int 2022;64:e15283
  18. Fleseriu M, Hashim IA, Karavitaki N, Melmed S, Murad MH, Salvatori R, Samuels MH. Hormonal Replacement in Hypopituitarism in Adults: An Endocrine Society Clinical Practice Guideline. J Clin Endocrinol Metab 2016;101:3888-3921
  19. Patti G, Guzzeti C, Di Iorgi N, Maria Allegri AE, Napoli F, Loche S, Maghnie M. Central adrenal insufficiency in children and adolescents. Best Pract Res Clin Endocrinol Metab 2018;32:425-444
  20. Angelousi A, Alexandraki K, Tsoli M, Kaltsas G, Kassi E. Hypophysitis (Including IgG4 and Immunotherapy). Neuroendocrinology 2020;110:822-835
  21. Angelousi A, Alexandraki KI, Kyriakopoulos G, Tsoli M, Thomas D, Kaltsas G, Grossman A. Neoplastic metastases to the endocrine glands. Endocr Relat Cancer 2020;27:R1-R20
  22. Bornstein SR, Allolio B, Arlt W, Barthel A, Don-Wauchope A, Hammer GD, Husebye ES, Merke DP, Murad MH, Stratakis CA, Torpy DJ. Diagnosis and Treatment of Primary Adrenal Insufficiency: An Endocrine Society Clinical Practice Guideline. J Clin Endocrinol Metab 2016;101:364-389
  23. Ambrosi B, Barbetta L, Re T, Passini E, Faglia G. The one microgram adrenocorticotropin test in the assessment of hypothalamic-pituitary-adrenal function. Eur J Endocrinol 1998;139:575-579
  24. Mayenknecht J, Diederich S, Bahr V, Plockinger U, Oelkers W. Comparison of low and high dose corticotropin stimulation tests in patients with pituitary disease. J Clin Endocrinol Metab 1998;83:1558-1562
  25. Javorsky BR, Raff H, Carroll TB, Algeciras-Schimnich A, Singh RJ, Colon-Franco JM, Findling JW. New Cutoffs for the Biochemical Diagnosis of Adrenal Insufficiency after ACTH Stimulation using Specific Cortisol Assays. J Endocr Soc 2021;5:bvab022
  26. Dorin RI, Qualls CR, Crapo LM. Diagnosis of adrenal insufficiency. Ann Intern Med 2003;139:194-204
  27. Hagg E, Asplund K, Lithner F. Value of basal plasma cortisol assays in the assessment of pituitary-adrenal insufficiency. Clin Endocrinol (Oxf) 1987;26:221-226
  28. Watts NB, Tindall GT. Rapid assessment of corticotropin reserve after pituitary surgery. JAMA 1988;259:708-711
  29. Auchus RJ, Shewbridge RK, Shepherd MD. Which patients benefit from provocative adrenal testing after transsphenoidal pituitary surgery? Clin Endocrinol (Oxf) 1997;46:21-27
  30. Lebbe M, Arlt W. What is the best diagnostic and therapeutic management strategy for an Addison patient during pregnancy? Clin Endocrinol (Oxf) 2013;78:497-502
  31. Dickstein G, Shechner C, Nicholson WE, Rosner I, Shen-Orr Z, Adawi F, Lahav M. Adrenocorticotropin stimulation test: effects of basal cortisol level, time of day, and suggested new sensitive low dose test. J Clin Endocrinol Metab 1991;72:773-778
  32. Schlaghecke R, Kornely E, Santen RT, Ridderskamp P. The effect of long-term glucocorticoid therapy on pituitary-adrenal responses to exogenous corticotropin-releasing hormone. N Engl J Med 1992;326:226-230
  33. Trainer PJ, Faria M, Newell-Price J, Browne P, Kopelman P, Coy DH, Besser GM, Grossman AB. A comparison of the effects of human and ovine corticotropin-releasing hormone on the pituitary-adrenal axis. J Clin Endocrinol Metab 1995;80:412-417
  34. Nye EJ, Grice JE, Hockings GI, Strakosch CR, Crosbie GV, Walters MM, Jackson RV. Comparison of adrenocorticotropin (ACTH) stimulation tests and insulin hypoglycemia in normal humans: low dose, standard high dose, and 8-hour ACTH-(1-24) infusion tests. J Clin Endocrinol Metab 1999;84:3648-3655
  35. Nye EJ, Grice JE, Hockings GI, Strakosch CR, Crosbie GV, Walters MM, Torpy DJ, Jackson RV. Adrenocorticotropin stimulation tests in patients with hypothalamic-pituitary disease: low dose, standard high dose and 8-h infusion tests. Clin Endocrinol (Oxf) 2001;55:625-633
  36. Stewart PM. N-PJ. The Adrenal Cortex. In: Melmed S. PK, Larsen PR., Kronenberg HM., ed. Williams Textbook of Endocrinology. 13th ed: Elsevier; 2016:489-555.
  37. Berg C, Meinel T, Lahner H, Mann K, Petersenn S. Recovery of pituitary function in the late-postoperative phase after pituitary surgery: results of dynamic testing in patients with pituitary disease by insulin tolerance test 3 and 12 months after surgery. Eur J Endocrinol 2010;162:853-859
  38. Andrioli M, Pecori Giraldi F, Cavagnini F. Isolated corticotrophin deficiency. Pituitary 2006;9:289-295
  39. Annane D, Pastores SM, Rochwerg B, Arlt W, Balk RA, Beishuizen A, Briegel J, Carcillo J, Christ-Crain M, Cooper MS, Marik PE, Umberto Meduri G, Olsen KM, Rodgers SC, Russell JA, Van den Berghe G. Guidelines for the Diagnosis and Management of Critical Illness-Related Corticosteroid Insufficiency (CIRCI) in Critically Ill Patients (Part I): Society of Critical Care Medicine (SCCM) and European Society of Intensive Care Medicine (ESICM) 2017. Crit Care Med 2017;45:2078-2088
  40. Marik PE, Zaloga GP. Adrenal insufficiency during septic shock. Crit Care Med 2003;31:141-145
  41. de Jong MF, Molenaar N, Beishuizen A, Groeneveld AB. Diminished adrenal sensitivity to endogenous and exogenous adrenocorticotropic hormone in critical illness: a prospective cohort study. Crit Care 2015;19:1
  42. Esteban NV, Loughlin T, Yergey AL, Zawadzki JK, Booth JD, Winterer JC, Loriaux DL. Daily cortisol production rate in man determined by stable isotope dilution/mass spectrometry. J Clin Endocrinol Metab 1991;72:39-45
  43. Kerrigan JR, Veldhuis JD, Leyo SA, Iranmanesh A, Rogol AD. Estimation of daily cortisol production and clearance rates in normal pubertal males by deconvolution analysis. J Clin Endocrinol Metab 1993;76:1505-1510
  44. Quinkler M, Miodini Nilsen R, Zopf K, Ventz M, Oksnes M. Modified-release hydrocortisone decreases BMI and HbA1c in patients with primary and secondary adrenal insufficiency. Eur J Endocrinol 2015;172:619-626
  45. Isidori AM, Venneri MA, Graziadio C, Simeoli C, Fiore D, Hasenmajer V, Sbardella E, Gianfrilli D, Pozza C, Pasqualetti P, Morrone S, Santoni A, Naro F, Colao A, Pivonello R, Lenzi A. Effect of once-daily, modified-release hydrocortisone versus standard glucocorticoid therapy on metabolism and innate immunity in patients with adrenal insufficiency (DREAM): a single-blind, randomised controlled trial. Lancet Diabetes Endocrinol 2018;6:173-185
  46. Whitaker M, Debono M, Huatan H, Merke D, Arlt W, Ross RJ. An oral multiparticulate, modified-release, hydrocortisone replacement therapy that provides physiological cortisol exposure. Clin Endocrinol (Oxf) 2014;80:554-561
  47. Fariss BL, Hane S, Shinsako J, Forsham PH. Comparison of absorption of cortisone acetate and hydrocortisone hemisuccinate. J Clin Endocrinol Metab 1978;47:1137-1140
  48. Williams GH, Cain JP, Dluhy RG, Underwood RH. Studies of the control of plasma aldosterone concentration in normal man. I. Response to posture, acute and chronic volume depletion, and sodium loading. J Clin Invest 1972;51:1731-1742
  49. Arlt W, Callies F, van Vlijmen JC, Koehler I, Reincke M, Bidlingmaier M, Huebler D, Oettel M, Ernst M, Schulte HM, Allolio B. Dehydroepiandrosterone replacement in women with adrenal insufficiency. N Engl J Med 1999;341:1013-1020
  50. Alkatib AA, Cosma M, Elamin MB, Erickson D, Swiglo BA, Erwin PJ, Montori VM. A systematic review and meta-analysis of randomized placebo-controlled trials of DHEA treatment effects on quality of life in women with adrenal insufficiency. J Clin Endocrinol Metab 2009;94:3676-3681
  51. Liu D, Ahmet A, Ward L, Krishnamoorthy P, Mandelcorn ED, Leigh R, Brown JP, Cohen A, Kim H. A practical guide to the monitoring and management of the complications of systemic corticosteroid therapy. Allergy Asthma Clin Immunol 2013;9:30
  52. Alexandraki KI, Grossman A. Management of Hypopituitarism. J Clin Med 2019;8
  53. Napier C, Gan EH, Mitchell AL, Gilligan LC, Rees DA, Moran C, Chatterjee K, Vaidya B, James RA, Mamoojee Y, Ashwell S, Arlt W, Pearce SHS. Residual Adrenal Function in Autoimmune Addison's Disease-Effect of Dual Therapy With Rituximab and Depot Tetracosactide. J Clin Endocrinol Metab 2020;105
  54. Howlett TA. An assessment of optimal hydrocortisone replacement therapy. Clin Endocrinol (Oxf) 1997;46:263-268
  55. Bancos I, Hahner S, Tomlinson J, Arlt W. Diagnosis and management of adrenal insufficiency. Lancet Diabetes Endocrinol 2015;3:216-226
  56. Oelkers W, L'Age M. Control of mineralocorticoid substitution in Addison's disease by plasma renin measurement. Klin Wochenschr 1976;54:607-612
  57. Flad TM, Conway JD, Cunningham SK, McKenna TJ. The role of plasma renin activity in evaluating the adequacy of mineralocorticoid replacement in primary adrenal insufficiency. Clin Endocrinol (Oxf) 1996;45:529-534
  58. Speiser PW, Arlt W, Auchus RJ, Baskin LS, Conway GS, Merke DP, Meyer-Bahlburg HFL, Miller WL, Murad MH, Oberfield SE, White PC. Congenital Adrenal Hyperplasia Due to Steroid 21-Hydroxylase Deficiency: An Endocrine Society Clinical Practice Guideline. J Clin Endocrinol Metab 2018;103:4043-4088


Congenital Adrenal Hyperplasia

ABSTRACT


Congenital Adrenal Hyperplasia (CAH) is a term used to describe a group of genetically determined disorders of defective steroidogenesis that result in variable deficiency of the end products cortisol and/or aldosterone and their deleterious, including life-threatening, effects on metabolism and electrolytes with simultaneous diversion to the accumulation of androgens and their virilizing effects. Although we discuss the various enzymatic defects that are involved, we focus on the most common enzyme deficiency, 21-hydroxylase. Depending on the residual enzymatic activity governed by the genetic mutation, 21-hydroxylase deficiency CAH is classified as either classical (salt wasting or simple virilizing) or non-classical.  In classical 21-hydroxylase deficiency CAH, there is an accumulation of 17-hydroxyprogesterone which is shunted into the intact androgen pathway and may lead to prenatally virilized external genitalia in females as early as 9 weeks of gestation.  Inadequately treated patients may develop progressive penile or clitoral enlargement, premature adrenarche, precocious puberty, rapid linear growth accompanied by premature epiphysis maturation leading to compromised final adult height and impaired fertility. Moreover, inadequately treated salt loss increases the risk for adrenal crises. In contrast, over treatment with cortisol results in “Cushingoid” effects including retarded bone development. We describe the various defects, their manifestations and goals for therapy, and emerging newer therapies for CAH to both correct the deficiency in cortisol and aldosterone secretion while suppressing overproduction of ACTH. 


INTRODUCTION


Congenital adrenal hyperplasia (CAH) refers to a group of disorders that arise from defective steroidogenesis. The production of cortisol in the zona fasciculata of the adrenal cortex occurs in five major enzyme-mediated steps. CAH results from deficiency in any one of these enzymes. Impaired cortisol synthesis leads to chronic elevations of ACTH via the negative feedback system, causing overstimulation of the adrenal cortex and resulting in hyperplasia and over-secretion of the precursors to the enzymatic defect. The five forms of CAH are summarized in Table 1. Impaired enzyme function at each step of adrenal cortisol biosynthesis leads to a unique combination of elevated precursors and deficient products. The most common enzyme

deficiency that accounts for more than 90% of all CAH cases is 21-hydroxylase deficiency (1).


EPIDEMIOLOGY


Data from close to 6.5 million newborn screenings worldwide indicate that classical CAH occurs in about 1:13,000 to 1:15,000 live births (2). It is estimated that 75% of patients have the salt-wasting phenotype(1). Non-classical 21OHD CAH (NC21OHD) is more common. The incidence in the heterogeneous population of New York City is about 1 in 100, making NC21OHD the most frequent autosomal recessive disorder in humans. NC21OHD is particularly prevalent in certain populations, showing a high ethnic specificity. In the Ashkenazi Jewish population, 1 in 3 are carriers of the allele, and 1 in 27 are affected with the disorder (3-5).  CAH resulting from 11β-hydroxylase deficiency (11β-OHD) is the second most common cause of CAH, accounting for 5-8% of all cases (6). It occurs in about 1 of every 100,000 live births in the general population (7)  and is more common in some populations of North African origin (8). In Moroccan Jews, for example, the disease incidence was initially estimated to be 1 in 5,000 live births (9); subsequently, it was shown to occur less frequently (10), but remains more common than in other populations. The other forms of CAH are considered rare diseases and their incidence is unknown in the general population.


PATHOPHYSIOLOGY  


Adrenal steroidogenesis occurs in three major pathways: glucocorticoids, mineralocorticoids, and sex steroids as shown in Figure 1. The adrenal gland architecture suggests that the adrenal acts as three separate glands: zona glomerulosa, zona fasciculate, zona reticularis (11). The hypothalamic-pituitary-adrenal feedback system is mediated through the circulating level of plasma cortisol by negative feedback of cortisol on CRF and ACTH secretion. (Figure 2) Therefore, any CAH condition that results in a decrease in cortisol secretion leads to increased ACTH production, which in turn stimulates (1) excessive synthesis of adrenal products in those pathways unimpaired by the enzyme deficiency and (2) a build-up of precursor molecules in pathways blocked by the enzyme deficiency.

Figure 1. The classical and backdoor pathways of adrenal steroidogenesis: The classical pathway is highlighted in blue and the backdoor pathway is highlighted in orange. In the classical pathway, five enzymatic steps are necessary for cortisol production. In the first step of adrenal steroidogenesis, cholesterol enters mitochondria via a carrier protein called steroidogenic acute regulatory protein (StAR). ACTH stimulates cholesterol cleavage, the first and rate limiting step of adrenal steroidogenesis. The five enzymes required for cortisol production are cholesterol side chain cleavage enzyme (SCC), 17α-hydroxylase, 3β-hydroxysteroid dehydrogenase (3βHSD2), 21-hydroxylase, and 11β-hydroxylase. The backdoor pathway is an alternative pathway producing dihydrotestosterone. The enzymes include 5α-reductase 1, aldo keto reductases, retinol dehydrogenase RoDH, 17β-hydroxysteroid dehydrogenases, 17α-hydroxylase.

Figure 2. The hypothalamic-pituitary-adrenal (HPA) axis. Corticotropin-releasing factor produced in the hypothalamus stimulates the secretion of adrenocorticotropic hormone (ACTH) from the anterior lobe of the pituitary gland. ACTH stimulates the production of cortisol and androgens in the adrenal cortex. There is negative feedback on the hypothalamus and pituitary gland by cortisol.


The clinical symptoms of the five different forms of CAH result from the specific hormones that are deficient and those that are produced in excess as outlined in Table 1. In the most common form 21OHD-CAH, the function of 21-hydroxylating cytochrome P450 is deficient, creating a block in the P450 cortisol production pathway. This leads to an accumulation of 17-hydroxyprogesterone (17-OHP), a precursor of the 21-hydroxylation step. Excess 17-OHP is then shunted into the intact androgen pathway, where the 17,20-lyase enzyme converts 17-OHP to Δ4-androstenedione, the major adrenal androgen. Mineralocorticoid (aldosterone) deficiency is a feature of the most severe form of the disease and hence named salt wasting CAH. The enzyme defect in the non-classical form of 21OHD CAH is mild and salt wasting does not occur. The analogy of all other enzyme deficiencies in terms of precursor retention and product deficiencies are shown in Table 1.

Table 1. Summary of the Clinical, Hormonal, and Genetic Features of Steroidogenic Defects (1)

Condition

Onset

Abnormality

Genitalia

Mineralocorticoid Effect

Typical Features

Gene

Lipoid CAH

Congenital

StAR Protein

Female, with no sexual development

Salt wasting

All steroid products low

StAR 8p11.2

Lipoid CAH

Congenital

P450scc

Female, with no sexual development

Salt wasting

All steroid products low

CYP11A 15q23-24

3β-HSD deficiency, classic

Congenital

3β-HSD

Females virilized, males under-virilized

Salt wasting

Elevated DHEA, 17-pregnenolone, low androstenedione, testosterone, elevated K, low Na, CO2

HSD3B2 1p13.1

3β-HSD deficiency, non-classic

Postnatal

3β-HSD

Normal genitalia with mild to moderate hyperandrogenism postnatally

None

Elevated DHEA, 17-pregnenolone, low androstenedione, testosterone

Absent or unknown

17α-OH deficiency

Congenital

P450c17

Variable sexual development

Hypokalemic low-renin hypertension

Normal or decreased androgens and estrogen, elevated DOC, corticosterone

CYP17 10q24.3

17,20-Lyase deficiency

Congenital

P450c17

Infantile female genitalia

None

Decreased androgens and estrogens

CYP17 10q24.3

Combined 17α-OH/17,20-lyase deficiency

Congenital

P450c17

Infantile female genitalia

Hypokalemic low-renin hypertension

Decreased androgens and estrogens

CYP17 10q24.3

Combined 17α-OH/17,20-lyase deficiency

Postnatal

P450c17

Infertility, Infantile female genitalia

None

Decreased follicular estradiol and increased progesterone

CYP17 10q24.3

Classic 21-OH deficiency, salt wasting

Congenital

P450c21

Females prenatally virilized, normal male genitalia, hyperpigmentation

Salt wasting

Elevated 17-OHP, DHEA, and androstenedione, elevated K, low Na, CO2

CYP21 6p21.3

Classic 21-OH deficiency, simple virilizing

Congenital

P450c21

Females prenatally virilized, normal male genitalia

None

Elevated 17-OHP, DHEA, and androstenedione, normal electrolytes

CYP21 6p21.3

Non-classic 21-OH deficiency

Postnatal

P450c21

Males and females with normal genitalia at birth, hyperandrogenism postnatally

None

Elevated 17-OHP, DHEA, and androstenedione on ACTH stimulation

CYP21 6p21.3

Classic CAH 11β-deficiency

Congenital

P450c11B1

Females virilized with atypical genitalia, males unchanged

Low-renin hypertension

Elevated DOC, 11-deoxycortisol (S); androgens, low K, elevated Na, CO2

CYP11B1 8q24.3

Non-classic CAH 11β-deficiency

Postnatal

P450c11B1

Males and females with normal genitalia at birth, hyperandrogenism postnatally

None

Elevated 11-deoxycortisol ± DOC, elevated androgens

CYP11B1 8q24.3

P450 Oxido-Reductase Deficiency

Congenital

POR

Females virilized with atypical genitalia, males under-virilized

None

Partial, combined and variable defects of P450c21, P450c17 and P450aro activity

POR

7q11.2


CAH, Congenital adrenal hyperplasia; DHEA, dehydroepiandrosterone; DOC, deoxycorticosterone; 3β-HSD, 3β-hydroxysteroid dehydrogenase; OH, hydroxylase; 17-OHP, 17-hydroxyprogesterone. Adapted from: Wajnrajch MP and New MI. Chapter 103: Defects of Adrenal Steroidogenesis. Endocrinology, Adult and Pediatric. 6th Edition. 2010. pp 1897-1920. Permission obtained.


CLINICAL FEATURES


External Genitalia


VIRILIZING FORMS OF CAH: CLASSICAL 21-HYROXYLASE DEFICIENCY AND 11β-HYDOXYLASE DEFICIENCY


Females with classical CAH owing to 21OHD and 11β-hydroxylase deficiency generally present at birth with virilization of their genitalia. Adrenocortical function begins at the 7th week of gestation (12); thus, a female fetus with classical CAH is exposed to adrenal androgens at the critical time of sexual differentiation (between 9 to 15 weeks gestational age). Androgens masculinize external female genitalia causing physical changes including: clitoral enlargement, fusion and scrotalization of the labial folds, and rostral migration of the urethral/vaginal perineal orifice, placing the phallus in the male position. The degree of genital virilization may range from mild clitoral enlargement alone to, in rare cases, a penile urethra (Prader V genitalia). Degrees of genital virilization are classified into five Prader stage (13) (see Figure 3).


Figure 3. Different degrees of virilization according to the scale developed by Prader (15). Stage I: clitoromegaly without labial fusion Stage II: clitoromegaly and posterior labial fusion Stage III: greater degree of clitoromegaly, single perineal urogenital orifice, and almost complete labial fusion Stage IV: increasingly phallic clitoris, urethra-like urogenital sinus at base of clitoris, and complete labial fusion Stage V: penile clitoris, urethral meatus at tip of phallus, and scrotum-like labia (appear like males without palpable gonads).


Internal Genitalia


In contrast to the virilization of the external genitalia, internal female genitalia, the uterus, fallopian tubes and ovaries, develop normally. Females with CAH do not produce anti-Müllerian hormone (AMH), which is produced by the testicular Sertoli cells. Internal female structures are Müllerian derivatives and are not androgen responsive. Therefore, the affected female born with virilized external genitalia but normal female internal genitalia has the possibility of normal fertility (1).  Surgical correction of the external genitalia (genitoplasty) may be considered in severely virilized females. This is further discussed in a later section, Treatments.


Postnatal Effects and Growth


Deficient postnatal treatment in boys and girls results in continued exposure to excessive androgens, causing progressive penile or clitoral enlargement, the development of premature pubic hair (pubarche), axillary hair, acne, and impaired fertility. Advanced somatic and epiphyseal development occurs with rapid growth during childhood. This rapid linear growth is usually accompanied by premature epiphyseal maturation and closure, resulting in a final adult height that is below that expected from parental heights (on average -1.1 to -1.5 SD below the mid-parental target height) (14). This is on average 10 cm below the mid-parental height (15). On the other hand, poor growth can occur in patients with 21OHD as a result of excess glucocorticoid treatment. Short stature occurs even in patients with good hormonal adrenal control. A study of growth hormone therapy alone or in combination with a GnRH analog and aromatase inhibitors in CAH patients with compromised height prediction showed improvement in short- and long-term growth to reduce the height deficit (15).  Aromatase inhibitor as a sole adjunct treatment reduces bone age advancement without adverse effects on bone mineral density or visceral adipose tissue (16).


Puberty


In the majority of patients treated adequately from early life, the onset of puberty in both girls and boys with classical 21OHD occurs at the expected chronological age. A careful study showed that the mean ages at onset of puberty in both males and females were somewhat younger than the general population, but did not differ significantly among the three forms of 21OHD (17).


In those who are inadequately treated, advanced epiphyseal development can lead to central precocious puberty. In those with advanced bone maturation at the initial presentation, such as in simple virilizing males, the exposure to elevated androgens followed by the suddenly decreased androgen levels after initiation of glucocorticoid treatment may cause an early activation of the hypothalamic-pituitary-gonadal axis. Studies suggest that excess adrenal androgens (aromatized to estrogens) inhibit the pubertal pattern of gonadotropin secretion by the hypothalamic-pituitary axis. This inhibition, via a negative feedback effect, can be reversed by glucocorticoid treatment (17, 18).


Following the onset of puberty, in a majority of successfully treated patients, the milestones of further development of secondary sex characteristics in general appear to be normal (17). In adolescents and adults, signs of hyperandrogenism may include male-pattern alopecia (temporal balding) and acne. Female patients may develop hirsutism and menstrual irregularities. Although the expected age of menarche may be delayed in females with classical CAH (18), when adequately treated many have regular menses after menarche (19, 20). Menstrual irregularity and secondary amenorrhea with or without hirsutism occur in a subset of post-menarchal females, especially those in poor hormonal control. Primary amenorrhea or delayed menarche may occur if a female with classical CAH is untreated, inadequately treated, or over treated with glucocorticoids (20). In addition, women with CAH may develop polycystic ovarian syndrome (PCOS), likely as a complication of poorly controlled CAH (21, 22).


Gender Role Behavior and Cognition


Prenatal androgen exposure in females affected with the classic forms of 21OHD CAH not only has a masculinizing effect on the development of the external genitalia, but also on childhood behavior. Both physical and behavioral masculinization were related to genotype, indicating that behavioral masculinization in childhood is a consequence of prenatal androgen exposure. Further, changes in childhood play behavior is correlated with reduced female gender satisfaction. Prenatal androgen exposure is related to a decrease in self-reported femininity in dose response manner in adulthood (23) . Affected adult females are more likely to have gender dysphoria, and experience less heterosexual interest and reduced satisfaction with the assignment to the female sex (24). In contrast to females, males affected with CAH do not show a general alteration in childhood play behavior, core gender identity and sexual orientation (24). The rates of bisexual and homosexual orientation were increased in women with all forms of 21OHD CAH. They were found to correlate with the degree of prenatal androgenization (24). Of interest, bisexual/homosexual orientation was correlated with global measures of masculinization of nonsexual behavior and predicted independently by the degree of both prenatal androgenization and masculinization of childhood behavior (25). Among 46,XX CAH patients raised as girls, reported rates of gender dysphoria varied from 6.3% to 27.2%(26).  Most expressed gender dysphoria in late adolescence and adulthood.  Cultural views may determine serious biases in reports of gender dysphoria coming from countries with disproportional societal advantages for males and/or religious restrictions.  Male gender raised patients were approximately 10% of CAH cohorts, mostly from underdeveloped countries, with a high proportion of late diagnoses (26).With regards to cognitive abilities, such as visuospatial/motor ability and handedness, the effect of prenatal androgen exposure continues to be elucidated.  A study found males and females with CAH scored higher than their siblings of the same sex in measures of visual special processing suggesting that androgens affect spatial ability (27).  The effect of CAH on intelligence is controversial.  One study showed no evidence of intellectual deficit in either females or males with CAH. Intelligence was not significantly associated with disease characteristics (28).


Fertility


Difficulty with fertility in females with CAH may arise for various reasons, including anovulation, secondary polycystic ovarian syndrome, irregular menses, non-suppressible serum progesterone levels, or an inadequate introitus. Fertility is reduced in salt-wasting 21OHD (29). In a retrospective survey of fertility rates in a large group of females with classical CAH, simple virilizers were shown to be more likely to become pregnant and carry the pregnancy to term than salt-wasters. Adequate glucocorticoid therapy is an important variable with respect to fertility outcome. The development of PCOS in CAH patients is not uncommon and may be related to both prenatal and postnatal excess androgen exposure, which can affect the hypothalamic-pituitary-gonadal axis. An inadequate vaginal introitus can affect up to a third of classical CAH adult females. Since vaginal dilation is needed to maintain good patency, vaginoplasty is delayed until sexual intercourse is regular or when the patient can assume responsibility for vaginal dilatation (30).


Males with CAH, particularly if poorly treated, may have reduced sperm counts and low testosterone as a result of small testes due to suppression of gonadotropins and sometimes intra-testicular adrenal rests(31, 32). All of these complications may result in diminished fertility. In male patients with classical CAH, several long-term studies indicate that those who have been adequately treated undergo normal pubertal development, have normal testicular function, and normal spermatogenesis and fertility (32, 33). However, small testes and aspermia can occur in patients as a result of inadequately controlled disease (34, 35). Testicular adrenal rest tumor can lead to end stage damage of testicular parenchyma, most probably as a result of longstanding obstruction of the seminiferous tubules (36). In contrast, some investigators have reported normal testicular maturation as well as normal spermatogenesis and fertility in patients who had never received glucocorticoid treatment (37).


Studies demonstrate that post pubertal males with inadequately treated CAH are at a very high risk to develop  testicular adrenal rest tumors (TARTs) In one study, almost all these patients were found to have adenomatous adrenal rests within the testicular tissue, as indicated by the presence of specific 11β-hydroxylated steroids in the blood from gonadal veins (38). These tumors have been reported to be ACTH dependent and to regress following adequate steroid therapy (39-43). These testicular adrenal rests are more frequent in males with salt-wasting CAH and are associated with an increased risk of infertility(30, 44) . Regular testicular examination and periodic testicular ultrasonography are recommended for early detection of testicular lesions. If present, dexamethasone treatment can be considered to suppress TARTs. 


Salt-Wasting 21-Hydroxylase Deficiency


When the deficiency of 21-hydroxylase is severe, adrenal aldosterone secretion is not sufficient for sodium reabsorption by the distal renal tubules, and individuals suffer from salt wasting in addition to cortisol deficiency and androgen excess. Infants with renal salt wasting have poor feeding, weight loss, failure to thrive, vomiting, dehydration, hypotension, hyponatremia, and hyperkalemic metabolic acidosis progressing to adrenal crisis (azotemia, vascular collapse, shock, and death). Adrenal crisis can occur as early as age one to four weeks. The salt wasting is presumed to result from inadequate secretion of salt-retaining steroids, primarily aldosterone. In addition, hormonal precursors of the 21-OH enzyme may act as antagonists to mineralocorticoid action in the sodium-conserving mechanism of the immature newborn renal tubule (45-47).


Affected males who are not detected in a newborn screening program are at high risk for a salt-wasting adrenal crisis because their normal male genitalia do not alert medical professionals to their condition. They may be discharged from the hospital after birth without diagnosis and experience a salt-wasting crisis at home. On the other hand, salt wasting females are born with atypical genitalia that trigger the diagnostic process and appropriate treatment. It is important to recognize that the extent of genital virilization may not differ among the two forms of classical CAH, the simple virilizing and the salt-wasting form. Thus, even a mildly virilized newborn with 21OHD should be observed carefully for signs of a potentially life-threatening crisis within the first few weeks of life. The difference between salt-wasting and simple virilizing form of 21OHD is the quantitative difference in activity of the 21-hydrozylase enzyme, which results from specific mutations. In vitro expression studies show that as little as 1% of 21-hydroxylase activity is sufficient to synthesize enough aldosterone to prevent significant salt wasting (48). It has been observed that an aldosterone biosynthetic defect apparent in infancy may ameliorate with age (49, 50).A spontaneous partial recovery of aldosterone biosynthesis in an adult patient with a homozygous deletion of the CYP21A2 gene who had documented severe salt wasting in infancy has been reported (51). Therefore, it is desirable to follow the sodium and mineralocorticoid requirements carefully by measuring plasma renin activity (PRA) in patients who have been diagnosed in the neonatal period as salt wasters.


Simple-Virilizing 21-Hydroxylase Deficiency


The salient features of classical simple virilizing 21OHD are prenatal virilization and progressive postnatal masculinization with rapid somatic growth and advanced epiphyseal maturation leading to early epiphyseal closure and likely short stature. There is usually no evidence of mineralocorticoid deficiency in this disorder.


Diagnosis at birth of a female with simple virilizing CAH is usually made immediately because of the apparent genital ambiguity. Since the external genitalia are not affected in newborn males, hyperpigmentation and an enlarged phallus may be the only clues suggesting increased ACTH secretion and cortisol deficiency. Diagnosis at birth in males thus rests on prenatal or newborn screening. If a female is not treated with glucocorticoid replacement therapy early post-natally, her genitalia may continue to virilize due to continued excess adrenal androgens, and pseudo precocious puberty may occur. In patients with salt-wasting 21OHD, signs of hyperandrogenism in children affected with CAH include early onset of facial, axillary, and pubic hair, adult body odor, and rapid somatic growth and bone age advancement, leading to short stature in adulthood. The same issues as discussed above related to puberty, fertility, behavior and cognition apply to patients with simple-virilizing 21OHD (1).


Non-Classical 21-Hydroxylase Deficiency


Non-classical 21OHD (NC-21OHD), previously known as late-onset 21OHD, is much more common than the classical form, with an incidence as high as 1:27 in Ashkenazi Jews (3). Individuals with the non-classical (NC) form of 21OHD have only mild to moderate enzyme deficiency and present postnatally, eventually developing signs of hyperandrogenism. Females with NC-CAH do not have virilized genitalia at birth.


NC-CAH may present at any age after birth with a variety of hyperandrogenic symptoms. This form of CAH results from a mild deficiency of the 21-hydroxylase enzyme. Table 2 summarizes the main clinical characteristics of all forms of 21OHD CAH. While serum cortisol concentration is typically low in patients with the classic form of the disease, it is usually normal in patients with NC 21OHD. Similar to classical CAH, NC-CAH may cause premature development of pubic hair, advanced bone age and accelerated linear growth velocity in both males and females. Severe cystic acne has also been attributed to NC-CAH (52, 53).


Table 2. Clinical Features in Individuals with Classic and Non-Classic 21-Hydroxylase Deficiency in the Untreated Form

Feature

21-OH Deficiency

Classic

Non-Classic

Prenatal virilization

Females only

Absent

Postnatal virilization (hyperandrogenism)

Females and Males

Typical

Salt wasting

~75% of all individuals

Absent


Women may present with a variety of symptoms of androgen excess which may be highly variable and organ-specific, including hirsutism, temporal baldness, acne and infertility. Menarche in females may be normal or delayed, and secondary amenorrhea is a frequent occurrence. Further masculinization may include hirsutism, male habitus, deepening of the voice, or male-pattern alopecia (temporal recession). Polycystic ovarian syndrome may also be seen as a secondary complication in these patients. Possible reasons for the development of PCOS include reprogramming of the hypothalamic-pituitary-gonadal axis from prenatal exposure to androgens, or chronic levels of excess adrenal androgens that disrupt gonadotropin release and have direct effects on the ovary, ultimately leading to the formation of cysts. Because of the overlap of hyperandrogenic symptoms, it is important to consider NC 21OHD in a patient diagnosed with PCOS (54, 55).


In adult males, early balding, acne, or impaired fertility may prompt the diagnosis of NC-CAH. A highly reliable constellation of physical signs of adrenal androgen excess is the presence of pubic hair, enlarged phallus, and relatively small testes. Males may have small testes compared to the phallus, which results from suppression of the hypothalamic-pituitary-gonadal axis from adrenal androgens. They may also develop TARTs, which can cause infertility, although some untreated men have been fertile(31, 33). Signs of NC-CAH in adult males may be limited to short stature, oligo-zoospermia and impaired fertility.


A subset of individuals with NC-21OHD are completely asymptomatic when detected (usually as part of a family study or evaluation for infertility), but it is thought, based on longitudinal follow-up of such patients, that symptoms of hyperandrogenism may wax and wane with time. The presence of 21OHD can also be discovered during the evaluation of an incidental adrenal mass (56). One study showed that an increased incidence of adrenal incidentalomas has been found, which was reported as high as 82% in patients with 21OHD and up to 45% in subjects heterozygous for 21OHD mutations. This probably arises from hyperplastic tissue areas and does not require surgical intervention (57). Overall, however, CAH is an uncommon cause of incidentalomas, accounting for less than 1% in one series (58, 59).


OTHER FORMS OF CONGENITAL ADRENAL HYPERPLASIA


11-β Hydroxylase Deficiency


Virilization and low renin hypertension are the prominent clinical features of 11β hydroxylase deficiency (11β-OHD) (60). The virilizing signs and symptoms of this disorder are similar to or more severe than classical 21OHD. Despite failure of aldosterone production, overproduction of deoxycorticosterone (DOC), in vivo a less potent mineralocorticoid, causes salt retention and hypertension. Elevated blood pressure is usually not identified until later in childhood or in adolescence, although its appearance in an infant 3 months of age has been documented (61). In addition, hypertension correlates variably with biochemical values, and clinical signs of mineralocorticoid excess and the degree of virilization are not well correlated. Some severely virilized females are normotensive, whereas mildly virilized patients may experience severe hypertension leading to fatal vascular accidents (62, 63). Complications of long-standing uncontrolled hypertension, including cardiomyopathy, retinal vein occlusion and blindness have been reported in 11β-OHD patients (64, 65). Potassium depletion develops concomitantly with sodium retention, but hypokalemia is variable. Renin production is suppressed secondary to mineralocorticoid-induced sodium retention and volume expansion.


A mild non-classical form of 11β-OHD CAH has been reported. Unlike the common non-classical form of 21OHD, this form is very rare. Non-classical 11β-OHD has been diagnosed in normotensive children with mild virilization or precocious pubarche (6) and in adults with signs of hyper-androgen effect (66) as well as a woman with infertility (67)(69). Despite a hormonal profile consistent with 11β-OHD, mutations in the CYP11B1 gene may not always be present (66). The best biochemical marker of 11β-OHD is elevated serum 11-deoxycortisol concentration.


3-β Hydroxysteroid Dehydrogenase Deficiency


There are two forms of the 3 β -hydroxysteroid dehydrogenase enzyme (3 β -HSD): type I and type II. Type II 3 β -HSD enzyme is expressed in the adrenal cortex and gonads and is responsible for conversion of Δ5 (delta 5) to Δ4 (delta 4) steroids (1). This enzyme is essential for the formation of progesterone, which is the precursor for aldosterone, and 17-OHP, which is the precursor for cortisol in the adrenal cortex as well as for androstenedione, testosterone, and estrogen in the adrenal cortex and gonads (68, 69). Therefore, deficiency of 3ß-HSD in the classic form of 3ß-HSD deficiency CAH results in insufficient cortisol synthesis, salt-wasting in the most severe form, and virilization of external genitalia in females due to androgen effect from the peripheral conversion of circulating Δ5 precursors to active Δ4 steroids. Simultaneous type II 3ß-HSD deficiency in the gonads results in incomplete virilization of the external genitalia in males. Thus, genital ambiguity can result in both sexes (70).


17 α -Hydroxylase/17,20 Lyase Deficiency


Steroid 17 α-hydroxylase/17,20 lyase deficiency accounts for approximately 1% of all CAH cases and affects steroid synthesis in both the adrenals and gonads(71). Patients have impaired cortisol synthesis, leading to ACTH over secretion, which increases serum levels of deoxycorticosterone and especially corticosterone, resulting in low renin hypertension, hypokalemia, and metabolic alkalosis. Affected females are born with normal external genitalia, however affected males are born with under-virilized genitalia due to their deficient gonadal testosterone production. 17 α-Hydroxylase/17,20 lyase deficiency is often recognized at puberty in female patients who fail to develop secondary sex characteristics (72).


Congenital Lipoid Adrenal Hyperplasia


Congenital lipoid adrenal hyperplasia is an extremely rare and severe form of CAH which is caused by mutations in the steroidogenic acute regulatory protein (StAR). Both the adrenal glands and the gonads exhibit a severe defect in the conversion of cholesterol to pregnenolone (73, 74). More specifically, StAR mediates the acute steroidogenic response by moving cholesterol from the outer to inner mitochondrial membrane (the rate-limiting step of steroidogenesis), and when this does not occur, cholesterol and cholesterol esters accumulate (75). In the most severe form, males with congenital lipoid hyperplasia are born with female-appearing external genitalia. Females have a normal genital phenotype at birth but remain sexually infantile without treatment. Salt wasting occurs in both males and females. If not detected and treated, the severe form of lipoid CAH is usually fatal (76).  Several cases have been reported that demonstrate that lipoid CAH has a spectrum of clinical presentation, with varying degrees of genital ambiguity (including normal male genitalia in a 46, XY male) and adrenal insufficiency. Mutations in the StAR protein have been reported that retain partial protein function, leading to variable phenotype (77).


The cholesterol side-chain cleavage enzyme (P450scc) is a very slow enzyme located on the inner mitochondrial membrane and catalyzes the conversion of cholesterol to pregnenolone in the first and rate-limiting step in the production of corticosteroids (78).  The CYP11A1 gene encoding P450cc lies on chromosome 15q23-24. Mutations in this gene are rare with approximately 20 patients reported (77-79).


Cytochrome P450 OxidoReductase Deficiency


Cytochrome P450 oxido-reductase (POR) deficiency is another rare form of CAH that is caused by a mutation on 7q11.2(80-82) P450 oxidoreductase is an important cofactor for electron transfer from nicotinamide adenine dinucleotide phosphate (NADPH) to several enzymes of steroidogenesis including 21-hydroxylase and 17α-hydroxylase/17,20-lyase. The various constellations of partial enzymatic deficiency of 21-hydroxylase, 17α-hydroxylase/17,20-lyase, and aromatase in the developing fetus account for the broad range of genital anomalies seen in both sexes (80).  Female newborns may have severe virilization, and males may have under-virilized genitalia due to combined partial 21-hydroxylase and 17α-hydroxylase/17,20-lyase deficiencies.  Maternal virilization and low maternal estriol levels are common findings during pregnancies with affected male and female fetuses. Maternal gestational virilization is likely due to the P450 oxidoreductase effect on placental P450 aromatase (82).  Many affected patients also have Antley-Bixler syndrome (type 2) characterized by craniosynostosis, radio-humeral or radioulnar synostosis, arachnodactyly and bowing of the femur (82).  


GENETICS


In general, all forms of CAH are transmitted in an autosomal recessive mode of inheritance as a monogenic disorder. However, there have been reports of cases where none or only one mutation in the responsible gene was identified, including in cases of 21 OHD CAH (83, 84), deficiency of the cholesterol side chain cleavage enzyme (85) and POR  deficiency (80). The genes responsible for each form of CAH are shown in Table 1.


21-Hydroxylase Deficiency


The gene encoding the enzyme 21-hydroxylase, CYP21A2, is a microsomal cytochrome P450 located on the short arm of chromosome 6 (86) in the human lymphocyte antigen (HLA) complex (87). CYP21A2 and its homologue, the pseudogene CYP21P, alternate with two genes called C4B and C4A (87, 88) that encode the two isoforms of the fourth component (C4) of serum complement (89). CYP21A2 and CYP21P, which each contain 10 exons, share 98% sequence homology in exons and approximately 96% sequence homology in introns (90, 91).

More than 140 mutations have been described including point mutations, small deletions, small insertions, and complex rearrangements of the gene (92). The most common mutations appear to be the result of either of two types of meiotic recombination events between CYP21 and CYP21P: 1) misalignment and unequal crossing over, resulting in large-scale DNA deletions, and 2) apparent gene conversion events that result in the transfer to CYP21A2 of smaller-scale deleterious mutations present in the CYP21P pseudogene (1, 93).


Both classical and non-classical 21-hydroxylase deficiency are inherited in a recessive manner as allelic variants of the CYP21A2 gene. Classical 21-hydroxylase deficiency tends to result from the presence of two severely affected alleles and non-classical 21-hydroxylase deficiency tends to result from the presence of either two mild 21-hydroxylase deficiency alleles or one severe and one mild allele (compound heterozygote). It is important to note, however, that the 10 most common mutations observed in CYP21A2 cause variable phenotype effects and are not always concordant with genotype. One study demonstrated that the genotype-phenotype concordance was as high as 90.5% for salt-wasting CAH, 85.1% for simple-virilizing CAH, and 97.8% for non-classical CAH (94).  In a study of 1,507 subjects with CAH by New et al, a direct genotype–phenotype correlation was noted in less than 50% of the genotypes studied. However, in the salt wasting and non-classical forms of 21OHD CAH, a phenotype was strongly correlated to a genotype (95). Moreover, it was shown in 2008  that CAG repeats in the androgen receptor have a great influence on variability in virilization of external genitalia of CAH women (96).


Figure 4. Common mutations in CYP21A2 gene and their related phenotypes. The numbers indicated exons of the gene. From: Forest MG. Recent advances in the diagnosis and management of congenital adrenal hyperplasia due to 21-hydroxylase deficiency (97).


DIAGNOSIS


Hormonal Diagnosis


Potential diagnosis of CAH must be suspected in infants born with atypical genitalia. The physician is obliged to make the diagnosis as quickly as possible to initiate therapy. The diagnosis and rational decision of sex assignment must rely on the determination of genetic sex, the hormonal determination of the specific deficient enzyme, and an assessment of the patient’s potential for future sexual activity and fertility. Physicians are urged to recognize the physical characteristics of CAH in newborns (e.g., atypical genitalia) and to refer such cases to appropriate clinics for full endocrine evaluation. As indicated in Table 1, each form of CAH has its own unique hormonal profile, consisting of elevated levels of precursors and elevated or diminished levels of adrenal steroid products. Traditionally, laboratories measured urinary excretion of adrenal hormones or their urinary metabolites (e.g., 17-ketosteroids). However, collection of 24-hour urine excretion is difficult, particularly in neonates. (98) Therefore, simple and reliable immunoassays are utilized now for measuring circulating serum levels of adrenal steroids (99). Alternatively, a non-invasive random urine collection in the first days of life for steroid hormone metabolites and precursor/product ratio assessments can be measured simultaneously. It can be used independently or in conjunction with serum steroid assays to increase accuracy and confidence in making the diagnosis and distinguishing the separate enzymatic forms of the disorder (100, 101).


Diagnosis of the 21OHD CAH can also be confirmed biochemically by a hormonal evaluation in blood or serum. In a randomly timed blood sample, a very high concentration of 17-hydroxyprogesterone (17-OHP), the precursor of the defective enzyme, is diagnostic of classical 21OHD. Such testing is the basis of the newborn-screening program developed to identify classically affected patients who are at risk for salt wasting crisis (102). Only 20µl blood, obtained by heel prick and blotted on microfilter paper, is used for this purpose to provide a reliable diagnostic measurement of 17-OHP. The simplicity of the test and the ease of transporting microfilter paper specimens by mail have facilitated the implementation of CAH newborn screening programs worldwide. As of 2009, all 50 states in the United States screen for CAH.  Now, more than 35 countries worldwide have also established newborn screening programs. (103) False-positive results are, however, common with premature infants (104). Appropriate references based on weight and gestational age are therefore in place in many screening programs (105). The majority of screening programs use a single screening test without retesting of questionable 17-OHP concentrations. To improve efficacy, a small number of programs perform a second screening test of the initial sample to re-evaluate borderline cases identified by the first screening. Current immunoassay methods used in newborn screening programs yield a high false positive rate. To decrease this high rate, liquid-chromatography- tandem mass spectrometry measuring different hormones (17-OHP, Δ4-androstenedione, and cortisol) has been suggested as a second-tier method of analyzing positive results (106).


The gold standard for hormonal diagnosis is the corticotropin stimulation test (250 μg cosyntropin intravenously), measuring levels of 17-OHP and Δ4-androstenedione at baseline and 60 min. These values can then be plotted in the published nomogram (Figure 5) to ascertain disease severity (107). It is important to note that the corticotropin stimulation test should not be performed during the initial 24 hours of life as samples from this period are typically elevated in all infants and may yield false-positive results.  Testing is typically performed between 48 to 72 hours of life in newborns suspected of classical CAH and glucocorticoid treatment is initiated while awaiting results.  In newborns who are hemodynamically unstable and adrenal crisis is suspected, stimulation testing may delay life-saving treatment.  Screening measurements of 17-OHP, cortisol, and adrenal androgen along with ACTH can be obtained before emergent glucocorticoid administration.  The corticotropin stimulation test is crucial in establishing hormonal diagnosis of non-classical form of the disease since early-morning values of 17-OHP may not be sufficiently elevated to allow accurate diagnosis.


Figure 5. Nomogram relating baseline to ACTH-stimulated serum concentrations of 17-hydroxyprogesterone (17-OHP). The scales are logarithmic. A regression line for all data points is shown. Data points cluster as shown into three nonoverlapping groups: classic and non-classic forms of 21-hydroxylase deficiency are readily distinguished from each other and from those that are heterozygotes and unaffected. Distinguishing unaffected from heterozygotes is difficult. (107) Adapted from: New MI, Lorenzen F, Lerner AJ, et al. 1983 Genotyping steroid 21-hydroxylase deficiency: hormonal reference data. J Clin Endocrinol Metab 57:320-6. Permission obtained.


Prenatal Diagnosis of 21OHD


A number of approaches to prenatal identification of affected fetuses have been used. In 1965, Jeffcoate et al first reported a successful prenatal diagnosis of 21OHD, based on elevated levels of 17-ketosteroids and pregnanetriol in the amniotic fluid (108). The hormonal diagnostic test for 21OHD is amniotic fluid 17-OHP. Hormonal diagnosis is rarely used and considered only when molecular diagnosis is unavailable.


Advances in genotyping of the CYP21A2 gene have made molecular genetic studies of extracted fetal DNA the ideal method to diagnose 21OHD CAH in the fetus. Approximately 95% to 98% of the mutations causing 21OHD have been identified through a combination of molecular genetic techniques to study large gene rearrangement and arrays of point mutations (109, 110). Of the currently available methods for prenatal diagnosis of CAH, chorionic villus sampling (CVS), rather than amniocentesis, with molecular genotyping is the preferred diagnostic method in use. CVS is performed between the 9th and 11th week of gestation, while amniocentesis is usually performed in the second trimester. The timing of prenatal diagnosis is particularly important when deciding to treat the fetus at risk for CAH with dexamethasone prenatally to prevent virilization of the genitalia (see Prenatal Treatment below). As we only wish to treat affected females until term and only 1/8 of the fetuses will be affected and 1/2 will be males, 7 out of 8 fetuses do not require treatment. Thus, amniocentesis, which is performed later in gestation, results in treatment of unaffected fetuses for a longer period of time than CVS. However, amniocentesis can be used as a reliable alternative method of prenatal diagnosis when CVS in unavailable. In such instances, the supernatant is used for hormonal measurement and the cells are cultured to obtain a genotype through DNA analysis. The supernatant hormone measurements distinguish affected status from unaffected status only in SW patients. Nonetheless, pitfalls do occur in a small percentage of the patients undergoing prenatal diagnosis utilizing genetic diagnosis, such as undetectable mutations (111), allele drop outs (112), or maternal DNA contamination. Commercially available genetic testing utilizing short range PCR to detect common mutations may miss rare de novo mutations and thus the ACTH stimulation test remains vital to the evaluation.  Determination of satellite markers may increase the accuracy of molecular genetic analysis (113).


Non-Invasive Prenatal Diagnosis of CAH


Virilization of the genitalia in a female fetus affected with CAH owing to 21OHD and 11B-OHD can be treated prenatally with dexamethasone administered to the mother (see Prenatal Treatment below). Because CAH is an autosomal recessive disorder, the risk is 1/4 of the fetus being affected with the disease and 1/8 of the fetus being a female with atypical genitalia. Therefore, 7 out of 8 pregnancies will receive unnecessary treatment until the sex and the affection status of the fetus are known. Treatment with dexamethasone must begin before the 9th week of gestation, yet chorionic villous sampling can only be done at the 9-11th week, with karyotype and DNA results available 2-3 weeks later. Non-invasive prenatal diagnosis would eliminate unnecessary treatment and invasive procedures such as CVS and amniocentesis. Dennis Lo et al. in 1997 discovered the presence of fetal DNA in the maternal circulation (113). Fetal DNA has been extracted and enriched with high accuracy and yield in fetal Rh factor identification (114), aneuploidy and monogenic disorders such as thalassemia and cystic fibrosis (115). Identification of the SRY sequence in maternal blood, performed in multiple academic centers and now available in commercial laboratories, has also achieved excellent accuracy in several studies (116, 117). In non-invasive prenatal diagnosis of CAH, by extracting fetal DNA from the maternal blood as early as 4-5 weeks gestation, the SRY sequence can be identified to determine sex (118). If the fetal genetic sex is deduced to be female (SRY sequence not identified), DNA analysis on extracted fetal DNA can be used to determine CAH affected status. Targeted massive parallel sequencing of cell-free fetal DNA in maternal plasma was used for the noninvasive prenatal diagnosis of CAH due to 21OHD(119).   In the fourteen expectant families studied, each with a previous child affected with classical CAH (proband) and parents with at least one mutant CYP21A2 gene, the fetal CAH affection status was correctly deduced using this method from maternal plasma drawn as early as 5 weeks and 6 days (119).


Preimplantation Diagnosis


Preimplantation genetic diagnosis (PGD) identifies genetic abnormalities in preimplantation embryos prior to embryo transfer, so only unaffected embryos established from IVF are transferred. The procedure has been utilized in many monogenic recessive disorders such as cystic fibrosis, hemoglobinopathies, spinal muscular atrophy and Tay Sach’s disease. PGD is being used for a growing number of genetic diseases (120). There is only one report of PGD utilized in a family whose offspring is at risk for CAH (121), however we know from experience that families are seeking PGD with greater frequency. It would be desirable to have further studies of preimplantation diagnosis in CAH families.


Prenatal Treatment


In 21OHD, prenatal treatment with dexamethasone was introduced in France in 1978 (122) and in the United States in 1986 (123). Institution of therapy before the 9th week of gestation, prior to the onset of adrenal androgen secretion, effectively suppresses excessive adrenal androgen production and prevents virilization of external female genitalia. Dexamethasone is used because it binds minimally to cortisol binding globulin (CBG) in the maternal blood, and unlike hydrocortisone, it escapes inactivation by the placental 11-dehydrogenase enzyme. Thus, dexamethasone crosses the placenta from the mother to the fetus and suppresses ACTH secretion with longer half-life compared to other synthetic steroids (123).


When dexamethasone administration begins as early as the 8th week of gestation, the treatment is blind to the disease status and sex of the fetus. If the fetus is later determined to be a male upon karyotype or an unaffected female upon DNA analysis, treatment is discontinued. Otherwise, treatment is continued to term. A simplified algorithm of management of potentially affected pregnancies is shown in Figure 6.  The optimal dosage is 20 µg/kg/day of dexamethasone per maternal pre-pregnancy body weight, in three divided daily doses (124). It is recommended to start the treatment as soon as pregnancy is confirmed, and no later than 9 weeks after the last menstrual period (125, 126). The mother’s blood pressure, weight, glycosuria, HbA1C, symptoms of edema, striae and other possible adverse effects of dexamethasone treatment should be carefully observed throughout pregnancy (127) . Prenatal dexamethasone treatment remains controversial and should be administered under an IRB approved research protocol(104).


Figure 6. Algorithm of treatment, diagnosis and decision-making for prenatal treatment of fetuses at risk for 21-hydroxylase deficiency congenital adrenal hyperplasia. Mercado AB, Wilson RC, Cheng KC, Wei JQ, New MI 1995 Extensive personal experience: Prenatal treatment and diagnosis of congenital adrenal hyperplasia owing to steroid 21-hydroxylase deficiency. J Clin Endocrinol Metab 80:2014-2020. (125) Permission obtained.


Outcome of Prenatal Treatment of 21OHD


Prenatal treatment of 21OHD has proven to be successful in significantly reducing genital virilization in affected females. Our group has performed prenatal diagnosis in over 685 pregnancies at risk for 21OHD, and 59 affected female fetuses have been treated to term (128). Treatment was highly effective in preventing genital ambiguity when the mother was compliant until term. In all the female fetuses treated to term, the degree of virilization was on average 1.69, as measured using the Prader scoring system (Figure 3). Late treatment as well as no treatment resulted in much greater virilization, and the average Prader score was 3.73 for those female fetuses not treated. 124 and unpublished data Not only does prenatal treatment effectively minimize the degree of female genital virilization in the patients, it also lessens the high-level androgen exposure of the brain during differentiation. The latter is thought to cause a higher tendency to gender ambiguity in some females with CAH (129, 130). Genital virilization in female newborns with classical 21OHD CAH has potential adverse psychosocial implications that may be alleviated by prenatal treatment (124).


Prenatal dexamethasone treatment has continued to be a subject of controversy (104). Some uncertainties and concerns have been expressed about the long-term safety of prenatal diagnosis and treatment (131, 132). Concerns have been raised in regards to the glucocorticoid effects on the fetal brain, which arise from studies of other conditions rather than direct studies on prenatal treatment of 21OHD CAH. These include studies whereby much higher doses of dexamethasone were given to the human subjects at the later part of pregnancy (133) or to animals (134, 135) and therefore hold little relevance to using dexamethasone prenatally in CAH. In a small-sample study of children prenatally treated with dexamethasone, Lajic and her colleagues found no effects on intelligence, handedness, memory encoding, or long-term memory, but short-term treated CAH-unaffected children had significantly poorer performance than controls on a test of verbal working memory. These patients also had lower questionnaire scores in self-perceived scholastic competence and social anxiety (136). However, parents described these children as more sociable than controls, without significant difference in psychopathology, school performance, adaptive functioning or behavioral problems (137). A larger multi-center study (US and France) indicated no adverse cognitive effects of short-term prenatal DEX exposure, including no adverse influence on verbal working memory; a small sample of dexamethasone treated girls affected with CAH showed lower scores on two of eight neuropsychological tests, however given the variability of cognitive findings in dexamethasone unexposed CAH-affected patients, this result cannot be linked to dexamethasone with certainty (138). This indicates that further studies are needed.


Compelling data from large cohorts of pregnancies with prenatal diagnosis and treatment of 21OHD CAH prove its efficacy and safety (126, 139). All of the mothers who received prenatal treatment (partial or full-term) stated that they would take dexamethasone again for a future pregnancy (140).  Rare adverse events have been reported in treated children, but no harmful effects have been documented that can be clearly attributed to the treatment (141). Another long-term follow-up study in Scandinavia showed that 44 children who were variably treated prenatally demonstrated normal prenatal and postnatal growth compared to matched controls. Further, there was no observed increase in fetal abnormalities or fetal death (142). Although some abnormalities in postnatal growth and behavior were observed among dexamethasone exposed offspring, none could logically be explained by the present knowledge of teratogenic effects of glucocorticoids.


Published studies of almost 600 pregnancies, 80 of which were prenatally treated until term and 27 who were male and received dexamethasone for a short period of time, the newborns in the dexamethasone treated group did not differ in weight, length or head circumference from untreated, unaffected siblings. No significant or enduring side effects were noted in either the mothers or the fetuses. Greater weight gain in treated versus untreated mothers did occur, as well as the presence of striae and edema. Excessive weight gain was lost after birth. No differences were found regarding gestational diabetes or hypertension (127). No cases have been reported of cleft palate, placental degeneration or fetal death, which have been observed in the rodent model of in utero exposure to high-dose glucocorticoids (143). One explanation for the safety of human versus rodent is that glucocorticoid receptor-ligand systems in human differ from that of rodents (144). A comprehensive long-term outcome study looking at 149 male and female patients 12 years of age and older, affected and unaffected with CAH, who were treated with dexamethasone partially or to term was conducted. To date, this is the largest study evaluating the long-term effects of dexamethasone. No adverse effects such as increased risk for cognitive defects, disorders of gender identity and behavior, sexual function in adulthood, hypertension, diabetes, and osteopenia were found (127).


Prenatal Diagnosis and Treatment of 11β-OHD CAH


Several approaches to prenatal identification by measuring steroid precursors in affected fetuses have been used (145-147). Advances in genotyping of the CYP11B1 gene have made molecular genetic studies of fetal DNA extracted from maternal blood, the ideal method to diagnose 11β-OHD CAH in the fetus (148, 149). The established protocol of prenatal diagnosis and treatment in 21OHD CAH can be applied to 11β-OHD CAH. Reduced virilization of affected females in prenatal diagnosis and treatment in 11β-OHD CAH have been reported (128, 148).


TREATMENT


Hormone Replacement


The goal of therapy in CAH is to both correct the deficiency in cortisol secretion and to suppress ACTH overproduction (104). Proper treatment with glucocorticoid reduces stimulation of the androgen pathway, thus preventing further virilization and allowing normal growth and development. The usual requirement of hydrocortisone (or its equivalent) for the treatment of classical 21OHD form of CAH is about 10-15 mg/m2/day divided into 2 or 3 doses per day.  Conventionally, oral hydrocortisone tablets with the smallest available dose of 5 mg have been preferred.  To administer small doses to infants and young children, 10 mg and 5 mg tablets have to be cut and crushed.  Hydrocortisone granules and tablets at smaller doses are becoming more widely available allowing for ease of administration and avoidance of excess dosing (150).


Dosage requirements for patients with NC-21OHD CAH are typically less. Adults may be treated with the longer-acting dexamethasone or prednisone, alone or in combination with hydrocortisone. A small dose of dexamethasone at bedtime (0.25 to 0.5 mg) is usually adequate for androgen suppression in non-classical patients. Anti-androgen treatment may be useful as adjunctive therapy in adult women who continue to have hyperandrogenic signs despite good adrenal suppression. Females with concomitant PCOS may benefit from an oral contraceptive, though this treatment would not be appropriate for patients trying to get pregnant. Treatment of adult males with NC-21OHD may not be necessary, though our group has found that it may be helpful in preventing adrenal rest tumors and preserving fertility. Optimal corticosteroid therapy is determined by adequate suppression of adrenal hormones balanced against normal physiological parameters. The goal of corticosteroid therapy is to give the lowest dose required for optimal control. Adequate biochemical control is assessed by measuring serum levels 17-OHP and androstenedione; serum testosterone can be used in females and prepubertal males (but not in newborn males). It is recommended that hormone levels are measured at a consistent time in relation to medication dosing, usually 2 hours after the morning corticosteroid. Titration of the dose should be aimed at maintaining androgen levels at age and sex-appropriate levels and 17-OHP levels of <1000 ng/dL.  Analysis of diurnal and 24-hour urine collection of 17-OHP metabolites can be utilized to further assess adrenal control. (151)  Concurrently, over-treatment should be avoided because it can lead to Cushing syndrome. Depending on the degree of stress, stress dose coverage may require doses of up to 50-100 mg/m2/day (1).


Patients with salt-wasting CAH have elevated plasma renin in response to the sodium-deficient state, and they require treatment with the salt-retaining 9α-fludrocortisone acetate. The average dose is 0.1 mg daily, ranging from 0.05 mg to 0.2 mg daily. Infants should also be started on salt supplementation, as sodium chloride, at 1-2 g daily, divided into several feedings. Although patients with the SV and NC form of CAH can make adequate aldosterone, the aldosterone to renin ratio (ARR) has been found to be lower than normal, though not to the degree seen in the salt-wasting form (152)(155). It has not been customary to supplement conventional glucocorticoid replacement therapy with the administration of salt-retaining steroids in the SV and NC forms of CAH, though there has been some suggestion that adding fludrocortisone to patients with elevated PRA may improve hormonal control of the disease (153). The requirement for fludrocortisone appears to diminish with age, and over-suppression of the PRA should be avoided, to prevent complications from hypertension and excessive mineralocorticoid activity. Measurements of plasma renin and aldosterone are used to monitor the efficacy of mineralocorticoid therapy in all patients with the salt wasting form of the disease (1). The use of systemic cortisol injection for impending adrenal crises is discussed below.


In managing 11β-OHD, glucocorticoid administration provides cortisol replacement and decreases ACTH, as it does in 21OHD. This in turn removes the drive for over secretion of deoxycorticosterone (DOC) and 11-deoxycortisol and, in most cases, normalizes blood pressure. A thorough examination undertaken by endocrine challenge and suppression studies to evaluate zonal differences has shown that in 11β-OHD CAH, the zona fasciculata exhibits reduced 11β-hydroxylation and 18-hydroxylation, while both functions appear to be spared in the zona glomerulosa (154). This demonstrates that the zona glomerulosa and the zona fasciculata function as two physiologically, and likely genetically, separate glands. Glucocorticoid treatment produces natriuresis and diuresis, normalizes plasma volume and thus increases the plasma renin to levels that stimulate aldosterone production in the zona glomerulosa. In addition to normalizing blood pressure, the goal of treatment is to replace deficient steroids and in turn minimize adrenal sex hormone excess, prevent virilization, optimize growth, and protect potential fertility. Serum DOC and 11-deoxycortiol are thus the principal steroid index of the 11β-OHD. Plasma renin activity is useful as a therapeutic index as well. In poorly controlled 11β-OHD patients, DOC is elevated, whereas plasma renin is suppressed; both are normal in well-controlled patients. As in patients with 21OHD, oral hydrocortisone at a dose of 10-15 mg/m2 divided into two to three daily doses is the preferred treatment. Long-acting glucocorticoids may be used at or near the completion of linear growth. In patients who have had ongoing hypertension for some time before diagnosis is made, adding spironolactone, calcium channel blockers or amiloride may be necessary (60).


In patients with 3β-HSD deficiency, glucocorticoid administration also reduces the excess production of androgens. In addition, these patients have mineralocorticoid deficiency and require treatment with the salt-retaining 9α-fludrocortisone acetate. Patients with the StAR protein deficiency or SCC deficiency (lipoid form of CAH) classically have severe adrenal insufficiency with mineralocorticoid deficiency and salt wasting; they require both glucocorticoid and mineralocorticoid replacement. Patients with 17 α -hydroxylase/17,20 lyase deficiency typically have excess DOC and low-renin hypertension, and treatment with a glucocorticoid should normalize serum DOC level and lead to normalization of blood pressure. In several conditions, such as StAR protein deficiency, 3β-HSD, 17 α -hydroxylase/17,20 lyase deficiency and cytochrome P450 oxidoreductase deficiency, patients require sex steroid replacement. Sex steroids should be added at a developmentally appropriate time to allow patients to resemble their peers.


Because patients with CAH are at risk for short stature as adults, other adjunct therapies are being utilized. Two studies have demonstrated significant improvement in growth velocity, final adult height prediction (17) and final adult height (15) with the use of growth hormone in conjunction with a GnRH analogue.


In non-life-threatening periods of illness or physiologic stress, the corticosteroid dose should be increased to 2 or 3 times the maintenance dose for the duration of that period. Each family should be given injection kits of hydrocortisone for emergency use (25 mg for infants, 50 mg for children, and 100 mg for adults). In the event of a surgical procedure, a total of 5 to 10 times the daily maintenance dose may be required during the first 24-48 hours, which can then be tapered over the following days to the normal preoperative schedule. Stress doses of dexamethasone should not be given because of the delayed onset of action. It is not necessary for increased mineralocorticoid doses during these periods of stress (1, 104).


It is imperative for all patients who are receiving corticosteroid replacement therapy, such as patients with CAH, to wear a Medic-Alert bracelet, medallion, or equivalent identification that will enable correct and appropriate therapy in case of emergencies. Additionally, all responsible family members should be trained in the intramuscular administration of hydrocortisone.


Bone Mineral Density


In order to adequately suppress androgen production in patients with CAH, the usual requirement of hydrocortisone is generally higher than the endogenous secretory rate of cortisol. Chronic therapy with glucocorticoids at supraphysiologic levels can result in diminished bone accrual and lead to osteopenia and osteoporosis. Glucocorticoid induced bone loss is a well-known phenomenon and is the most prevalent form of secondary osteoporosis (155, 156).


Unlike other diseases treated with chronic glucocorticoid therapy, however, the effect of glucocorticoid replacement in CAH on BMD is unclear. Previous studies of patients with 21OHD have reported increased, normal, or decreased BMD (157-160). It has been postulated that the elevated androgens typically found in patients may have a protective effect on bone integrity, but the precise mechanism is unknown. The increased adrenal androgens, which are converted to estrogens, may counteract the detrimental effects of glucocorticoids on bone mass. This may explain why older CAH women, particularly those who are post-menopausal, are at higher risk for osteoporosis than younger CAH patients. It has been proposed that the inhibitory effect of corticosteroid therapy on bone formation is counteracted by estrogen’s effect on bone resorption through the RANK-L/osteoprotegerin (OPG) system (161).


Surgery


The decision for genital surgery in females with virilizing forms of CAH and males with forms of CAH associated with under virilization should be made by parents or patients themselves with the guidance of a multidisciplinary team involving pediatric endocrinology, urology, genetics, and psychology.  As part of a case-by-case approach, attention should be given to gender identity, quality of life and potential for fertility.  The aim of surgical repair in females with atypical genitalia caused by CAH, if the decision is made, is generally to preserve the sexually sensitive glans clitoris, decrease frequency of urinary tract infections and provide a vaginal orifice that functions adequately for menstruation, intromission, and delivery. A medical indication for early surgery other than for sex assignment is recurrent urinary tract infections as a result of pooling of urine in the vagina or urogenital sinus.


In the past, it was routine to recommend early corrective surgery for neonates born with atypical genitalia. However, in recent years, the implementation of early corrective surgery has become increasingly controversial due to lack of data on long-term functional outcome. Data show that genital sensitivity is impaired in areas where feminizing genital surgery had been done, leading to difficulties in sexual function (162). Another study showed that patients with more severe mutations in the CYP21A2 gene, i.e., those with the null genotype and thus those more severely virilized, had more surgical complications that those less severely virilized and were less satisfied with their sexual life (163). Because of the scarcity of these data, the role of the parents in sex assignment becomes crucial in all aspects of the decision-making process, and should include full discussion of the controversy and all possible therapeutic options for the intersex child, particularly early versus delayed surgery. A large repository of data concerning long-term outcomes in patients affected by CAH, including psychosexual well-being, has been enhanced by the establishment of disease registries (164).


In a study of intersex individuals ≥ 16 years old, 66% of individuals with CAH thought that the appropriate age of genital surgery was infancy or childhood (165).  In a study of caregivers of female infants with CAH who underwent genitoplasty, 2/3 of caregivers reported no regret over their decision-making.  However, 1/3 reported some level of regret in the process (165).


Other Treatment Strategies and Novel Therapies


Glucocorticoid replacement has been an effective treatment for CAH for over 50 years and remains its primary therapy; however, the management of these patients presents a challenge because both inadequate treatment, as well as over suppression, can cause complications.  In forms of CAH with decreased cortisol production, increased ACTH production stimulates excessive synthesis of adrenal products in those pathways unimpaired by the enzyme deficiency such as androgens.  The goal of therapy in CAH is to both correct the deficiency in cortisol secretion and to suppress ACTH overproduction which drives androgen production (104).


Often, doses of hydrocortisone higher than physiologic replacement or dosing in reverse diurnal pattern are required to suppress androgen production driven by ACTH.   Alternatives to oral glucocorticoid administration 2-3 times a day include continuous subcutaneous pump and newer modified release formulations.  Physiologic cortisol secretion patterns can be mimicked with varied infusion rates of hydrocortisone via continuous subcutaneous pump administration.  This more intense method of administration should be considered in those with rapid cortisol metabolism or poor gastrointestinal absorption (166).  Modified release and delayed release formulations of hydrocortisone were developed recently (167).  When taken at bedtime, these formulations approximate the diurnal pattern of physiological cortisol production with an early morning peak and aim to prevent the ACTH surge at dawn that drives androgen production (168).


Adjunct treatments targeting hypothalamic and pituitary signaling to the adrenal glands are in development. To suppress ACTH production, corticotrophin-releasing factor (CRF) antagonists have been developed. CRF produced in the hypothalamus stimulates the release of ACTH from the pituitary gland.   CRF antagonism can reduce ACTH production and reduce ACTH driven androgen production in patients with CAH.  With the adjunct use of CRF antagonists, lower doses of hydrocortisone can be used for physiologic replacement only. Two oral agents are currently undergoing clinical trials in patients with classical CAH (169, 170).


To reduce androgen production, the use of abiraterone acetate indicated for prostate cancer was proposed for patients with CAH. (171)  Abiraterone acetate is a potent inhibitor of steroid enzyme 17-hydroxylase/17,20-lyase (CYP17A1) needed for androgen production and is being studied in clinical trials as adjunct therapy in adult and soon pediatric subjects. (164, 172)


Bilateral adrenalectomy is a radical measure that can be effective in some cases. A few patients who were extremely difficult to control with medical therapy alone showed improvement in their symptoms after bilateral adrenalectomy (164, 165). Because this approach renders the patient completely adrenal insufficient, however, it should be reserved for extreme cases and is not a good treatment option for patients who have a history of poor compliance with medication.


CONCLUSION


The pathophysiology of the various types of CAH (the most common being 21OHD) can be traced to specific, inherited defects in the genes encoding enzymes for adrenal steroidogenesis. Clinical presentation of each form is distinctive and depends largely on the underlying enzyme defect, its precursor retention and deficient end products. Treatment of CAH is targeted to replace the insufficient adrenal hormones, notably cortisol and salt retaining hormones, and to suppress the excess precursors. With proper hormone replacement therapy, normal and healthy development may be expected. Glucocorticoid and, if necessary, mineralocorticoid replacement, has been the mainstay of treatment for CAH, but new treatment strategies continue to be developed and studied to improve care. Molecular genetic techniques used postnatally and prenatally along with well described genotype phenotype correlations can help guide clinical management. 


REFERENCES


  1. New MI, L.O., Mancenido D, Parsa A, Yuen T, Congenital Adrenal Hyperplasia Owing to 21-Hydroxylase Deficiency, in Genetic Steroid Disorders, L.O. New MI, Parsa A, Yuen T, O'Malley BW, Hammer GD, Editor. 2014, Elsevier: San Diego, CA. p. 29-51.
  2. Pang, S.Y., et al., Worldwide experience in newborn screening for classical congenital adrenal hyperplasia due to 21-hydroxylase deficiency. Pediatrics, 1988. 81(6): p. 866-74.
  3. Speiser, P.W., et al., High frequency of nonclassical steroid 21-hydroxylase deficiency. Am J Hum Genet, 1985. 37(4): p. 650-67.
  4. Sherman, S.L., et al., A segregation and linkage study of classical and nonclassical 21-hydroxylase deficiency. Am J Hum Genet, 1988. 42(6): p. 830-8.
  5. Zerah, M., et al., Prevalence of nonclassical steroid 21-hydroxylase deficiency based on a morning salivary 17-hydroxyprogesterone screening test: a small sample study. J Clin Endocrinol Metab, 1990. 70(6): p. 1662-7.
  6. Zachmann, M., D. Tassinari, and A. Prader, Clinical and biochemical variability of congenital adrenal hyperplasia due to 11 beta-hydroxylase deficiency. A study of 25 patients. J Clin Endocrinol Metab, 1983. 56(2): p. 222-9.
  7. Curnow, K.M., et al., Mutations in the CYP11B1 gene causing congenital adrenal hyperplasia and hypertension cluster in exons 6, 7, and 8. Proc Natl Acad Sci U S A, 1993. 90(10): p. 4552-6.
  8. Khemiri, M., et al., (11 beta hydroxylase deficiency: a clinical study of seven cases). Tunis Med, 2006. 84(2): p. 106-13.
  9. Rosler, A., E. Leiberman, and T. Cohen, High frequency of congenital adrenal hyperplasia (classic 11 beta-hydroxylase deficiency) among Jews from Morocco. Am J Med Genet, 1992. 42(6): p. 827-34.
  10. Paperna, T., et al., Mutations in CYP11B1 and congenital adrenal hyperplasia in Moroccan Jews. J Clin Endocrinol Metab, 2005. 90(9): p. 5463-5.
  11. Xing Y, A.J., Hammer GD, Adrenal Development, in Genetic Steroid Disorders L.O. New MI, Mancenido D, Parsa A, Yuen T, Editor. 2014, Elsevier: San Diego, CA. p. 5-27.
  12. Goto, M., et al., In humans, early cortisol biosynthesis provides a mechanism to safeguard female sexual development. J Clin Invest, 2006. 116(4): p. 953-60.
  13. Prader, A. and H.P. Gurtner, (The syndrome of male pseudohermaphrodism in congenital adrenocortical hyperplasia without overproduction of androgens (adrenal male pseudohermaphrodism)). Helv Paediatr Acta, 1955. 10(4): p. 397-412.
  14. New, M.I., et al., Growth and final height in classical and nonclassical 21-hydroxylase deficiency. J Endocrinol Invest, 1989. 12(8 Suppl 3): p. 91-5.
  15. Lin-Su, K., et al., Final adult height in children with congenital adrenal hyperplasia treated with growth hormone. J Clin Endocrinol Metab, 2011. 96(6): p. 1710-7.
  16. Halper, A., et al., Use of an aromatase inhibitor in children with congenital adrenal hyperplasia: Impact of anastrozole on bone mineral density and visceral adipose tissue. Clin Endocrinol (Oxf), 2019. 91(1): p. 124-130.
  17. Trinh, L., et al., Growth and pubertal characteristics in patients with congenital adrenal hyperplasia due to 21-hydroxylase deficiency. J Pediatr Endocrinol Metab, 2007. 20(8): p. 883-91.
  18. Helleday, J., et al., Subnormal androgen and elevated progesterone levels in women treated for congenital virilizing 21-hydroxylase deficiency. J Clin Endocrinol Metab, 1993. 76(4): p. 933-6.
  19. Premawardhana, L.D., et al., Longer term outcome in females with congenital adrenal hyperplasia (CAH): the Cardiff experience. Clin Endocrinol (Oxf), 1997. 46(3): p. 327-32.
  20. Richards, G.E., et al., The effect of long acting glucocorticoids on menstrual abnormalities in patients with virilizing congenital adrenal hyperplasia. J Clin Endocrinol Metab, 1978. 47(6): p. 1208-15.
  21. Barnes, R.B., et al., Ovarian hyperandrogynism as a result of congenital adrenal virilizing disorders: evidence for perinatal masculinization of neuroendocrine function in women. J Clin Endocrinol Metab, 1994. 79(5): p. 1328-33.
  22. Abdelhamed, M.H., W.M. Al-Ghamdi, and A.E. Al-Agha, Polycystic Ovary Syndrome Among Female Adolescents With Congenital Adrenal Hyperplasia. Cureus, 2021. 13(12): p. e20698.
  23. Long, D.N., A.B. Wisniewski, and C.J. Migeon, Gender role across development in adult women with congenital adrenal hyperplasia due to 21-hydroxylase deficiency. J Pediatr Endocrinol Metab, 2004. 17(10): p. 1367-73.
  24. Hines, M., C. Brook, and G.S. Conway, Androgen and psychosexual development: core gender identity, sexual orientation and recalled childhood gender role behavior in women and men with congenital adrenal hyperplasia (CAH). J Sex Res, 2004. 41(1): p. 75-81.
  25. Meyer-Bahlburg, H.F., et al., Sexual orientation in women with classical or non-classical congenital adrenal hyperplasia as a function of degree of prenatal androgen excess. Arch Sex Behav, 2008. 37(1): p. 85-99.
  26. de Jesus, L.E., E.C. Costa, and S. Dekermacher, Gender dysphoria and XX congenital adrenal hyperplasia: how frequent is it? Is male-sex rearing a good idea? J Pediatr Surg, 2019. 54(11): p. 2421-2427.
  27. Berenbaum, S.A., K.L. Bryk, and A.M. Beltz, Early androgen effects on spatial and mechanical abilities: evidence from congenital adrenal hyperplasia. Behav Neurosci, 2012. 126(1): p. 86-96.
  28. Berenbaum, S.A., K.K. Bryk, and S.C. Duck, Normal intelligence in female and male patients with congenital adrenal hyperplasia. Int J Pediatr Endocrinol, 2010. 2010: p. 853103.
  29. Reichman, D.E., et al., Fertility in patients with congenital adrenal hyperplasia. Fertil Steril, 2014. 101(2): p. 301-9.
  30. Mulaikal, R.M., C.J. Migeon, and J.A. Rock, Fertility rates in female patients with congenital adrenal hyperplasia due to 21-hydroxylase deficiency. N Engl J Med, 1987. 316(4): p. 178-82.
  31. Engels, M., et al., Testicular Adrenal Rest Tumors: Current Insights on Prevalence, Characteristics, Origin, and Treatment. Endocr Rev, 2019. 40(4): p. 973-987.
  32. Cabrera, M.S., M.G. Vogiatzi, and M.I. New, Long term outcome in adult males with classic congenital adrenal hyperplasia. J Clin Endocrinol Metab, 2001. 86(7): p. 3070-8.
  33. Urban, M.D., P.A. Lee, and C.J. Migeon, Adult height and fertility in men with congenital virilizing adrenal hyperplasia. N Engl J Med, 1978. 299(25): p. 1392-6.
  34. Claahsen-van der Grinten, H.L., et al., Prevalence of testicular adrenal rest tumours in male children with congenital adrenal hyperplasia due to 21-hydroxylase deficiency. Eur J Endocrinol, 2007. 157(3): p. 339-44.
  35. Molitor, J.T., B.S. Chertow, and B.L. Fariss, Long-term follow-up of a patient with congenital adrenal hyperplasia and failure of testicular development. Fertil Steril, 1973. 24(4): p. 319-23.
  36. Claahsen-van der Grinten, H.L., et al., Testicular adrenal rest tumors in patients with congenital adrenal hyperplasia can cause severe testicular damage. Fertil Steril, 2008. 89(3): p. 597-601.
  37. Wilkins, L., et al., Further studies on the treatment of congenital adrenal hyperplasia with cortisone. III. The control of hypertension with cortisone, with a discussion of variations in the type of congenital adrenal hyperplasia and report of a case with probable defect of carbohydrate-regulating hormones. J Clin Endocrinol Metab, 1952. 12(8): p. 1015-30.
  38. Blumberg-Tick, J., et al., Testicular tumors in congenital adrenal hyperplasia: steroid measurements from adrenal and spermatic veins. J Clin Endocrinol Metab, 1991. 73(5): p. 1129-33.
  39. Schoen, E.J., V. Di Raimondo, and O.V. Dominguez, Bilateral testicular tumors complicating congenital adrenocortical hyperplasia. J Clin Endocrinol Metab, 1961. 21: p. 518-32.
  40. Miller, E.C., Jr. and H.L. Murray, Congenital adrenocortical hyperplasia: case previously reported as "bilateral interstitial cell tumor of the testicle". J Clin Endocrinol Metab, 1962. 22: p. 655-7.
  41. Glenn, J.F. and W.H. Boyce, Adrenogenitalism with testicular adrenal rests simulating interstitial cell tumor. J Urol, 1963. 89: p. 457-63.
  42. Srikanth, M.S., et al., Benign testicular tumors in children with congenital adrenal hyperplasia. J Pediatr Surg, 1992. 27(5): p. 639-41.
  43. Rutgers, J.L., R.H. Young, and R.E. Scully, The testicular "tumor" of the adrenogenital syndrome. A report of six cases and review of the literature on testicular masses in patients with adrenocortical disorders. Am J Surg Pathol, 1988. 12(7): p. 503-13.
  44. Sugino, Y., et al., Genotyping of congenital adrenal hyperplasia due to 21-hydroxylase deficiency presenting as male infertility: case report and literature review. J Assist Reprod Genet, 2006. 23(9-10): p. 377-80.
  45. Klein, R., Evidence for and against the existence of a salt-losing hormone. J Pediatr, 1960. 57: p. 452-60.
  46. Kowarski, A., et al., Aldosterone Secretion Rate in Congenital Adrenal Hyperplasia. A Discussion of the Theories on the Pathogenesis of the Salt-Losing Form of the Syndrome. J Clin Invest, 1965. 44: p. 1505-13.
  47. Kuhnle, U., M. Land, and S. Ulick, Evidence for the secretion of an antimineralocorticoid in congenital adrenal hyperplasia. J Clin Endocrinol Metab, 1986. 62(5): p. 934-40.
  48. Tusie-Luna, M.T., P. Traktman, and P.C. White, Determination of functional effects of mutations in the steroid 21-hydroxylase gene (CYP21) using recombinant vaccinia virus. J Biol Chem, 1990. 265(34): p. 20916-22.
  49. Stoner, E., et al., Is salt-wasting in congenital adrenal hyperplasia due to the same gene as the fasciculata defect? Clin Endocrinol (Oxf), 1986. 24(1): p. 9-20.
  50. Luetscher, J.A., Jr., Studies of aldosterone in relation to water and electrolyte balance in man. Recent Prog Horm Res, 1956. 12: p. 175-84; discussion, 184-98.
  51. Speiser, P.W., et al., Aldosterone synthesis in salt-wasting congenital adrenal hyperplasia with complete absence of adrenal 21-hydroxylase. N Engl J Med, 1991. 324(3): p. 145-9.
  52. Rose, L.I., et al., Adrenocortical hydroxylase deficiencies in acne vulgaris. J Invest Dermatol, 1976. 66(5): p. 324-6.
  53. Lucky, A.W., et al., Adrenal androgen hyperresponsiveness to adrenocorticotropin in women with acne and/or hirsutism: adrenal enzyme defects and exaggerated adrenarche. J Clin Endocrinol Metab, 1986. 62(5): p. 840-8.
  54. Lin-Su, K., S. Nimkarn, and M.I. New, Congenital adrenal hyperplasia in adolescents: diagnosis and management. Ann N Y Acad Sci, 2008. 1135: p. 95-8.
  55. Witchel, S.F. and R. Azziz, Nonclassic congenital adrenal hyperplasia. Int J Pediatr Endocrinol, 2010. 2010: p. 625105.
  56. Mokshagundam, S. and M.I. Surks, Congenital adrenal hyperplasia diagnosed in a man during workup for bilateral adrenal masses. Arch Intern Med, 1993. 153(11): p. 1389-91.
  57. Jaresch, S., et al., Adrenal incidentaloma and patients with homozygous or heterozygous congenital adrenal hyperplasia. J Clin Endocrinol Metab, 1992. 74(3): p. 685-9.
  58. Barzon, L., et al., Incidentally discovered adrenal tumors: endocrine and scintigraphic correlates. J Clin Endocrinol Metab, 1998. 83(1): p. 55-62.
  59. Nieman, L.K., Approach to the patient with an adrenal incidentaloma. J Clin Endocrinol Metab, 2010. 95(9): p. 4106-13.
  60. Nimkarn, S. and M.I. New, Steroid 11beta- hydroxylase deficiency congenital adrenal hyperplasia. Trends Endocrinol Metab, 2008. 19(3): p. 96-9.
  61. Khattab, A., et al., Clinical, genetic, and structural basis of congenital adrenal hyperplasia due to 11beta-hydroxylase deficiency. Proc Natl Acad Sci U S A, 2017. 114(10): p. E1933-E1940.
  62. Globerman, H., et al., An inherited defect in aldosterone biosynthesis caused by a mutation in or near the gene for steroid 11-hydroxylase. N Engl J Med, 1988. 319(18): p. 1193-7.
  63. Rosler, A., et al., Clinical variability of congenital adrenal hyperplasia due to 11 beta-hydroxylase deficiency. Horm Res, 1982. 16(3): p. 133-41.
  64. Hague, W.M. and J.W. Honour, Malignant hypertension in congenital adrenal hyperplasia due to 11 beta-hydroxylase deficiency. Clin Endocrinol (Oxf), 1983. 18(5): p. 505-10.
  65. Chabre, O., et al., Bilateral laparoscopic adrenalectomy for congenital adrenal hyperplasia with severe hypertension, resulting from two novel mutations in splice donor sites of CYP11B1. J Clin Endocrinol Metab, 2000. 85(11): p. 4060-8.
  66. Joehrer, K., et al., CYP11B1 mutations causing non-classic adrenal hyperplasia due to 11 beta-hydroxylase deficiency. Hum Mol Genet, 1997. 6(11): p. 1829-34.
  67. Peters, C.J., et al., Cosegregation of a novel homozygous CYP11B1 mutation with the phenotype of non-classical congenital adrenal hyperplasia in a consanguineous family. Horm Res, 2007. 67(4): p. 189-93.
  68. Simard, J., et al., Molecular basis of human 3 beta-hydroxysteroid dehydrogenase deficiency. J Steroid Biochem Mol Biol, 1995. 53(1-6): p. 127-38.
  69. Labrie, F., et al., Structure and tissue-specific expression of 3 beta-hydroxysteroid dehydrogenase/5-ene-4-ene isomerase genes in human and rat classical and peripheral steroidogenic tissues. J Steroid Biochem Mol Biol, 1992. 41(3-8): p. 421-35.
  70. Pang, S., Congenital adrenal hyperplasia owing to 3 beta-hydroxysteroid dehydrogenase deficiency. Endocrinol Metab Clin North Am, 2001. 30(1): p. 81-99, vi-vii.
  71. Yanase, T., E.R. Simpson, and M.R. Waterman, 17 alpha-hydroxylase/17,20-lyase deficiency: from clinical investigation to molecular definition. Endocr Rev, 1991. 12(1): p. 91-108.
  72. Miller, W.L., R.J. Auchus, and D.H. Geller, The regulation of 17,20 lyase activity. Steroids, 1997. 62(1): p. 133-42.
  73. Bose, H.S., et al., Mutations in the steroidogenic acute regulatory protein (StAR) in six patients with congenital lipoid adrenal hyperplasia. J Clin Endocrinol Metab, 2000. 85(10): p. 3636-9.
  74. Bose, H.S., et al., The pathophysiology and genetics of congenital lipoid adrenal hyperplasia. N Engl J Med, 1996. 335(25): p. 1870-8.
  75. Miller, W.L., Mechanism of StAR's regulation of mitochondrial cholesterol import. Mol Cell Endocrinol, 2007. 265-266: p. 46-50.
  76. Stocco, D.M. and B.J. Clark, The role of the steroidogenic acute regulatory protein in steroidogenesis. Steroids, 1997. 62(1): p. 29-36.
  77. Sahakitrungruang, T., et al., Clinical, genetic, and functional characterization of four patients carrying partial loss-of-function mutations in the steroidogenic acute regulatory protein (StAR). J Clin Endocrinol Metab, 2010. 95(7): p. 3352-9.
  78. Tee, M.K., et al., Varied clinical presentations of seven patients with mutations in CYP11A1 encoding the cholesterol side-chain cleavage enzyme, P450scc. J Clin Endocrinol Metab, 2013. 98(2): p. 713-20.
  79. Parajes, S., et al., A novel entity of clinically isolated adrenal insufficiency caused by a partially inactivating mutation of the gene encoding for P450 side chain cleavage enzyme (CYP11A1). J Clin Endocrinol Metab, 2011. 96(11): p. E1798-806.
  80. Scott, R.R. and W.L. Miller, Genetic and clinical features of p450 oxidoreductase deficiency. Horm Res, 2008. 69(5): p. 266-75.
  81. Fluck, C.E., et al., P450 oxidoreductase deficiency - a new form of congenital adrenal hyperplasia. Endocr Dev, 2008. 13: p. 67-81.
  82. Fluck, C.E., et al., Mutant P450 oxidoreductase causes disordered steroidogenesis with and without Antley-Bixler syndrome. Nat Genet, 2004. 36(3): p. 228-30.
  83. Wilson, R.C., et al., Steroid 21-hydroxylase deficiency: genotype may not predict phenotype. J Clin Endocrinol Metab, 1995. 80(8): p. 2322-9.
  84. Nimkarn, S., et al., Congenital adrenal hyperplasia (21-hydroxylase deficiency) without demonstrable genetic mutations. J Clin Endocrinol Metab, 1999. 84(1): p. 378-81.
  85. Tajima, T., et al., Heterozygous mutation in the cholesterol side chain cleavage enzyme (p450scc) gene in a patient with 46,XY sex reversal and adrenal insufficiency. J Clin Endocrinol Metab, 2001. 86(8): p. 3820-5.
  86. Nebert, D.W., et al., The P450 superfamily: update on new sequences, gene mapping, and recommended nomenclature. DNA Cell Biol, 1991. 10(1): p. 1-14.
  87. Dupont, B., et al., Close genetic linkage between HLA and congenital adrenal hyperplasia (21-hydroxylase deficiency). Lancet, 1977. 2(8052-8053): p. 1309-12.
  88. White, P.C., et al., Two genes encoding steroid 21-hydroxylase are located near the genes encoding the fourth component of complement in man. Proc Natl Acad Sci U S A, 1985. 82(4): p. 1089-93.
  89. Carroll, M.C., R.D. Campbell, and R.R. Porter, Mapping of steroid 21-hydroxylase genes adjacent to complement component C4 genes in HLA, the major histocompatibility complex in man. Proc Natl Acad Sci U S A, 1985. 82(2): p. 521-5.
  90. Belt, K.T., M.C. Carroll, and R.R. Porter, The structural basis of the multiple forms of human complement component C4. Cell, 1984. 36(4): p. 907-14.
  91. White, P.C., M.I. New, and B. Dupont, Structure of human steroid 21-hydroxylase genes. Proc Natl Acad Sci U S A, 1986. 83(14): p. 5111-5.
  92. Higashi, Y., et al., Complete nucleotide sequence of two steroid 21-hydroxylase genes tandemly arranged in human chromosome: a pseudogene and a genuine gene. Proc Natl Acad Sci U S A, 1986. 83(9): p. 2841-5.
  93. New, M.I., et al., Genotype-phenotype correlation in 1,507 families with congenital adrenal hyperplasia owing to 21-hydroxylase deficiency. Proc Natl Acad Sci U S A, 2013. 110(7): p. 2611-6.
  94. Finkielstain, G.P., et al., Comprehensive genetic analysis of 182 unrelated families with congenital adrenal hyperplasia due to 21-hydroxylase deficiency. J Clin Endocrinol Metab, 2011. 96(1): p. E161-72.
  95. Krone, N., et al., Predicting phenotype in steroid 21-hydroxylase deficiency? Comprehensive genotyping in 155 unrelated, well defined patients from southern Germany. J Clin Endocrinol Metab, 2000. 85(3): p. 1059-65.
  96. Rocha, R.O., et al., The degree of external genitalia virilization in girls with 21-hydroxylase deficiency appears to be influenced by the CAG repeats in the androgen receptor gene. Clin Endocrinol (Oxf), 2008. 68(2): p. 226-32.
  97. Forest, M.G., Recent advances in the diagnosis and management of congenital adrenal hyperplasia due to 21-hydroxylase deficiency. Hum Reprod Update, 2004. 10(6): p. 469-85.
  98. Pang, S., et al., Serum androgen concentrations in neonates and young infants with congenital adrenal hyperplasia due to 21-hydroxylase deficiency. Clin Endocrinol (Oxf), 1979. 11(6): p. 575-84.
  99. Korth-Schutz, S., et al., Serum androgens as a continuing index of adequacy of treatment of congenital adrenal hyperplasia. J Clin Endocrinol Metab, 1978. 46(3): p. 452-8.
  100. Caulfield, M.P., et al., The diagnosis of congenital adrenal hyperplasia in the newborn by gas chromatography/mass spectrometry analysis of random urine specimens. J Clin Endocrinol Metab, 2002. 87(8): p. 3682-90.
  101. Shackleton, C.H., Profiling steroid hormones and urinary steroids. J Chromatogr, 1986. 379: p. 91-156.
  102. Pang, S., et al., Microfilter paper method for 17 alpha-hydroxyprogesterone radioimmunoassay: its application for rapid screening for congenital adrenal hyperplasia. J Clin Endocrinol Metab, 1977. 45(5): p. 1003-8.
  103. Therrell, B.L., et al., Current status of newborn screening worldwide: 2015. Semin Perinatol, 2015. 39(3): p. 171-87.
  104. Speiser, P.W., et al., Congenital adrenal hyperplasia due to steroid 21-hydroxylase deficiency: an Endocrine Society clinical practice guideline. J Clin Endocrinol Metab, 2010. 95(9): p. 4133-60.
  105. Gruneiro-Papendieck, L., et al., Neonatal screening program for congenital adrenal hyperplasia: adjustments to the recall protocol. Horm Res, 2001. 55(6): p. 271-7.
  106. Janzen, N., et al., Newborn screening for congenital adrenal hyperplasia: additional steroid profile using liquid chromatography-tandem mass spectrometry. J Clin Endocrinol Metab, 2007. 92(7): p. 2581-9.
  107. New, M.I., et al., Genotyping steroid 21-hydroxylase deficiency: hormonal reference data. J Clin Endocrinol Metab, 1983. 57(2): p. 320-6.
  108. Jeffcoate, T.N., et al., Diagnosis of the adrenogenital syndrome before birth. Lancet, 1965. 2(7412): p. 553-5.
  109. Wilson, R.C., et al., Rapid deoxyribonucleic acid analysis by allele-specific polymerase chain reaction for detection of mutations in the steroid 21-hydroxylase gene. J Clin Endocrinol Metab, 1995. 80(5): p. 1635-40.
  110. Tukel, T., et al., A novel semiquantitative polymerase chain reaction/enzyme digestion-based method for detection of large scale deletions/conversions of the CYP21 gene and mutation screening in Turkish families with 21-hydroxylase deficiency. J Clin Endocrinol Metab, 2003. 88(12): p. 5893-7.
  111. Mao, R., et al., Prenatal diagnosis of 21-hydroxylase deficiency caused by gene conversion and rearrangements: pitfalls and molecular diagnostic solutions. Prenat Diagn, 2002. 22(13): p. 1171-6.
  112. Day, D.J., et al., Identification of non-amplifying CYP21 genes when using PCR-based diagnosis of 21-hydroxylase deficiency in congenital adrenal hyperplasia (CAH) affected pedigrees. Hum Mol Genet, 1996. 5(12): p. 2039-48.
  113. Lo, Y.M., et al., Presence of fetal DNA in maternal plasma and serum. Lancet, 1997. 350(9076): p. 485-7.
  114. Bischoff, F.Z., et al., Noninvasive determination of fetal RhD status using fetal DNA in maternal serum and PCR. J Soc Gynecol Investig, 1999. 6(2): p. 64-9.
  115. Chitty, L.S. and Y.M. Lo, Noninvasive Prenatal Screening for Genetic Diseases Using Massively Parallel Sequencing of Maternal Plasma DNA. Cold Spring Harb Perspect Med, 2015. 5(9): p. a023085.
  116. Johnson, K.L., et al., Interlaboratory comparison of fetal male DNA detection from common maternal plasma samples by real-time PCR. Clin Chem, 2004. 50(3): p. 516-21.
  117. Bischoff, F.Z., D.E. Lewis, and J.L. Simpson, Cell-free fetal DNA in maternal blood: kinetics, source and structure. Hum Reprod Update, 2005. 11(1): p. 59-67.
  118. Tardy-Guidollet, V., et al., New management strategy of pregnancies at risk of congenital adrenal hyperplasia using fetal sex determination in maternal serum: French cohort of 258 cases (2002-2011). J Clin Endocrinol Metab, 2014. 99(4): p. 1180-8.
  119. New, M.I., et al., Noninvasive prenatal diagnosis of congenital adrenal hyperplasia using cell-free fetal DNA in maternal plasma. J Clin Endocrinol Metab, 2014. 99(6): p. E1022-30.
  120. Simpson, J.L., Preimplantation genetic diagnosis at 20 years. Prenat Diagn, 2010. 30(7): p. 682-95.
  121. Fiorentino, F., et al., Strategies and clinical outcome of 250 cycles of Preimplantation Genetic Diagnosis for single gene disorders. Hum Reprod, 2006. 21(3): p. 670-84.
  122. David, M. and M.G. Forest, Prenatal treatment of congenital adrenal hyperplasia resulting from 21-hydroxylase deficiency. J Pediatr, 1984. 105(5): p. 799-803.
  123. New, M.I., et al., Prenatal diagnosis for congenital adrenal hyperplasia in 532 pregnancies. J Clin Endocrinol Metab, 2001. 86(12): p. 5651-7.
  124. Forest, M.G., M. David, and Y. Morel, Prenatal diagnosis and treatment of 21-hydroxylase deficiency. J Steroid Biochem Mol Biol, 1993. 45(1-3): p. 75-82.
  125. Mercado, A.B., et al., Prenatal treatment and diagnosis of congenital adrenal hyperplasia owing to steroid 21-hydroxylase deficiency. J Clin Endocrinol Metab, 1995. 80(7): p. 2014-20.
  126. Carlson, A.D., et al., Congenital adrenal hyperplasia: update on prenatal diagnosis and treatment. J Steroid Biochem Mol Biol, 1999. 69(1-6): p. 19-29.
  127. New, M.I., et al., An update on prenatal diagnosis and treatment of congenital adrenal hyperplasia. Semin Reprod Med, 2012. 30(5): p. 396-9.
  128. Motaghedi, R., et al., Update on the prenatal diagnosis and treatment of congenital adrenal hyperplasia due to 11beta-hydroxylase deficiency. J Pediatr Endocrinol Metab, 2005. 18(2): p. 133-42.
  129. Saenger, P., Abnormal sex differentiation. J Pediatr, 1984. 104(1): p. 1-17.
  130. Meyer-Bahlburg, H.F., et al., Gender development in women with congenital adrenal hyperplasia as a function of disorder severity. Arch Sex Behav, 2006. 35(6): p. 667-84.
  131. Seckl, J.R. and W.L. Miller, How safe is long-term prenatal glucocorticoid treatment? JAMA, 1997. 277(13): p. 1077-9.
  132. Seckl, J.R., Prenatal glucocorticoids and long-term programming. Eur J Endocrinol, 2004. 151 Suppl 3: p. U49-62.
  133. Yeh, T.F., et al., Outcomes at school age after postnatal dexamethasone therapy for lung disease of prematurity. N Engl J Med, 2004. 350(13): p. 1304-13.
  134. Slotkin, T.A., et al., Glucocorticoid administration alters nuclear transcription factors in fetal rat brain: implications for the use of antenatal steroids. Brain Res Dev Brain Res, 1998. 111(1): p. 11-24.
  135. Uno, H., et al., Brain damage induced by prenatal exposure to dexamethasone in fetal rhesus macaques. I. Hippocampus. Brain Res Dev Brain Res, 1990. 53(2): p. 157-67.
  136. Hirvikoski, T., et al., Cognitive functions in children at risk for congenital adrenal hyperplasia treated prenatally with dexamethasone. J Clin Endocrinol Metab, 2007. 92(2): p. 542-8.
  137. Hirvikoski, T., et al., Long-term follow-up of prenatally treated children at risk for congenital adrenal hyperplasia: does dexamethasone cause behavioural problems? Eur J Endocrinol, 2008. 159(3): p. 309-16.
  138. Meyer-Bahlburg, H.F., et al., Cognitive outcome of offspring from dexamethasone-treated pregnancies at risk for congenital adrenal hyperplasia due to 21-hydroxylase deficiency. Eur J Endocrinol, 2012. 167(1): p. 103-10.
  139. Dorr, H.G., et al., Experts' Opinion on the Prenatal Therapy of Congenital Adrenal Hyperplasia (CAH) Due to 21-Hydroxylase Deficiency - Guideline of DGKED in cooperation with DGGG (S1-Level, AWMF Registry No. 174/013, July 2015). Geburtshilfe Frauenheilkd, 2015. 75(12): p. 1232-1238.
  140. Trautman, P.D., et al., Mothers' reactions to prenatal diagnostic procedures and dexamethasone treatment of congenital adrenal hyperplasia. J Psychosom Obstet Gynaecol, 1996. 17(3): p. 175-81.
  141. Lajic, S., et al., Prenatal treatment of congenital adrenal hyperplasia. Eur J Endocrinol, 2004. 151 Suppl 3: p. U63-9.
  142. Lajic, S., et al., Long-term somatic follow-up of prenatally treated children with congenital adrenal hyperplasia. J Clin Endocrinol Metab, 1998. 83(11): p. 3872-80.
  143. Goldman, A.S., B.H. Sharpior, and M. Katsumata, Human foetal palatal corticoid receptors and teratogens for cleft palate. Nature, 1978. 272(5652): p. 464-6.
  144. Nandi, J., et al., In vitro steroidogenesis by the adrenal glands of mice. Endocrinology, 1967. 80(4): p. 576-82.
  145. Rosler, A., et al., Prenatal diagnosis of 11beta-hydroxylase deficiency congenital adrenal hyperplasia. J Clin Endocrinol Metab, 1979. 49(4): p. 546-51.
  146. Schumert, Z., et al., 11-deoxycortisol in amniotic fluid: prenatal diagnosis of congenital adrenal hyperplasia due to 11 beta-hydroxylase deficiency. Clin Endocrinol (Oxf), 1980. 12(3): p. 257-60.
  147. Sippell, W.G., et al., Concentrations of aldosterone, corticosterone, 11-deoxycorticosterone, progesterone, 17-hydroxyprogesterone, 11-deoxycortisol, cortisol, and cortisone determined simultaneously in human amniotic fluid throughout gestation. J Clin Endocrinol Metab, 1981. 52(3): p. 385-92.
  148. Cerame, B.I., et al., Prenatal diagnosis and treatment of 11beta-hydroxylase deficiency congenital adrenal hyperplasia resulting in normal female genitalia. J Clin Endocrinol Metab, 1999. 84(9): p. 3129-34.
  149. Geley, S., et al., CYP11B1 mutations causing congenital adrenal hyperplasia due to 11 beta-hydroxylase deficiency. J Clin Endocrinol Metab, 1996. 81(8): p. 2896-901.
  150. Prete, A., R.J. Auchus, and R.J. Ross, Clinical advances in the pharmacotherapy of congenital adrenal hyperplasia. Eur J Endocrinol, 2021. 186(1): p. R1-R14.
  151. Jones, C.M., et al., Modified-Release and Conventional Glucocorticoids and Diurnal Androgen Excretion in Congenital Adrenal Hyperplasia. J Clin Endocrinol Metab, 2017. 102(6): p. 1797-1806.
  152. Nimkarn, S., et al., Aldosterone-to-renin ratio as a marker for disease severity in 21-hydroxylase deficiency congenital adrenal hyperplasia. J Clin Endocrinol Metab, 2007. 92(1): p. 137-42.
  153. Rosler, A., et al., The interrelationship of sodium balance, plasma renin activity and ACTH in congenital adrenal hyperplasia. J Clin Endocrinol Metab, 1977. 45(3): p. 500-12.
  154. New, M.I. and M.P. Seaman, Secretion rates of cortisol and aldosterone precursors in various forms of congenital adrenal hyperplasia. J Clin Endocrinol Metab, 1970. 30(3): p. 361-71.
  155. Canalis, E., Clinical review 83: Mechanisms of glucocorticoid action in bone: implications to glucocorticoid-induced osteoporosis. J Clin Endocrinol Metab, 1996. 81(10): p. 3441-7.
  156. Canalis, E., et al., Perspectives on glucocorticoid-induced osteoporosis. Bone, 2004. 34(4): p. 593-8.
  157. Guo, C.Y., A.P. Weetman, and R. Eastell, Bone turnover and bone mineral density in patients with congenital adrenal hyperplasia. Clin Endocrinol (Oxf), 1996. 45(5): p. 535-41.
  158. de Almeida Freire, P.O., et al., Classical congenital adrenal hyperplasia due to 21-hydroxylase deficiency: a cross-sectional study of factors involved in bone mineral density. J Bone Miner Metab, 2003. 21(6): p. 396-401.
  159. King, J.A., et al., Long-term corticosteroid replacement and bone mineral density in adult women with classical congenital adrenal hyperplasia. J Clin Endocrinol Metab, 2006. 91(3): p. 865-9.
  160. Riehl, G., et al., Bone mineral density and fractures in congenital adrenal hyperplasia: Findings from the dsd-LIFE study. Clin Endocrinol (Oxf), 2020. 92(4): p. 284-294.
  161. Lin-Su, K. and M.I. New, Effects of adrenal steroids on the bone metabolism of children with congenital adrenal hyperplasia. Ann N Y Acad Sci, 2007. 1117: p. 345-51.
  162. Crouch, N.S., et al., Sexual function and genital sensitivity following feminizing genitoplasty for congenital adrenal hyperplasia. J Urol, 2008. 179(2): p. 634-8.
  163. Nordenstrom, A., et al., Sexual function and surgical outcome in women with congenital adrenal hyperplasia due to CYP21A2 deficiency: clinical perspective and the patients' perception. J Clin Endocrinol Metab, 2010. 95(8): p. 3633-40.
  164. Claahsen-van der Grinten, H.L., et al., Congenital Adrenal Hyperplasia-Current Insights in Pathophysiology, Diagnostics, and Management. Endocr Rev, 2022. 43(1): p. 91-159.
  165. Bennecke, E., et al., Early Genital Surgery in Disorders/Differences of Sex Development: Patients' Perspectives. Arch Sex Behav, 2021. 50(3): p. 913-923.
  166. Mallappa, A., et al., Long-term use of continuous subcutaneous hydrocortisone infusion therapy in patients with congenital adrenal hyperplasia. Clin Endocrinol (Oxf), 2018. 89(4): p. 399-407.
  167. Mallappa, A., et al., A phase 2 study of Chronocort, a modified-release formulation of hydrocortisone, in the treatment of adults with classic congenital adrenal hyperplasia. J Clin Endocrinol Metab, 2015. 100(3): p. 1137-45.
  168. Whitaker, M.J., H. Huatan, and R.J. Ross, Chronotherapy based on modified-release hydrocortisone to restore the physiological cortisol diurnal rhythm. Drug Deliv Transl Res, 2022.
  169. Sarafoglou, K., et al., Tildacerfont in Adults With Classic Congenital Adrenal Hyperplasia: Results from Two Phase 2 Studies. J Clin Endocrinol Metab, 2021. 106(11): p. e4666-e4679.
  170. Auchus, R.J., et al., Crinecerfont Lowers Elevated Hormone Markers in Adults With 21-Hydroxylase Deficiency Congenital Adrenal Hyperplasia. J Clin Endocrinol Metab, 2022. 107(3): p. 801-812.
  171. Wright, C., et al., Abiraterone acetate treatment lowers 11-oxygenated androgens. Eur J Endocrinol, 2020. 182(4): p. 413-421.
  172. Auchus, R.J., et al., Abiraterone acetate to lower androgens in women with classic 21-hydroxylase deficiency. J Clin Endocrinol Metab, 2014. 99(8): p. 2763-70.


Physiology of the Pineal Gland and Melatonin

ABSTRACT


The pineal gland was described as the “Seat of the Soul” by Renee Descartes and it is located in the center of the brain. The main function of the pineal gland is to receive information about the state of the light-dark cycle from the environment and convey this information by the production and secretion of the hormone melatonin. Changing photoperiod is indicated by the duration of melatonin secretion and is used by photoperiodic species to time their seasonal physiology. The rhythmic production of melatonin, normally secreted only during the dark period of the day, is extensively used as a marker of the phase of the internal circadian clock. Melatonin itself is used as a therapy for certain sleep disorders related to circadian rhythm abnormalities such as delayed sleep phase syndrome, non-24h sleep wake disorder and jet lag. It might have more extensive therapeutic applications in the future, since multiple physiological roles have been attributed to melatonin. It exerts physiologic immediate effects during night or darkness and when suitably administered has prospective effects during daytime when melatonin levels are undetectable. In addition to its role in regulating seasonal physiology and influencing the circadian system and sleep patterns, melatonin is involved in cell protection, neuroprotection, and the reproductive system, among other possible functions. Pineal gland function and melatonin secretion can be impaired due to accidental and developmental conditions, such as pineal tumors, craniopharyngiomas, injuries affecting the sympathetic innervation of the pineal gland, and rare congenital disorders that alter melatonin secretion. This chapter summarizes the physiology and pathophysiology of the pineal gland and melatonin.


PINEAL PHYSIOLOGY


Pineal Anatomy and Structure


The pineal gland in humans is a small (100-150 mg), highly vascularized, and a secretory neuroendocrine organ (1). It is located in the mid-line of the brain, outside the blood-brain barrier and attached to the roof of the third ventricle by a short stalk. In humans, the pineal gland usually shows a degree of calcification with age providing a good imaging marker (for a speculative discussion of pineal calcification see reference(2)). The principal innervation is sympathetic, arising from the superior cervical ganglia (3). Arterial vascularization of the pineal gland is supplied by both the anterior and posterior circulation, being the main artery supplying the lateral pineal artery, which originates from the posterior circulation (4). In mammals, the main cell types are pinealocytes (95%) followed by scattered glial cells (astrocytic and phagocytic subtypes) (5). Pinealocytes are responsible for the synthesis and secretion of melatonin.


Main Function of the Pineal Gland


The main function of the pineal gland is to receive and convey information about the current light-dark cycle from the environment via the production and secretion of melatonin cyclically at night (dark period) (6, 7). Although in cold-blooded vertebrates (lower-vertebrate species), the pineal gland is photosensitive, this property is lost in higher vertebrates. In higher vertebrates, light is sensed by the inner retina (retinal ganglion cells) that send neural signals to the visual areas of the brain. However, a few retinal ganglion cells contain melanopsin and have an intrinsic photoreceptor capability that sends neural signals to non-image forming areas of the brain, including the pineal gland, through complex neuronal connections. The photic information from the retina is sent to the suprachiasmatic nucleus (SCN), the major rhythm-generating system or “clock” in mammals, and from there to other hypothalamic areas. When the light signal is positive, the SCN secretes gamma-amino butyric acid, responsible for the inhibition of the neurons that synapse in the paraventricular nucleus (PVN) of the hypothalamus, consequently the signal to the pineal gland is interrupted and melatonin is not synthesized. On the contrary, when there is no light (darkness), the SCN secretes glutamate, responsible for the PVN transmission of the signal along the pathway to the pineal gland. However, it is important to note that in continuous darkness the SCN continues to generate rhythmic output without light suppression since it functions as an endogenous oscillator (master pacemaker or clock). The rhythm deviates from 24h and ‘free-runs’ in the absence of the important light time cue. Light-dark cycles serve to synchronize the rhythm to 24h.


The PVN nucleus communicates with higher thoracic segments of the spinal column, conveying information to the superior cervical ganglion that transmits the final signal to the pineal gland through sympathetic postsynaptic fibers by releasing norepinephrine (NE).  NE is the trigger for the pinealocytes to produce melatonin by activating the transcription of the mRNA encoding the enzyme arylalkylamine N-acetyltransferase (AA-NAT), the first molecular step for melatonin synthesis (8) (Figure 1).


Figure 1. Melatonin synthesis in the pineal gland


MELATONIN SYNTHESIS AND METABOLISM


Melatonin Synthesis


Melatonin (N-acetyl-5-methoxytryptamine) is synthesized within the pinealocytes from tryptophan, mostly occurring during the dark phase of the day, when there is a major increase in the activity of serotonin-N-acetyltransferase (arylalkylamine N-acetyltransferase, AA-NAT), responsible for the transformation of 5-hydroxytryptamine (5HT, serotonin) to N-acetylserotonin (NAS) (Figure 1). Finally, N-acetylserotonin is converted to melatonin by acetylserotonin O-methyltransferase. The rapid decline in the synthesis with light treatment at night appears to depend on proteasomal proteolysis (9). Both AA-NAT and serotonin availability play a role limiting melatonin production. AA-NAT mRNA is expressed mainly in the pineal gland, retina, and to a lesser extent in some other brain areas, pituitary, and testis. Melatonin synthesis is also described in many other sites. AA-NAT activation is triggered by the activation of β1 and α1b adrenergic receptors by NE (9). NE is the major transmitter via β-1 adrenoceptors with potentiation by α-1 stimulation. NE levels are higher at night, approximately 180 degrees out of phase with the serotonin rhythm. Both availability of NE and serotonin are stimulatory for melatonin synthesis. Pathological, surgical or traumatic sympathetic denervation of the pineal gland or administration of β-adrenergic antagonists abolishes the rhythmic synthesis of melatonin and the light-dark control of its production.


There is evidence that melatonin can be synthesized in other sites of the body (skin, gastrointestinal tract, retina, bone marrow, placenta and others) acting in an autocrine or paracrine manner (10). Very recently it has been demonstrated that in the mouse brain melatonin is exclusively synthesized in the mitochondrial matrix. It is released to the cytoplasm, thereby activating a mitochondrial MT1 signal-transduction pathway which inhibits stress-mediated cytochrome c release and caspase activation: these are preludes to cell death and inflammation. This is a new mechanism whereby locally synthesized melatonin may protect against neurodegeneration. It is referred to as automitocrine signaling (11). Except for the pineal gland, other structures contribute little to circulating concentrations in mammals, since after pinealectomy, melatonin levels are mostly undetectable (12). Importantly several other factors, summarized in Table 1, have been related to the secretion and production of melatonin (13, 14).


Table 1. Factors Influencing Human Melatonin Secretion and Production (11),(12)

Factor

Effect(s) on melatonin

Comment

Light

Suppression

>30 lux white 460-480 nm most effective

Light

Phase-shift/ Synchronization

Short wavelengths most effective

Sleep timing

Phase-shift

Partly secondary to light exposure

Posture

­ standing (night)


Exercise

­ phase shifts

Hard exercise

ß-adrenoceptor-A

¯ synthesis

Anti-hypertensives

5HT UI

­ fluvoxamine

Metabolic effect

NE UI

­ change in timing

Antidepressants

MAOA I

­ may change phase

Antidepressants

α-adrenoceptor-A

¯ alpha-1, ­ alpha-2


Benzodiazepines

Variable¯ diazepam, alprazolam

GABA mechanisms

Testosterone

¯

Treatment

OC

­


Estradiol

¯? Not clear


Menstrual cycle

Inconsistent

­ amenorrhea

Smoking

Possible changes ­¯ ?


Alcohol

¯

Dose dependent

Caffeine

­

Delays clearance (exogenous)

Aspirin, Ibuprofen

¯


Chlorpromazine

­

Metabolic effect

Benserazide

Possible phase change, Parkinson patients

Aromatic amino-acid decarboxylase-I

Abbreviations: A: antagonist, U: uptake, I: inhibitor, MAO: monoamine oxidase, OC: oral contraceptives, 5HT: 5-hydroxytryptamine.


Control of Melatonin Synthesis: A Darkness Hormone


The rhythm of melatonin production is internally generated and controlled by interacting networks of clock genes in the bilateral SCN (15). Damage to the SCN leads to a loss of the majority of circadian rhythms. The SCN rhythm is synchronized to 24 hours mainly by the light-dark cycle acting via the retina and the retinohypothalamic projection to the SCN; the longer the night the longer the duration of secretion is, and the ocular light serves to synchronize the rhythm to 24h and to suppress secretion at the end of the dark phase, as explained above. Light exposure is the most important factor related to pineal gland function and melatonin secretion. A single daily light pulse of suitable intensity and duration in otherwise constant darkness is enough to phase shift and to synchronize the melatonin rhythm to 24h (16). The amount of light required at night to suppress melatonin secretion varies across species. In humans, intensities of 2500 lux full spectrum light (domestic light is around 100 to 500 lux) or light preferably in the blue range (460 to 480 nm) are required to completely suppress melatonin at night, but lower intensities < 200 lux can suppress secretion and shift the rhythm (17-21). Previous photic history influences the response: living in dim light increases sensitivity. Furthermore, the degree of light perception between individuals is related to the incidence of circadian desynchrony; along these lines, blind people with no conscious or unconscious light perception show free-running or abnormally synchronized melatonin and other circadian rhythms (22-24). Some blind subjects retain an intact retinohypothalamic tract and therefore a normal melatonin response despite a lack of conscious light perception (25, 26). It seems clear that an intact innervated pineal gland is necessary for the response to photoperiod change (27). Melatonin functions as a paracrine signal within the retina, it enhances retinal function in low intensity light by inducing photomechanical changes and provides a closed-loop to the pineal-retina-SCN system. All together, they are the basic structures to perceive and transduce non-visual effects of light, and to generate the melatonin rhythm by a closed-loop negative feedback of genes (Clock, “Circadian locomotor output cycles kaput” and Bmal, “Brain and muscle ARNT-like” genes), positive stimulatory elements (Per, “period and Cry, “Cryptochrome” genes), and negative elements (CCG, clock-controlled genes) of clock gene expression in the SCN (Figure 2).

Figure 2. Diagrammatic representation of the control of production and the functions of melatonin, regarding seasonal and circadian timing mechanisms. Abbreviations: SCN: suprachiasmatic nucleus, PVN: paraventricular nucleus, SCG: superior cervical ganglion, NA: norepinephrine (noradrenalin), RHT: retino-hypothalamic-tract, CCG: clock-controlled genes. Based on an original diagram by Dr Elisabeth Maywood, MRC Laboratory of Molecular Biology, Neurobiology Division, Hills Road Cambridge, CB2 2QH, UK.

Melatonin Metabolism


Once synthesized, melatonin is released directly into the peripheral circulation (bound to albumin) and to the CSF without being stored. In humans, melatonin’s half-life in blood is around 40 minutes and it is metabolized within the liver, converted to 6-hydroxymelatonin mainly by CYP1A2 and conjugated to 6-sulfatoxymelatonin (aMT6s) for subsequent urinary excretion. The measurement of urinary aMT6s is a good marker of melatonin secretion, since it follows the same pattern with an approximate 2-hours offset (28, 29). Overall, women have slightly higher values of plasma melatonin at night than men (30). On average, the maximum levels of plasma melatonin in adults occur between 02.00 and 04.00 hours and are on average about 60 to 70 pg/mL when measured with high-specificity assays. Concentrations in saliva, like other hormones, are three times lower than in plasma. Minimum concentrations detected are below 1 pg/mL. The plasma melatonin rhythm (timing and amplitude) strongly correlates with urinary aMT6s. Although there is a large variability in amplitude of the rhythm between subjects, the normal human melatonin rhythm is reproducible from day to day intraindividually (Figure 3 and 4).


Figure 3. Average concentrations of melatonin in human plasma (black, N=133), saliva (blue, N=28) and 6-sulphatoxymelatonin (aMT6s) in urine (red, N=88) using radioimmunoassay measurements. Diagrammatic representation of mean normal values (healthy men and women over 18 years old) from Dr. J. Arendt. Stockgrand Ltd., University of Surrey, UK.

Figure 4. Plasma melatonin and urinary aMT6s in hourly samples to show the delay in the rhythm of urinary aMT6s compared to plasma melatonin (mean/SEM, N=14). Red lines show typical urine sample collection times over 24-48h to determine timing of the rhythm in out-patient or field studies. Redrawn from R. Naidoo, Thesis, University of Surrey, UK, 1998.

Melatonin Production During Development and Across Life


At birth, melatonin levels are almost undetectable, the only fetal source of melatonin being via the placental circulation. Melatonin levels in fetal umbilical circulation reflect the day-night difference as seen in the maternal circulation. Maternal melatonin sends a temporal circadian signal to the fetus (called “maternal photoperiodic adaptative programming”), preparing the CNS to properly deal with environmental day/night fluctuations after birth. A melatonin rhythm appears around 2 to 3 months of life (31), levels increasing exponentially until a lifetime peak on average in prepubertal children; melatonin concentrations in children are associated with Tanner stages of puberty (32). Thereafter, a steady decrease occurs reaching mean adult concentrations in late teens (33, 34). Values are stable until 35 to 40 years, followed by a decline in amplitude of melatonin rhythm and lower levels with ageing, associated with fragmented sleep-wake patterns (35). In people >90 years, melatonin levels are less than 20% of young adult concentrations (36). The decline in age-related melatonin production is attributed to different reasons; calcification of the pineal gland starting early in life and an impairment in the noradrenergic innervation to the gland or light detection capacity (ocular mydriases, cataracts) (2, 37). Interestingly, pinealectomy accelerates the aging process and several reports suggest that melatonin has anti-aging properties (38).


MELATONIN’S MECHANISMS OF ACTION


Melatonin Target Sites and Receptors


Melatonin’s target sites are both central and peripheral. Binding sites have been found in many areas of the brain, including the pars tuberalis and hypothalamus, but also in the cells of the immune system, gonads, kidney, and the cardiovascular system (39, 40). Melatonin binding sites in the brain might vary according to species. Melatonin exerts both non-receptor and receptor-mediated actions. Non-receptor-mediated actions are due to amphipathic properties (of both lipo- and hydrophilic structure) that allows melatonin to freely cross the cell and nuclear membranes. It can be easily detected in the nucleus of several cells in the brain and peripheral organs (41). Antioxidant properties are one example of non-receptor-mediated actions of melatonin. On the other hand, melatonin has receptor-mediated actions.


Two types of a new family of G protein coupled melatonin receptors (MT) have been cloned in mammals (42). Melatonin receptors are widely expressed, often with overlapping distributions. MT1 is primarily expressed in the pars tuberalis, the SCN together with other hypothalamic areas, pituitary, hippocampus, and adrenal glands, suggesting that circadian and reproductive effects are mediated through this receptor. MT2 is mainly expressed in the SCN, retina, pituitary and the other brain areas, and is associated with phase shifting (43). The affinity of melatonin is five-fold greater for MT1 than MT2. Melatonin administration induces (1) an acute suppression of neuronal firing in the SCN via the MT1 receptor, and (2) a phase-shifting of SCN activity through the MT2 receptor. However, agonists that exclusively act on one or another receptor have not been identified as yet, and the understanding of the role of each receptor in most of the tissues in which both receptors are present is difficult. Also, melatonin receptors are transiently expressed in neuroendocrine tissues during development, suggesting that melatonin has a role as a neuroendocrine synchronizer in developmental physiology (44).


Chronobiotic Effects of Melatonin

Figure 5. Phase shifting of circadian rhythms. From data in Middleton B. et al., J. Sleep Res, 2002, 11, Suppl 1, p 154, Melatonin phase shifts all measured rhythms abstr. No. 309. Rajaratnam SW, et al., J Clin Endocrinol Metab 2003;88:4303-9. Rajaratnam SW, et al., J Physiol 2004; 561:339-351.


Phase shifting of circadian rhythms by melatonin (Figure 5) was first described in the 1980s (45). Melatonin has chronobiotic effects and is able to synchronize and reset biological oscillations. Melatonin acts on oscillators according to a well-defined phase-response curve (PRC). PRC is characterized by phase-advance zone (early in the evening before the beginning of the nocturnal melatonin production), phase-delay zone (in the late night/early morning hours), and a non-responsive dead.  zone (when melatonin levels are high) (46). The melatonin PRC is useful for the clinical administration of melatonin as a chronobiotic agent and treatment of sleep circadian and mood  disorders (47). In addition to the circadian chronobiotic effects, melatonin importantly has chronobiotic seasonal effects and acts as a circannual synchronizer, one season determined by increasing duration of the nocturnal melatonin production (in the direction of the winter solstice) and the other season defined by the reduction of nocturnal melatonin production (in the direction of the summer solstice) (8, 48). Interestingly, most of the clock genes are expressed in the pars tuberalis with a 24h rhythmicity different from their expression in the SCN (49), and these clock genes are influenced by melatonin with numerous potential seasonal effects. However, whether melatonin modulates the activity of the SCN via regulation of clock genes is unclear. Also, a central clock, independent of the SCN, can be entrained by food availability, temperature variations, forced activity and rest, drugs (melatonin itself), and timing (50).


MELATONIN PHYSIOLOGY AND PATHOPHYSIOLOGY


As previously stated, melatonin can act through several mechanisms and at almost all levels of the organism. Therefore, it has multiple and diversified actions with immediate (endogenous melatonin, during the night) or prospective effects (exogenous melatonin, during the previous day).


Hypomelatoninemia is more common, and it can be due to factors that affect directly the pineal gland, innervation, melatonin synthesis as a result of congenital disease; or secondary as a consequence of environmental factors and/or medications (shift work, spinal cord cervical transection, sympathectomy, aging, neurodegenerative diseases, genetic diseases, β-blockers, calcium channel blockers, ACE inhibitors). Hypermelatoninemia is less common, and except for pharmacological effects, few conditions have been associated with high melatonin production: spontaneous hypothermia, hyperhidrosis syndrome, polycystic ovary syndrome, hypogonadotropic hypogonadism, anorexia nervosa, and Rabson-Mendenhall syndrome that induces pineal hyperplasia.


Melatonin During Puberty, Menstrual Cycle and Reproductive Function


Neuroendocrine control of sexual maturation is influenced by the pattern of melatonin secretion as a consequence of the light-dark cycle, and in some species the photoperiod via melatonin secretion determines the timing of puberty (51). In vitro studies, in cultured prepuberal rat pituitary gland, showed that melatonin inhibits gonadotrophin-releasing hormone and therefore luteinizing hormone release, providing evidence for a potential causal role of melatonin in the timing of developmental stages (52) (Figure 2). The mechanism by which melatonin inhibits GnRH secretion is not clear; recently, kisspeptin was suggested to mediate this effect. Lower melatonin levels have been associated with precocious puberty and higher levels in delayed puberty and hypothalamic amenorrhea compared to age-matched controls; however, a causal role of melatonin in pubertal development has not been described (53, 54). Data on circulating melatonin, and its variation during the menstrual cycle, are inconsistent (55). In males, high melatonin doses (100 mg daily) potentiate testosterone-induced LH suppression, and a negative correlation between nocturnal serum LH and melatonin have been reported (56, 57). Nevertheless, attempts to develop melatonin as a contraceptive pill in combination with progestin have not been successful (58). Interestingly, people living near the Arctic circle present lower conception rates during winter darkness, when melatonin levels are high, than in summer. In summary, the overall perception in human studies is that melatonin is inhibitory to human reproductive function.


Melatonin and Core Body Temperature


Melatonin plays a role in circadian thermoregulation. In particular, the melatonin peak is associated with the nadir in body temperature, together with maximum tiredness, lowest alertness and performance (59) (Figure 6). Exogenous administration of melatonin during the daytime reproduces this association, increasing fatigue and sleepiness and decreasing body temperature, especially if the subject is seated (posture dependent effect) (59). Along these lines, the rise in temperature during the ovulatory phase of the menstrual cycle is associated with a decline in the amplitude of melatonin.


Figure 6. Relationship of plasma melatonin to other major circadian rhythms driven by the internal clock. Abbreviations: VAS: visual analogue scale. Reproduced from Rajaratnam SMW and Arendt J. Lancet 358:999-1005, 2001 by permission.

Melatonin and Energy Metabolism and Glucose Homeostasis


Melatonin is an important player in the regulation of energy metabolism and glucose homeostasis. It is responsible for the daily distribution of energy metabolism functions (daily phase of high insulin sensitivity, glycogen synthesis, and lipogenesis and a sleep phase associated with the usage of stored energy) (60). Interestingly, administration of melatonin in post-menopausal women induced a reduction in fat mass and increase in lean mass compared to placebo (61). Nocturnal melatonin secretion facilitates diurnal insulin sensitivity and preservation of beta cell mass and function (62) and low melatonin secretion has independently been associated to a higher risk for type 2 diabetes (T2DM) (63). In short sleepers or when there is a misalignment between waking time and melatonin secretion (melatonin secretion is not interrupted), insulin resistance and hyperglycemia can be observed. Melatonin administration can result in iatrogenic insulin resistance and hyperglycemia in the morning, depending when it is administered and on the metabolizing characteristics of the subject. Moreover, recently, some variants of the gene encoding for the MT-1B have been associated with reduced beta-cell function and increased risk for T2DM (64). Several cardiovascular effects have also been attributed to melatonin, such as, antihypertensive properties, regulation of heart rate, and vascular resistance (65, 66).


Melatonin, Antioxidant Properties and Cancer


Antioxidant and anti-aging properties have also been attributed to melatonin. Melatonin acts as a potent free radical scavenger and antioxidant in vitro, independently of the presence of the receptor (38, 67, 68) protecting lipids, protein and DNA from oxidative damage. It is more effective than glutathione in reducing oxidative stress under many circumstances, being highly concentrated in the mitochondria. Although most of these effects in humans have been observed in supraphysiological doses of melatonin, the quantity of exogenous melatonin required to generate relevant antioxidant activity is not well established. Moreover, the clinical benefits of antioxidant supplements are not clear.  Quote “research has not shown antioxidant supplements to be beneficial in preventing diseases”, https://www.nccih.nih.gov/health/antioxidants-in-depth#:~:text=Antioxidants%20are%20man%2Dmade%20or,be%20beneficial%20in%20preventing%20diseases.


Also, there is growing recent evidence for anti-tumoral activity of melatonin (69, 70). Melatonin seems to be useful as an oncostatic agent at the cellular level and slows the progression of cancer (most of the studies are focused on breast and prostate cancer). Interestingly, in rats when a carcinogen is given at night during the highest levels of melatonin, DNA damage is significantly lower (20%) than in rats that receive a carcinogen exposure during the day (71). Pinealectomy stimulates cancer initiation or growth in animals, and pineal calcification, that leads to a decline in melatonin production, have been associated with an increase in pediatric primary brain tumors (72).


An ’Umbrella review’, whereby the results of numerous meta-analyses are combined, has provided important data on which of the numerous claims for melatonin therapeutic benefit stand up to scrutiny. A simplified version is provided here (see below).


As mentioned previously, exposure to light during the “biological night” can suppress melatonin production, and it is also associated to a deleterious effect on health (i.e., increased risk of cancer in most epidemiology studies in night shift workers) (70, 73). Night-shift workers present a higher incidence of hormone-dependent cancer which has been related to light-induced melatonin suppression which consequently increases estrogen production. A 50% increased risk to develop breast cancer in nurses exposed to rotating shift work has been documented (74). In contrast, a reduced risk for breast cancer was observed in blind women, with potentially higher levels of melatonin throughout all day (although there is no evidence that blind people produce more melatonin than sighted people) However, the mechanisms by which melatonin exerts any of oncostatic effects remains to be established.


Miscellaneous


The circadian annual rhythm of prolactin secretion depends on the circadian melatonin signal. Melatonin regulates pars tuberalis timer cells, and coordinates prolactin-secreting cells which together function as an intrapituitary pacemaker timer system. Interestingly, several clock genes are expressed within the pituitary with a circadian rhythm independent of the SCN (75).


Melatonin might act on the adrenal glands as an endogenous pacemaker. Glucocorticoids levels are low after the onset of darkness and rise after the middle of the night concomitantly with a decrease in melatonin levels. This is consistent with an inhibitory effect of melatonin through MT1 on glucocorticoid production. Interestingly, many antidepressant drugs increase the availability of the precursors (tryptophan and serotonin) and the major pineal neurotransmitter NE and therefore stimulate melatonin secretion. A melatonin agonist has been developed as an antidepressant through its actions on serotonin 2C receptors (76). If there is a link between this increase in melatonin production and the efficacy of antidepressant medications this needs further evaluation.


Several conditions (congenital or acquired) might induce a dysregulation of the melatonin synthesis/signaling and affect rhythmic melatonin production:


Pathological or traumatic sympathetic denervation (i.e., injury to the spinal cord) of the pineal gland or administration of β-adrenergic antagonists abolishes the rhythmic synthesis of melatonin and the light-dark control of its production (77, 78). NE is the major transmitter via β1 adrenoceptors with potentiation by α1 stimulation. NE levels are higher at night, approximately 180 degrees out of phase with the serotonin rhythm. Both availability of NE and serotonin are stimulatory for melatonin synthesis. However, several other factors have been related to the secretion and production of melatonin (13) (Table 1). In humans, administration of atenolol suppresses melatonin and enhances the magnitude of light-induced phase shift (79). In fact, several related observations suggest that endogenous melatonin acts to counter undesirable abrupt changes in phase. Pinealectomy i.e., abolishment of the melatonin rhythm, leads to a more rapid circadian adaptation to phase shift in rats (80).


Craniopharyngioma patients often display low melatonin secretion as a result of SCN impairment associated with alterations in sleep pattern (81).


Smith-Magenis syndrome (a congenital disorder due to a haplo-insufficiency of the retinoic acid-induced 1 gene, involved in the regulation of the expression of circadian genes) patients present with an inverted rhythmic melatonin secretion and sleep difficulties that can be managed with melatonin administration in the evening and β-adrenergic blockers during the day to reduce melatonin secretion (82). Low levels of melatonin have been consistently associated with autism spectrum disorders (ASD) (83). The last enzyme in the synthesis of melatonin, acetylserotonin-O-methyltransferase, has been associated with susceptibility for ASD which could be an explanation for low melatonin levels in ASD (84). Interestingly, administration of melatonin has shown to be efficacious for insomnia in children with ASD (85).


MELATONIN, CLINICAL APPLICATION AND THERAPEUTIC USE


Literature on the clinical use of melatonin is extensive and has increased exponentially over the last decade. Melatonin effects on sleep are the most well-known; however, the finding of increased cancer risk in shift workers and that patients with neurodegenerative diseases, autism or depression present abnormal melatonin rhythms, have recently increased attention on the role of melatonin.


Melatonin and Sleep


Numerous factors and comorbidities are associated with chronic insomnia in the adult population, different from the circadian sleep-wake rhythm disorders. Some of these risk factors and comorbidities involve psychiatric conditions (i.e. depression, anxiety, posttraumatic stress disorder), medical conditions (i.e. pulmonary diseases, chronic pain, heart failure, hyperthyroidism, nocturia, gastroesophageal reflux, cancer, pregnancy, pruritus, HIV infection, obstructive sleep apnea syndrome), neurological conditions (i.e. Alzheimer’s, Parkinson’s disease, peripheral neuropathies, strokes, brain tumors, headache syndromes), and medications (i.e. central nervous system stimulants or depressants, bronchodilators, antidepressants, diuretics, glucocorticoids, caffeine, alcohol). All these conditions should be ruled out before establishing the suspicion of a circadian sleep-wake rhythm disorder. The importance of melatonin levels for human sleep was apparently demonstrated by studies on pinealectomized subjects. These patients presented a disrupted 24h circadian rhythm, and a reduction of sleep time and quality, that were reversed after the administration of melatonin (86, 87). However, another careful, prospective study using polysomnography before and following pinealectomy found no effect on sleep and similar data are reported in rats (88-90). Thus, the question is not resolved. Clearly it is not a sleep hormone since in nocturnal animals it is secreted during the active periods. Overall, exogenous melatonin has been shown consistently to reduce sleep latency, and less consistently increase total sleep time, reduce night awakenings, and ultimately improve sleep quality (91). The most obvious action is to optimize sleep timing with respect to the circadian clock: we sleep better when melatonin production (and thus the circadian clock) and sleep are correctly aligned. Diagnostic criteria of every circadian sleep-wake rhythm disorder were fully described by the American Academy of Sleep Medicine (2014) (92).


CIRCADIAN SLEEP WAKE-RHYTHM DISORDERS EVALUATION


The origin of a circadian rhythm disorder can be related either to an intrinsic abnormality in the circadian system itself (misalignment of the intrinsic circadian timing with the desired sleep schedule) or to external factors, as when individuals must be awake at times that are not synchronized with their intrinsic rhythms. Overall, sleep disorders result in clinically significant symptoms of insomnia, daytime sleepiness and impaired physical, neurocognitive (concentration, processing speed, memory), emotional and social functioning, as well as impaired functioning at work or school (92). Age and associated comorbidities can help in the differential diagnoses. Symptoms across sleeping disorders are non-specific; the key to properly identify them is the recognition of abnormal sleep-wake patterns using sleep diaries beyond the complaint of insomnia or daytime sleepiness (93). Time domain is very important for melatonin actions (immediate or prospective effects, chronobiotic, or seasonal effects); therefore, adequate melatonin measurement and time of administration are crucial. Actigraphy can supplement self-reported sleep diary information or be useful in situations of neurodevelopmental disorders where a sleep diary cannot be completed.


Melatonin concentrations typically increase 90 to 120 minutes prior to the habitual bedtime if bright light (>10 lux) is absent. Preferentially frequent blood sampling every 30 to 60 minutes from six hours prior to and one hour following habitual bedtime is collected to assess the individual’s dim light melatonin onset (DLMO) and circadian phase. Samples should be collected in a dark environment (red light <10 lux) without interfering with sleep. In research studies a DLMO protocol is used as a valid and reliable indicator of circadian phase position, according to the time at which melatonin levels rise, and is extremely helpful to guide the timing for melatonin therapy in each individual; however, this is rarely feasible for routine use in clinical settings (94). Alternatively, urinary excretion of 6-sulfatoxymelatonin is a good index of nocturnal melatonin production and it should be collected as sequential urine samples for 48h in order to calculate the timing of the peak or acrophase. Also, it is possible to measure melatonin in saliva, during the evening before sleep and this approach has been frequently used. But, in the case of for example very delayed melatonin rise the time of onset can be missed during sleep. Importantly, melatonin values vary individually and according to age and sex. Although, endogenous melatonin production is closely related with the onset and offset of sleep, few associations have been found between melatonin production and sleep stages (95), and sleep deprivation does not abolish the melatonin rhythm.


CIRCADIAN SLEEP WAKE-RHYTHM DISORDERS


The primary goal of treatment of circadian sleep-wake rhythm disorders is to realign the circadian timing of sleep and wake with the required sleep-wake period. Appropriately timed and dosed melatonin, melatonin receptor agonists, and light therapy seem to be useful approaches (96, 97). Following the melatonin PRC and taking the individual DLMO as the reference phase to decide the most suitable time of melatonin administration, according to the desirable effect, seem the most appropriate guide to decide when to start chronic melatonin therapy (98-100).


Delayed and advanced sleep-wake phase disorders, non-24 hour, and irregular sleep-wake rhythm disorders are considered intrinsic circadian disorders; in contrast, jet lag and shift work disorders are due to an environmentally imposed misalignment. The most potent phase shifting factor (zeitgeber) is the environmental light-dark cycle (101).


Light exposure during the last hours of the usual sleep period moves the circadian rhythm forward (phase advanced). On the contrary, light exposure in the evening and the first half of the usual sleep period moves the circadian rhythm back (phase delayed) (Figure 7) (96). Advanced sleep-wake phase disorder is partially due to the physiologic advance that occurs with aging together with the weakening of circadian rhythms observed with aging. It can be genetically determined in some families as well. Delayed sleep-wake phase disorder is more often seen in children with some neurodevelopmental disorders; these patients cannot sleep during the dark time and delay sleep onset until the early hours of the morning, sleeping much of the day. In these situations both bright light in the early morning and evening melatonin 5 hours before endogenous melatonin onset secretion (0.5-5 mg) has been shown to advance sleep time significantly (102), the magnitude of the advanced shift being dose-dependent. In contrast early “biological morning” administration of melatonin induces delayed shifts. The non-24-hour sleep-wake rhythm disorder is most commonly seen in blindness, since the light-dark cycle is the most powerful cue for synchronizing the hypothalamic pacemaker to the 24-hour day (103). Therefore, this disorder is characterized by a failure to maintain stable alignment to the 24-h day, and a “free-running” circadian rhythm system which usually shifts to a later and later phase position. Timed melatonin treatment has been successful in entraining free-running blind patients.


The irregular sleep-wake rhythm disorder is seen in patients with dementia, which a neurodegenerative process might induce a disruption of the circadian system with a consequent loss of modulatory influence on sleep and wakefulness (104).


Figure 7. Representation of a simplified diagram of phase shifts of the circadian system, as evidenced by changes in melatonin rhythm itself, following oral treatment with fast release melatonin at different times. Biological night” is the time of endogenous melatonin secretion and defines “circadian time” which is independent of clock time.


Jet lag occurs when crossing time zones, and one needs to sleep and be awake at times that are not aligned with one’s own circadian system. It is more severe when more time zones are crossed and if the direction of the travel is eastbound, as it is more difficult to advance than delay the natural circadian cycle. Melatonin accelerates the phase shift if given at the appropriate time prior to bedtime at destination, and the benefits of melatonin administration in the alleviation of jet lag seems to be greater with larger numbers of time zones (105). If melatonin is appropriately time-administered, self-rated jet lag can be reduced by 50 percent (106). The maximum advance shift obtainable with a single treatment of oral melatonin (3-5 mg) is approximately 1-1.5 h.


For night shift workers wakefulness is required at the time that melatonin secretion is rising, and alertness is dissipating, and the opposite for the next day when melatonin secretion decreases, and circadian rhythms promote alertness. While some studies suggested that the use of melatonin improved sleep and increase daytime alertness in night shift workers compared to placebo (107), other studies have not shown beneficial effects (108). More data are needed before recommendations about melatonin as a therapy for shift workers can be made. However anecdotal evidence suggests that it is widely used for daytime sleep.


Figure 8. Diagram to illustrate free-running of the sleep wake cycle and other circadian rhythms in non-24h sleep-wake disorder, frequently seen in totally blind people. Melatonin, usually in doses of 0.5 – 5mg daily can synchronize sleep and the circadian system to the 24h day with benefits for sleep, and daytime alertness.


Melatonin and the CNS


Individuals with neurodegenerative disorders (i.e., Alzheimer’s and Parkinson’s disease, Huntington’s disease, autism) had significant flattened and attenuated melatonin rhythms compared to age-matched controls (37, 109). Melatonin showed efficacy in managing the insomnia in elderly people or improving cognitive function associated with neurodegenerative disorders (110). It has reported effects on anxiety, cognitive function and memory. Knowing the wide distribution of melatonin receptors in the CNS, melatonin seems one of the promising neuroprotective agents to be tested in humans. However other studies have found deleterious effects of melatonin in elderly demented patients (111).


Melatonin: Therapeutic Use


Almost 200 randomized clinical trials on the use of melatonin and evaluation of clinical effects have been published. Moreover, several patents have been registered in relation to the therapeutic applications of melatonin and melatonin analogues (sleep disorders, neuroprotection, cancer). The American Academy of Sleep Science recommends the use of melatonin for jet lag, delayed sleep phase syndrome, and non-24h sleep wake disorder syndrome seen in blind people; however, there were few consensuses acknowledging its therapeutic benefits (112) until an ‘Umbrella’ review of meta-analyses identified consistent therapeutic targets (91). Interestingly, at least in animal models, appropriate melatonin dose administration can reverse most of the effects after a pinealectomy.


Table 2. Melatonin’s Reported Significant Clinical Effects

• Breast cancer, risk of death down at 1 year

• Nocturnal hypertension, systolic and diastolic reduced

• Sleep latency shortened

• Sleep duration increased

• Melatonin onset advanced

• Core body temperature decreased

• In rodents, protective effects of melatonin in ischemic stroke

Combined meta-analyses of studies meeting strict criteria (simplified from Posadzki PP et al. BMC Med (2018) 16: 18.)


Several melatonin receptor agonists have been synthesized, some of them have higher affinity for the receptor than endogenous melatonin. Agomelatine (activity at the serotonin-2C receptor) functions as an anti-depressant, ramelteon (selective MT1/MT2 agonist) is marketed for use in sleep onset insomnia, tasimelteon (MT1/MT2 agonist), is commercialized for the treatment of circadian rhythm disorders particularly non-24h sleep wake disorder (113, 114). Also, slow-release formulations of the natural biologic melatonin have been developed.


The time of melatonin administration is critical, especially in chronic treatments, and the melatonin profile shows large interindividual variation; however, the profile of an individual is highly reproducible from day to day. Also, absorption, metabolism and excretion of melatonin vary between individuals and should be considered to get the desired clinical efficacy of the therapy. Ideally, although not feasible in a daily clinical practice, DLMO should be determined for each individual, and used as a timing reference for the prescription of melatonin. Alternatively, the time each individual goes to sleep could determine the time of administration of melatonin; it is advisable to take oral melatonin around 45 minutes to 1 hour before the usual bedtime (time to reach maximal plasma concentrations following oral immediate-release formulations). Moreover, the duration of the pharmacological profile should last until the usual wake time of the patient; thus, the type of pharmaceutical formulation (slow or fast release) is also an important consideration. However, there is little evidence for greater benefit of slow-release preparations. Route of administration, as well as age, liver function and potential drug interactions (since melatonin is metabolized in the liver), may influence plasma melatonin levels and should be taken into account (115). Sensitivities and pharmacokinetics of melatonin vary between individuals, and a lower dose of 0.3-0.5 mg might be more effective than higher doses in many subjects.


There is no general consensus regarding dosage. A wide range of dose formulations are available, and the usage varies depending on the clinical application. The usual advice is to start with the lowest dose available. Low doses 0.1 to 0.3 mg/d that produce near physiological melatonin concentrations can be used for central clock synchronization; doses ranging from 0.6 to 5 mg/d for sleep disorders, or doses as high as 300 mg/d for neurodegenerative disorders (amyotrophic lateral sclerosis) (116, 117). There is a current tendency to recommend high pharmacological doses for ‘protective’ or antioxidant effects. What consequences these might have for the circadian aspects of melatonin function is not known. It should not be forgotten that melatonin has profound effects on the reproductive function of photoperiodic seasonal breeders and there is good evidence for residual photoperiodicity in humans. However in most clinical trials or studies using melatonin, it is well accepted that in general melatonin lacks toxic adverse events, and it is a safe drug at most of the usual tested doses from 0.5 to 5 mg/d (118). Whether dosage should be changed in chronic melatonin treatment according to the annual season requires further investigation; further studies are needed on the undesirable consequences of melatonin suppression in the long term (for example by beta blocking drugs or shiftwork).


To summarize, benefits of melatonin and its analogues on circadian sleep disorders are consistently reported but for more generalized “insomnia” are often of low strength. The dose must be timed and individually adjusted as optimization will vary among individuals. More studies are required to develop treatment guidelines for different conditions. The long-term consequences of taking high dose melatonin especially in pediatrics need careful evaluation. Melatonin mechanisms of action and effects need much further work, to better understand the therapeutic value of melatonin and its potential applications.


REFERENCES


  1. L V. The Pineal Organ, Handbook of Mikroscopic Anatomy1981.
  2. Tan DX, Xu B, Zhou X, Reiter RJ. Pineal Calcification, Melatonin Production, Aging, Associated Health Consequences and Rejuvenation of the Pineal Gland. Molecules. 2018;23(2).
  3. Kappers JA. Innervation of the Vertebrate Pineal Organ. In: Axelrod J, Fraschini, F., Velo, G.P. (eds) editor1983.
  4. Kahilogullari G, Ugur HC, Comert A, Brohi RA, Ozgural O, Ozdemir M, et al. Arterial vascularization of the pineal gland. Childs Nerv Syst. 2013;29(10):1835-41.
  5. Moller M, Baeres FM. The anatomy and innervation of the mammalian pineal gland. Cell Tissue Res. 2002;309(1):139-50.
  6. Goldman BD. Mammalian photoperiodic system: formal properties and neuroendocrine mechanisms of photoperiodic time measurement. J Biol Rhythms. 2001;16(4):283-301.
  7. JA. A. Melatonin and the Mammalian Pineal Gland.1995.
  8. Cipolla-Neto J, Amaral FGD. Melatonin as a Hormone: New Physiological and Clinical Insights. Endocr Rev. 2018;39(6):990-1028.
  9. Gastel JA, Roseboom PH, Rinaldi PA, Weller JL, Klein DC. Melatonin production: proteasomal proteolysis in serotonin N-acetyltransferase regulation. Science (New York, NY). 1998;279(5355):1358-60.
  10. Bubenik GA. Localization, physiological significance and possible clinical implication of gastrointestinal melatonin. Biol Signals Recept. 2001;10(6):350-66.
  11. Suofu Y, Li W, Jean-Alphonse FG, Jia J, Khattar NK, Li J, et al. Dual role of mitochondria in producing melatonin and driving GPCR signaling to block cytochrome c release. Proc Natl Acad Sci U S A. 2017;114(38):E7997-E8006.
  12. Lewy AJ, Tetsuo M, Markey SP, Goodwin FK, Kopin IJ. Pinealectomy abolishes plasma melatonin in the rat. J Clin Endocrinol Metab. 1980;50(1):204-5.
  13. Simonneaux V, Ribelayga C. Generation of the melatonin endocrine message in mammals: a review of the complex regulation of melatonin synthesis by norepinephrine, peptides, and other pineal transmitters. Pharmacol Rev. 2003;55(2):325-95.
  14. Zawilska JB, Skene DJ, Arendt J. Physiology and pharmacology of melatonin in relation to biological rhythms. Pharmacol Rep. 2009;61(3):383-410.
  15. Takahashi JS, Hong HK, Ko CH, McDearmon EL. The genetics of mammalian circadian order and disorder: implications for physiology and disease. Nat Rev Genet. 2008;9(10):764-75.
  16. Illnerova H, Vanecek J. Entrainment of the rat pineal rhythm in melatonin production by light. Reprod Nutr Dev (1980). 1988;28(2B):515-26.
  17. Laakso ML, Hatonen T, Stenberg D, Alila A, Smith S. One-hour exposure to moderate illuminance (500 lux) shifts the human melatonin rhythm. J Pineal Res. 1993;15(1):21-6.
  18. Gooley JJ, Chamberlain K, Smith KA, Khalsa SB, Rajaratnam SM, Van Reen E, et al. Exposure to room light before bedtime suppresses melatonin onset and shortens melatonin duration in humans. J Clin Endocrinol Metab. 2011;96(3):E463-72.
  19. Reiter RJ. Action spectra, dose-response relationships, and temporal aspects of light's effects on the pineal gland. Ann N Y Acad Sci. 1985;453:215-30.
  20. Bojkowski CJ, Aldhous ME, English J, Franey C, Poulton AL, Skene DJ, et al. Suppression of nocturnal plasma melatonin and 6-sulphatoxymelatonin by bright and dim light in man. Horm Metab Res. 1987;19(9):437-40.
  21. Zeitzer JM, Dijk DJ, Kronauer R, Brown E, Czeisler C. Sensitivity of the human circadian pacemaker to nocturnal light: melatonin phase resetting and suppression. J Physiol. 2000;526 Pt 3:695-702.
  22. Klerman EB, Rimmer DW, Dijk DJ, Kronauer RE, Rizzo JF, 3rd, Czeisler CA. Nonphotic entrainment of the human circadian pacemaker. Am J Physiol. 1998;274(4 Pt 2):R991-6.
  23. Lewy AJ, Newsome DA. Different types of melatonin circadian secretory rhythms in some blind subjects. J Clin Endocrinol Metab. 1983;56(6):1103-7.
  24. Lockley SW, Skene DJ, Arendt J, Tabandeh H, Bird AC, Defrance R. Relationship between melatonin rhythms and visual loss in the blind. J Clin Endocrinol Metab. 1997;82(11):3763-70.
  25. Czeisler CA, Shanahan TL, Klerman EB, Martens H, Brotman DJ, Emens JS, et al. Suppression of melatonin secretion in some blind patients by exposure to bright light. The New England journal of medicine. 1995;332(1):6-11.
  26. Hull JT, Czeisler CA, Lockley SW. Suppression of Melatonin Secretion in Totally Visually Blind People by Ocular Exposure to White Light: Clinical Characteristics. Ophthalmology. 2018;125(8):1160-71.
  27. Malpaux B, Migaud M, Tricoire H, Chemineau P. Biology of mammalian photoperiodism and the critical role of the pineal gland and melatonin. J Biol Rhythms. 2001;16(4):336-47.
  28. Bojkowski CJ, Arendt J, Shih MC, Markey SP. Melatonin secretion in humans assessed by measuring its metabolite, 6-sulfatoxymelatonin. Clin Chem. 1987;33(8):1343-8.
  29. Arendt J, Bojkowski C, Franey C, Wright J, Marks V. Immunoassay of 6-hydroxymelatonin sulfate in human plasma and urine: abolition of the urinary 24-hour rhythm with atenolol. J Clin Endocrinol Metab. 1985;60(6):1166-73.
  30. Cain SW, Dennison CF, Zeitzer JM, Guzik AM, Khalsa SB, Santhi N, et al. Sex differences in phase angle of entrainment and melatonin amplitude in humans. J Biol Rhythms. 2010;25(4):288-96.
  31. Kennaway DJ, Stamp GE, Goble FC. Development of melatonin production in infants and the impact of prematurity. J Clin Endocrinol Metab. 1992;75(2):367-9.
  32. Waldhauser F, Weiszenbacher G, Frisch H, Zeitlhuber U, Waldhauser M, Wurtman RJ. Fall in nocturnal serum melatonin during prepuberty and pubescence. Lancet. 1984;1(8373):362-5.
  33. Wetterberg L, Bergiannaki JD, Paparrigopoulos T, von Knorring L, Eberhard G, Bratlid T, et al. Normative melatonin excretion: a multinational study. Psychoneuroendocrinology. 1999;24(2):209-26.
  34. Kennaway DJ, Lushington K, Dawson D, Lack L, van den Heuvel C, Rogers N. Urinary 6-sulfatoxymelatonin excretion and aging: new results and a critical review of the literature. J Pineal Res. 1999;27(4):210-20.
  35. Bojkowski CJ, Arendt J. Factors influencing urinary 6-sulphatoxymelatonin, a major melatonin metabolite, in normal human subjects. Clin Endocrinol (Oxf). 1990;33(4):435-44.
  36. Scholtens RM, van Munster BC, van Kempen MF, de Rooij SE. Physiological melatonin levels in healthy older people: A systematic review. J Psychosom Res. 2016;86:20-7.
  37. Jengeleski CA, Powers RE, O'Connor DT, Price DL. Noradrenergic innervation of human pineal gland: abnormalities in aging and Alzheimer's disease. Brain Res. 1989;481(2):378-82.
  38. Karasek M. Melatonin, human aging, and age-related diseases. Exp Gerontol. 2004;39(11-12):1723-9.
  39. Reppert SM, Weaver DR, Godson C. Melatonin receptors step into the light: cloning and classification of subtypes. Trends Pharmacol Sci. 1996;17(3):100-2.
  40. Dubocovich ML, Markowska M. Functional MT1 and MT2 melatonin receptors in mammals. Endocrine. 2005;27(2):101-10.
  41. Costa EJ, Lopes RH, Lamy-Freund MT. Permeability of pure lipid bilayers to melatonin. J Pineal Res. 1995;19(3):123-6.
  42. Dubocovich ML, Delagrange P, Krause DN, Sugden D, Cardinali DP, Olcese J. International Union of Basic and Clinical Pharmacology. LXXV. Nomenclature, classification, and pharmacology of G protein-coupled melatonin receptors. Pharmacol Rev. 2010;62(3):343-80.
  43. Reppert SM. Melatonin receptors: molecular biology of a new family of G protein-coupled receptors. J Biol Rhythms. 1997;12(6):528-31.
  44. Johnston JD, Klosen P, Barrett P, Hazlerigg DG. Regulation of MT melatonin receptor expression in the foetal rat pituitary. J Neuroendocrinol. 2006;18(1):50-6.
  45. Arendt J, Bojkowski C, Folkard S, Franey C, Marks V, Minors D, et al. Some effects of melatonin and the control of its secretion in humans. Ciba Found Symp. 1985;117:266-83.
  46. Armstrong SM, Redman JR. Melatonin: a chronobiotic with anti-aging properties? Med Hypotheses. 1991;34(4):300-9.
  47. Lewy AJ, Ahmed S, Jackson JM, Sack RL. Melatonin shifts human circadian rhythms according to a phase-response curve. Chronobiol Int. 1992;9(5):380-92.
  48. Arendt J, Middleton B. Human seasonal and circadian studies in Antarctica (Halley, 75 degrees S). Gen Comp Endocrinol. 2018;258:250-8.
  49. Carr AJ, Johnston JD, Semikhodskii AG, Nolan T, Cagampang FR, Stirland JA, et al. Photoperiod differentially regulates circadian oscillators in central and peripheral tissues of the Syrian hamster. Curr Biol. 2003;13(17):1543-8.
  50. Fuller PM, Lu J, Saper CB. Differential rescue of light- and food-entrainable circadian rhythms. Science (New York, NY). 2008;320(5879):1074-7.
  51. Ebling FJ, Foster DL. Pineal melatonin rhythms and the timing of puberty in mammals. Experientia. 1989;45(10):946-54.
  52. Martin JE, Sattler C. Selectivity of melatonin pituitary inhibition for luteinizing hormone-releasing hormone. Neuroendocrinology. 1982;34(2):112-6.
  53. Waldhauser F, Boepple PA, Schemper M, Mansfield MJ, Crowley WF, Jr. Serum melatonin in central precocious puberty is lower than in age-matched prepubertal children. J Clin Endocrinol Metab. 1991;73(4):793-6.
  54. Berga SL, Mortola JF, Yen SS. Amplification of nocturnal melatonin secretion in women with functional hypothalamic amenorrhea. J Clin Endocrinol Metab. 1988;66(1):242-4.
  55. Parry BL, Berga SL, Mostofi N, Klauber MR, Resnick A. Plasma melatonin circadian rhythms during the menstrual cycle and after light therapy in premenstrual dysphoric disorder and normal control subjects. J Biol Rhythms. 1997;12(1):47-64.
  56. Anderson RA, Lincoln GA, Wu FC. Melatonin potentiates testosterone-induced suppression of luteinizing hormone secretion in normal men. Hum Reprod. 1993;8(11):1819-22.
  57. Luboshitzky R, Wagner O, Lavi S, Herer P, Lavie P. Abnormal melatonin secretion in hypogonadal men: the effect of testosterone treatment. Clin Endocrinol (Oxf). 1997;47(4):463-9.
  58. Voordouw BC, Euser R, Verdonk RE, Alberda BT, de Jong FH, Drogendijk AC, et al. Melatonin and melatonin-progestin combinations alter pituitary-ovarian function in women and can inhibit ovulation. J Clin Endocrinol Metab. 1992;74(1):108-17.
  59. Cagnacci A, Elliott JA, Yen SS. Melatonin: a major regulator of the circadian rhythm of core temperature in humans. J Clin Endocrinol Metab. 1992;75(2):447-52.
  60. Picinato MC, Haber EP, Carpinelli AR, Cipolla-Neto J. Daily rhythm of glucose-induced insulin secretion by isolated islets from intact and pinealectomized rat. J Pineal Res. 2002;33(3):172-7.
  61. Amstrup AK, Sikjaer T, Pedersen SB, Heickendorff L, Mosekilde L, Rejnmark L. Reduced fat mass and increased lean mass in response to 1 year of melatonin treatment in postmenopausal women: A randomized placebo-controlled trial. Clin Endocrinol (Oxf). 2016;84(3):342-7.
  62. Costes S, Boss M, Thomas AP, Matveyenko AV. Activation of Melatonin Signaling Promotes beta-Cell Survival and Function. Mol Endocrinol. 2015;29(5):682-92.
  63. McMullan CJ, Schernhammer ES, Rimm EB, Hu FB, Forman JP. Melatonin secretion and the incidence of type 2 diabetes. JAMA. 2013;309(13):1388-96.
  64. Prokopenko I, Langenberg C, Florez JC, Saxena R, Soranzo N, Thorleifsson G, et al. Variants in MTNR1B influence fasting glucose levels. Nat Genet. 2009;41(1):77-81.
  65. Scheer FA, Van Montfrans GA, van Someren EJ, Mairuhu G, Buijs RM. Daily nighttime melatonin reduces blood pressure in male patients with essential hypertension. Hypertension. 2004;43(2):192-7.
  66. Grossman E, Laudon M, Yalcin R, Zengil H, Peleg E, Sharabi Y, et al. Melatonin reduces night blood pressure in patients with nocturnal hypertension. Am J Med. 2006;119(10):898-902.
  67. Reiter RJ, Mayo JC, Tan DX, Sainz RM, Alatorre-Jimenez M, Qin L. Melatonin as an antioxidant: under promises but over delivers. J Pineal Res. 2016;61(3):253-78.
  68. Tan DX, Reiter RJ, Manchester LC, Yan MT, El-Sawi M, Sainz RM, et al. Chemical and physical properties and potential mechanisms: melatonin as a broad spectrum antioxidant and free radical scavenger. Curr Top Med Chem. 2002;2(2):181-97.
  69. Straif K, Baan R, Grosse Y, Secretan B, El Ghissassi F, Bouvard V, et al. Carcinogenicity of shift-work, painting, and fire-fighting. Lancet Oncol. 2007;8(12):1065-6.
  70. Blask DE, Dauchy RT, Sauer LA. Putting cancer to sleep at night: the neuroendocrine/circadian melatonin signal. Endocrine. 2005;27(2):179-88.
  71. Tan D, Reiter RJ, Chen LD, Poeggeler B, Manchester LC, Barlow-Walden LR. Both physiological and pharmacological levels of melatonin reduce DNA adduct formation induced by the carcinogen safrole. Carcinogenesis. 1994;15(2):215-8.
  72. Tuntapakul S, Kitkhuandee A, Kanpittaya J, Johns J, Johns NP. Pineal calcification is associated with pediatric primary brain tumor. Asia Pac J Clin Oncol. 2016;12(4):e405-e10.
  73. Blask DE, Dauchy RT, Sauer LA, Krause JA, Brainard GC. Light during darkness, melatonin suppression and cancer progression. Neuro Endocrinol Lett. 2002;23 Suppl 2:52-6.
  74. Hansen J. Light at night, shiftwork, and breast cancer risk. J Natl Cancer Inst. 2001;93(20):1513-5.
  75. Lincoln GA, Clarke IJ, Hut RA, Hazlerigg DG. Characterizing a mammalian circannual pacemaker. Science (New York, NY). 2006;314(5807):1941-4.
  76. Mocaer E, Delalleau B, Boyer PA, de Bodinat C. [Development of a new antidepressant : agomelatine]. Med Sci (Paris). 2005;21(10):888-93.
  77. Scheer FA, Zeitzer JM, Ayas NT, Brown R, Czeisler CA, Shea SA. Reduced sleep efficiency in cervical spinal cord injury; association with abolished night time melatonin secretion. Spinal Cord. 2006;44(2):78-81.
  78. Zeitzer JM, Ayas NT, Shea SA, Brown R, Czeisler CA. Absence of detectable melatonin and preservation of cortisol and thyrotropin rhythms in tetraplegia. J Clin Endocrinol Metab. 2000;85(6):2189-96.
  79. Deacon S, English J, Tate J, Arendt J. Atenolol facilitates light-induced phase shifts in humans. Neuroscience letters. 1998;242(1):53-6.
  80. Arendt J. Melatonin: Countering Chaotic Time Cues. Frontiers in endocrinology. 2019;10:391.
  81. Muller HL, Handwerker G, Wollny B, Faldum A, Sorensen N. Melatonin secretion and increased daytime sleepiness in childhood craniopharyngioma patients. J Clin Endocrinol Metab. 2002;87(8):3993-6.
  82. De Leersnyder H. Inverted rhythm of melatonin secretion in Smith-Magenis syndrome: from symptoms to treatment. Trends Endocrinol Metab. 2006;17(7):291-8.
  83. Tordjman S, Anderson GM, Pichard N, Charbuy H, Touitou Y. Nocturnal excretion of 6-sulphatoxymelatonin in children and adolescents with autistic disorder. Biological psychiatry. 2005;57(2):134-8.
  84. Melke J, Goubran Botros H, Chaste P, Betancur C, Nygren G, Anckarsater H, et al. Abnormal melatonin synthesis in autism spectrum disorders. Mol Psychiatry. 2008;13(1):90-8.
  85. Maras A, Schroder CM, Malow BA, Findling RL, Breddy J, Nir T, et al. Long-Term Efficacy and Safety of Pediatric Prolonged-Release Melatonin for Insomnia in Children with Autism Spectrum Disorder. J Child Adolesc Psychopharmacol. 2018.
  86. Lehmann ED, Cockerell OC, Rudge P. Somnolence associated with melatonin deficiency after pinealectomy. Lancet. 1996;347(8997):323.
  87. Murata J, Sawamura Y, Ikeda J, Hashimoto S, Honma K. Twenty-four hour rhythm of melatonin in patients with a history of pineal and/or hypothalamo-neurohypophyseal germinoma. J Pineal Res. 1998;25(3):159-66.
  88. Slawik H, Stoffel M, Riedl L, Vesely Z, Behr M, Lehmberg J, et al. Prospective Study on Salivary Evening Melatonin and Sleep before and after Pinealectomy in Humans. J Biol Rhythms. 2016;31(1):82-93.
  89. Mendelson WB, Bergmann BM. Effects of pinealectomy on baseline sleep and response to sleep deprivation. Sleep. 2001;24(4):369-73.
  90. Fisher SP, Sugden D. Endogenous melatonin is not obligatory for the regulation of the rat sleep-wake cycle. Sleep. 2010;33(6):833-40.
  91. Posadzki PP, Bajpai R, Kyaw BM, Roberts NJ, Brzezinski A, Christopoulos GI, et al. Melatonin and health: an umbrella review of health outcomes and biological mechanisms of action. BMC Med. 2018;16(1):18.
  92. Sateia MJ. International classification of sleep disorders-third edition: highlights and modifications. Chest. 2014;146(5):1387-94.
  93. Carney CE, Buysse DJ, Ancoli-Israel S, Edinger JD, Krystal AD, Lichstein KL, et al. The consensus sleep diary: standardizing prospective sleep self-monitoring. Sleep. 2012;35(2):287-302.
  94. Lewy AJ, Sack RL. The dim light melatonin onset as a marker for circadian phase position. Chronobiol Int. 1989;6(1):93-102.
  95. Dijk DJ, Shanahan TL, Duffy JF, Ronda JM, Czeisler CA. Variation of electroencephalographic activity during non-rapid eye movement and rapid eye movement sleep with phase of circadian melatonin rhythm in humans. J Physiol. 1997;505 ( Pt 3):851-8.
  96. Auger RR, Burgess HJ, Emens JS, Deriy LV, Thomas SM, Sharkey KM. Clinical Practice Guideline for the Treatment of Intrinsic Circadian Rhythm Sleep-Wake Disorders: Advanced Sleep-Wake Phase Disorder (ASWPD), Delayed Sleep-Wake Phase Disorder (DSWPD), Non-24-Hour Sleep-Wake Rhythm Disorder (N24SWD), and Irregular Sleep-Wake Rhythm Disorder (ISWRD). An Update for 2015: An American Academy of Sleep Medicine Clinical Practice Guideline. J Clin Sleep Med. 2015;11(10):1199-236.
  97. Lockley SW, Arendt J, Skene DJ. Visual impairment and circadian rhythm disorders. Dialogues Clin Neurosci. 2007;9(3):301-14.
  98. Lewy AJ. Clinical applications of melatonin in circadian disorders. Dialogues Clin Neurosci. 2003;5(4):399-413.
  99. Smits MG, Nagtegaal EE, van der Heijden J, Coenen AM, Kerkhof GA. Melatonin for chronic sleep onset insomnia in children: a randomized placebo-controlled trial. J Child Neurol. 2001;16(2):86-92.
  100. van Geijlswijk IM, Korzilius HP, Smits MG. The use of exogenous melatonin in delayed sleep phase disorder: a meta-analysis. Sleep. 2010;33(12):1605-14.
  101. Campbell SS. Effects of timed bright-light exposure on shift-work adaptation in middle-aged subjects. Sleep. 1995;18(6):408-16.
  102. Nagtegaal JE, Kerkhof GA, Smits MG, Swart AC, Van Der Meer YG. Delayed sleep phase syndrome: A placebo-controlled cross-over study on the effects of melatonin administered five hours before the individual dim light melatonin onset. J Sleep Res. 1998;7(2):135-43.
  103. Uchiyama M, Lockley SW. Non-24-Hour Sleep-Wake Rhythm Disorder in Sighted and Blind Patients. Sleep Med Clin. 2015;10(4):495-516.
  104. Sack RL, Auckley D, Auger RR, Carskadon MA, Wright KP, Jr., Vitiello MV, et al. Circadian rhythm sleep disorders: part II, advanced sleep phase disorder, delayed sleep phase disorder, free-running disorder, and irregular sleep-wake rhythm. An American Academy of Sleep Medicine review. Sleep. 2007;30(11):1484-501.
  105. Arendt J. Managing jet lag: Some of the problems and possible new solutions. Sleep Med Rev. 2009;13(4):249-56.
  106. Herxheimer A, Petrie KJ. Melatonin for the prevention and treatment of jet lag. Cochrane Database Syst Rev. 2002(2):CD001520.
  107. Folkard S, Arendt J, Clark M. Can melatonin improve shift workers' tolerance of the night shift? Some preliminary findings. Chronobiol Int. 1993;10(5):315-20.
  108. Burgess HJ, Sharkey KM, Eastman CI. Bright light, dark and melatonin can promote circadian adaptation in night shift workers. Sleep Med Rev. 2002;6(5):407-20.
  109. Bordet R, Devos D, Brique S, Touitou Y, Guieu JD, Libersa C, et al. Study of circadian melatonin secretion pattern at different stages of Parkinson's disease. Clin Neuropharmacol. 2003;26(2):65-72.
  110. Xie Z, Chen F, Li WA, Geng X, Li C, Meng X, et al. A review of sleep disorders and melatonin. Neurol Res. 2017;39(6):559-65.
  111. Riemersma-van der Lek RF, Swaab DF, Twisk J, Hol EM, Hoogendijk WJ, Van Someren EJ. Effect of bright light and melatonin on cognitive and noncognitive function in elderly residents of group care facilities: a randomized controlled trial. JAMA. 2008;299(22):2642-55.
  112. Morgenthaler TI, Lee-Chiong T, Alessi C, Friedman L, Aurora RN, Boehlecke B, et al. Practice parameters for the clinical evaluation and treatment of circadian rhythm sleep disorders. An American Academy of Sleep Medicine report. Sleep. 2007;30(11):1445-59.
  113. Loiseau F, Le Bihan C, Hamon M, Thiebot MH. Antidepressant-like effects of agomelatine, melatonin and the NK1 receptor antagonist GR205171 in impulsive-related behaviour in rats. Psychopharmacology (Berl). 2005;182(1):24-32.
  114. Arendt J, Rajaratnam SM. Melatonin and its agonists: an update. Br J Psychiatry. 2008;193(4):267-9.
  115. Harpsoe NG, Andersen LP, Gogenur I, Rosenberg J. Clinical pharmacokinetics of melatonin: a systematic review. Eur J Clin Pharmacol. 2015;71(8):901-9.
  116. Weishaupt JH, Bartels C, Polking E, Dietrich J, Rohde G, Poeggeler B, et al. Reduced oxidative damage in ALS by high-dose enteral melatonin treatment. J Pineal Res. 2006;41(4):313-23.
  117. Zhdanova IV, Wurtman RJ, Morabito C, Piotrovska VR, Lynch HJ. Effects of low oral doses of melatonin, given 2-4 hours before habitual bedtime, on sleep in normal young humans. Sleep. 1996;19(5):423-31.
  118. Seabra ML, Bignotto M, Pinto LR, Jr., Tufik S. Randomized, double-blind clinical trial, controlled with placebo, of the toxicology of chronic melatonin treatment. J Pineal Res. 2000;29(4):193-200.


Use of the Historial Weight Trajectory to Guide an Obesity-Focused Patient Encounter

ABSTRACT


Obesity is a chronic, complex, and challenging disease to address by clinicians. Thus, it is crucial for practitioners to obtain a thorough weight history from patients to identify potential triggers that influence weight gain trajectories and their relationships to development of disease co-morbidity and mortality. Obtaining a weight history from a patient can be approached systematically, similar to key elements of a history of present illness, as we will discuss.  Furthermore, patient-drawn life-events graph or readily available electronic health records graphs can elucidate in visual context pertinent contributing factors to the etiology of obesity. Often, biological, social, behavioral, and psychological causes of weight gain can be elicited through the use of weight histories. In this chapter, we will also explore life-events graph more in detail as they can provide remarkable value to the overall assessment and plan of care (whether lifestyle intervention alone or in combination with pharmacological, surgical, or combination thereof) in the patient with obesity.


INTRODUCTION


Obesity adversely affects all organ systems in the human body and causes and/or exacerbates numerous medical disorders such as cardiovascular disease, diabetes, kidney disease, and some forms of cancer. Today, the average adult weight has increased (1), disproportionately skewing rightward (2) in the body mass index (BMI) distribution curve (Figure 1) with a higher percentage of the population meeting criteria for Class 1 obesity or greater (>30 kg/m2) and more disease severity (Class 2 obesity or higher;  BMI >35 kg/m2). In addition, the average waist circumference has increased across US adults since 1999 (3). Increases in abdominal girth (>35 inches for women;  >40 inches for men), commonly called central or abdominal obesity, is a surrogate for visceral adiposity, which increases risk for the metabolic syndrome, type 2 diabetes, inflammation, and cardiovascular disease (4).

Figure 1.  Changing shape of BMI distribution curve over time (2).


Obesity is defined as a pathologically elevated and defended body fat mass due to dysregulation of the pathways that determine energy balance. The complexity in these pathways, including biological, genetic, developmental, epigenetic, environmental, or behavioral factors, lead to substantial variability in the pathophysiological expression of both amount of unwanted weight gain experienced by an individual as well as the number and severity of co-morbid conditions (diabetes, hypertension, etc.) (5-9). 


In addition to the variability in phenotypic presentation of weight gain and fat distribution in individuals with obesity (10), weight loss responses to lifestyle, pharmacological, and surgical treatment are also heterogeneous. Although most patients elicit an average response to a distinct type of treatment, some patients will have an above average response to the intervention, while responses in others may be sub-optimal, or they may not respond at all. Thus, a thorough weight history in combination with a clinically applied and integrated understanding of this disease, its root causes, and etiology can help guide successful treatment.


THE OVERWEIGHT AND OBESITY-FOCUSED ENCOUNTER


History, Physical, and Laboratory Testing of the Patient who is Overweight or Has Obesity


The evaluation and diagnosis of a patient with obesity includes the taking of a standard medical history with special attention to identification of potentially weight-promoting medications and obesity-related complications (11), a medical examination that characterizes the amount and distribution of weight as well as possible signs of secondary causes of unwanted weight gain, and review of relevant clinical laboratory tests. In addition, the history of present illness includes generation of a chronological weight graph (ideally using the electronic health record (EHR)) that incorporates a review of life events, lifestyle patterns and preferences, and previous successful and unsuccessful interventions. 


The physical exam should note the distribution of weight (especially truncal and abdominal) and areas of conspicuous absence of fat characteristic of lipodystrophies (12), both of which herald increased cardiometabolic risk, as well as areas of disproportionate accumulation of excess fat, such as lipomas and lipedema (13); documentation of cardiac status looking specifically for evidence of heart failure; abdominal palpation for hepatomegaly; identification of inflammatory or degenerative joint issues that may limit activity; and skin/neurological examinations to look for evidence of hypercortisolism (wide striae, proximal muscle weakness), hypothyroidism, hirsutism/acne that might indicate polycystic ovarian syndrome, and acanthosis nigricans over extensor surfaces/neck/axilla. Laboratory evaluation at the initial visit should include a comprehensive metabolic panel, complete blood count, assessment of thyroid status, and cardiometabolic risk assessment including a lipid panel and A1c (Table 1). 


Table 1.  Key Elements of an Obesity-Focused Encounter

History of Present Illness (HPI)


Weight History and timing to life events, developmental milestones (including puberty, pregnancy, menopause), medication use, and injuries, surgeries, or illnesses.

Past Medical and Surgical History (PMH, PSH)


In addition to a general review, identification of obesity-associated comorbidities and procedures:  gastroesophageal reflux, hypertension, HFpEF, asthma, OSA, OA, type 2 diabetes, CAD and PVD, menstrual irregularities/infertility/PCOS, bariatric surgery.

Social History (SH)

Lifestyle, health practices, nutrition, physical activity, sleep, smoking and recreational drug use, stressors, occupation, marital status.

Family History

Parental obesity, cultural patterns, family eating patterns.

Medications

Weight-gain promoting medications.

Physical Exam

BMI, waist circumference

Distribution of body fat, lipodystrophy, lipedema, hypercortisolism, acanthosis.

Laboratory and Diagnostic Testing

Risk assessment:  comprehensive metabolic panel, complete blood count, 25-OH vitamin D, C-reactive protein, TSH, hemoglobin A1c, and lipid panel.  When indicated, screening for co-morbid conditions such as obstructive sleep apnea, non-alcoholic steatohepatitis, and PCOS.

Assessment and Plan

Based on risks, complications, comorbid conditions and barriers to care.


Identification of obesity-related co-morbidities during the patient encounter and lab testing may necessitate referral for further evaluation, such as non-invasive imaging or liver biopsy to establish non-alcoholic steatohepatitis, a sleep study to diagnose obstructive sleep apnea, or X-rays to assess osteoarthritis in weight-bearing joints. Patients reporting low-level chest discomfort, dyspnea on exertion, or orthopnea should be considered for referral to a cardiologist for the possibility of cardiac ischemia or heart failure with preserved ejection fraction (HFpEF), an increasingly recognized disorder of severe obesity. Findings of weight-related medical conditions during the initial visit may prompt increased motivational drive toward behavioral and lifestyle changes as well as acceptance of recommendations to use anti-obesity medications or for referral for bariatric surgery. 


CLINICAL IMPORTANCE OF A WEIGHT TRAJECTORY


During the weight-focused portion of the history of present illness, it is important to document changes in the health that led the patient to seek medical attention over time and establish a clear and chronological description of the sequential events, including weight gain or loss, leading up to the current visit (14-16) (Table 2).


Table 2.  Key Elements of an Obesity-Focused History of Present Illness (16)

Onset

When did your weight gain start.

What did you weigh in early, late childhood, puberty, by decade as adult?

Nadir and Maximum Weight

What were your lifetime lowest and highest weights (excluding pregnancy)?

How did you achieve your lowest weight?

Precipitating Factors

What events in your life coincided with unwanted weight gain (puberty, pregnancy, menopause, starting or stopping smoking, starting a new medication such as insulin or steroids)?

Quality of Life

What is hardest to do at your current weight?

When did you feel your best?

Weight Loss Efforts

What did you try that helped you lose weight?

What interventions were successful for you?

Setting

In what context were you successful at your previous efforts?  Why do you think those efforts worked?

Temporal Patterns

What is the nature of your weight loss and weight gain over time?

Do you ever weight cycle (yo-yo) or is it gradual or rapid over time?


Multiple studies have demonstrated that an early childhood upward weight trajectory can be predictive of future development of obesity, obesity-related comorbid conditions, disability, and mortality (17-21). A lifetime maximum BMI (compared to a single baseline BMI measurement) in the overweight or obesity categories, coupled with 16 or more years of weight history, is associated with an increased all-cause and cause-specific mortality including cardiovascular disease and coronary heart disease (22). 


As will be discussed below, temporal patterns of weight gain that raise concerns in a weight history might include: (a) an early adiposity rebound during infancy or early childhood years (23,24), (b) adolescent weight gain that correlates with progression to severe adult obesity and related medical conditions (25), and (c) excessive weight gain during pregnancy or menopause. Other temporal associations with weight gain often not appreciated by patients and providers include those that accompany smoking cessation (26), resolution of  hyperthyroidism (27), initiation of medications for depression, anxiety, and pain management (e.g., beta-blockers, amitriptyline, gabapentin, others) (11), and normal age-associated sarcopenia where  skeletal muscle mass gradually declines and visceral fat preferentially increases (28).


Early Growth, Childhood, and Puberty


The timing of excessive body weight gain during one’s life is a predictor of future disease severity. Early and rapid weight gain during youth is predictive of co-morbidities later in life and these patients often experience a more steeply inclined weight trajectory into later stages of adulthood (19). During the ages of 2-6 years, children normally have lower adiposity and are usually at their nadir weight before “rebounding” back up during normal growth (Figure 2, blue line). When adiposity rebound occurs at less than one year of age as visualized on the BMI for-age and gender appropriate growth charts, typically expressed in percentile for age and sex, syndromic, congenital, and monogenic causes of obesity should be considered. Such a very early clinical weight gain history should trigger consideration for genetic testing of genes in the canonical melanocortin pathways (LEPR, PCSK1, POMC, MC4R), which range in incidence from very rare to being implicated in up to 1-6% of early-onset severe obesity (23,29,30). Genetic screening for obesity genes can also be triggered by rapid weight gain from early infancy, development of severe obesity (> 97thBMI percentile) at early ages (especially before the age of 10), persistent food-seeking behaviors indicative of poor appetite control, parental consanguinity, and tall stature/increased growth velocity (31). A weight trajectory following an early adiposity rebound (> 1 year age, ≤ 6 years of age, Figure 2, red dotted line) is a strong risk factor for obesity in adolescence and beyond (24,32) and should be can be an indication for early family-oriented lifestyle interventions.

Figure 2. BMI Percentile Growth Chart.


Weight gain leading to obesity during the adolescent development period correlates highly with progression to severe adult obesity. Development of adolescent obesity can affect timing of puberty (early vs. delayed) when body composition and fat distribution are rapidly changing (33). During normal pubertal development and growth, males acquire greater fat-free and skeletal muscle mass, whereas females attain higher fat mass (34).    

Figure 3. Schematic depiction of abnormal BMI percentile growth curves for adolescents with severe obesity.  Greater than or equal to the 95th BMI percentile corresponds to cut-offs for pediatric obesity. Other important considerations that determine therapeutic criteria are if the adolescent’s trajectory falls at or above 120th% and 140th% the 95th BMI percentile for age/gender (see Table 3).


Most patients who experience unwanted, excess weight gain in childhood and adolescence develop obesity-related complications that, when severe, often require pharmacologic intervention and/or bariatric surgery. Early identification and treatment are recommended as for prevention (35).  Currently there are six FDA-approved anti-obesity medications available for chronic weight management (orlistat, phentermine/topiramate, liraglutide 3.0 mg, semaglutide 2.4 mg, and setmelanotide). Phentermine/topiramate and orlistat are approved for >12 years respectively, phentermine alone is approved for age >16 years, and setmelanotide can be used as early as 6 years of age  (35,36). Use of anti-obesity pharmacotherapy in adolescents with severe obesity (>95th BMI percentile plus the presence of obesity-related comorbidity or >120th of 95th BMI percentile) is now considered standard of care for pediatric obesity treatment (35).  Furthermore, vertical sleeve gastrectomy and Roux-en-Y metabolic and bariatric surgery procedures are available options for adolescents with severe obesity (>120th of 95th BMI percentile plus obesity-related comorbidity or BMI >140th of 95th BMI percentile) (37). 


Table 3. Available therapeutic options based on BMI percentile cut offs of weight trajectory in adolescent patients with severe obesity (38).

BMI percentile as per CDC growth chart

>95th BMI percentile

>120th of the 95thBMI percentile

>140th of the 95thBMI percentile

Intensive lifestyle intervention

Anti-obesity medication

With comorbidity

Adolescent bariatric metabolic surgery


With comorbidity


Pregnancy, Breast Feeding, and Menopausal Transition


Pregnancy and menopause can be a time when women’s weights and body composition may become permanently altered under the influence of dramatic shifts in sex steroid levels.  Excessive weight gain during pregnancy can result in epigenetic changes in the developing fetus leading to adult-onset chronic disease such as diabetes, cardiovascular disease, and obesity (39-45) .  Furthermore, maternal obesity and excessive gestational weight gain have been linked to maternal-fetal complications such as increased risk of C-sections, preeclampsia, shoulder dystocia, and macrosomia in the infant (46-48). Data from large population-based epidemiological studies have shown that roughly 50% to 60% of women after pregnancy will return to their pre-pregnancy weight, but the other 50% will retain extra weight, with a third of all pregnant women shifting a BMI category (normal to overweight or obesity) (49).


The post-partum period following delivery of the newborn infant is also a vulnerable time for weight retention. Moreover, the relationship between breastfeeding practices and postpartum weight changes is largely unclear due to the difficulties examining breastfeeding and weight management in observational research and confounding variables (50,51). Breastfeeding overall has other notable health benefits to the infant, including reducing atop and improving , cognitive development, bone health, and maternal-infant attachment (52). 


Weight gain during midlife is common, and about two-thirds of women ages 40 to 59 and nearly three-quarters of women older than 60 are overweight or have obesity (BMI greater than 25 kg/m2). On average, midlife women gain 1.5 pounds (0.7 kg) per year (53). Thus, it is not surprising that menopause is often depicted as a weight-gain trigger on a patient’s life-event graph, especially in older women who gain weight after a period of weight maintenance.  Towards midlife, women undergo redistribution of body composition with increase in total body fat and enhanced inclination toward central abdominal visceral adiposity (54).  Excess body weight during menopause is associated with elevated cardiovascular (55) and metabolic risk, including insulin resistance and Type 2 diabetes mellitus (56,57). Early or late-onset menopause (with final menstrual cycle age < 45 years or age > 55 years respectively) compared to age 46-55 years is associated with increased risk of Type 2 diabetes mellitus [HR 1.04, 95% CI 0.99, 1.09 and HR 1.08, 95% CI 1.01, 1.14, respectively] (58). Undergoing a hysterectomy or an oophorectomy increases diabetes risk further (RR 1.17, 95% CI 1.07-1.29) compared to peri-/post-menopausal women (59).


CASE LESSONS IN PATIENT-GENERATED WEIGHT GRAPHS


While in the clinic, having a patient generate their own drawing of weight graph accomplishes two-fold goals. First, it provides a template on which weight inflections in the patient’s life can be potentially identified with causative or contributory life events, medical conditions, and medications; and secondly, it provides a platform to guide the clinical discussion regarding appropriate goal setting and best approaches to help them achieve as close to a healthy weight range as possible. 


Impact of Medications


The patient in Figure 4 experienced steroid-induced weight gain, a very common iatrogenic cause of obesity.  Exploring reasons for why this patient was initiated on steroids and communication with other specialists regarding opportunities to switch to another non-steroid dependent medication, if available, might mitigate the weight gain and prove to be a successful weight management strategy. Similar discussions of alternative approaches may also be undertaken with other commonly prescribed medications that promote weight gain, including some birth control methods (e.g., Depo-Provera), histamines, beta-blockers, amitriptyline, gabapentin, pregabalin, sulfonylureas, thiazolidinediones, and insulin (60).

Figure 4. Life graph showing effects of repeated exposures to steroids on weight for chronic inflammatory arthritis.


Effects of Situational Life Changes That Impact Weight


In Figure 5, the patient’s weight was at its nadir during college years until graduation.  Subsequently, marriage and job change were identified as life factors timed to weight gain.  In addition, pregnancy and menopause were identified biological associations with upward weight trajectory over time. Psychological stressors appear to have further augmented weight gain over time. Resilience to major life stressors (marriage, divorce, loss of spouse, unemployment, death of a loved one, major illness or injury, moving/relocation) is, unfortunately, not as common as is thought and can precipitate psychosocial disorders such as anxiety, depression, and alcoholism  (61,62).

Figure 5.  Life graph showing effects of several situational life changes that impact weight.


The patient In Figure 6 had a stable weight prior to a physically traumatic incident that led to immobility and sedentary behaviors. Identification of this specific event contributing to upward weight trajectory in the patient helped tailor the treatment strategy toward physical therapy, rehabilitation, and a customized exercise prescription to mitigate the weight gain.

Figure 6.  Life graph showing effect of a traumatic incident (a motor vehicle accident in this case) on weight.


Identification of Response to Weight Loss Interventions


The patient in Figure 7 gained over 40 pounds during exposure to various antipsychotic medications for the treatment of bipolar disorder. The downward shift in the weight graph occurred after initiation of metformin 500 mg once daily (to mitigate antipsychotic medication induced weight gain (63)) and phentermine. If certain medications are critical and cannot be substituted with an alternative, weight neutral medication, as is often the case in patients requiring anti-psychotic medications, anti-obesity medications (64), or bariatric surgery can often reverse the weight gain.

Figure 7. Life graph showing the effects of antipsychotic medications on weight and effective therapeutic intervention with metformin and anti-obesity medications.


Obesity has a multifactorial etiology leading to wide variability in its presentation.  Understanding causation and association of weight gain promoting factors in a patient’s life can help elucidate appropriate treatment strategies. Furthermore, initial non-response to anti-obesity medication does not indicate that the medication is ineffective. Rather it may not be targeting the pathophysiological pathways involved in metabolic and body weight dysregulation in the individual patient and an alternative anti-obesity medication or combination should be trialed for synergistic or additive weight loss effects. In Figure 8, the first blue arrow shows the time of initial visit when the patient started to gain weight due to multifactorial etiology (strong family history of obesity, maladaptive stress related to work, unhealthy nutritional habits), followed by initiation of anti-obesity medicine therapy and intensive lifestyle intervention (phentermine; 2nd blue arrow). Subsequently, the patient developed side effects and phentermine monotherapy was discontinued (3rd blue arrow). Several other anti-obesity pharmacological options were trialed (4th blue arrow); however, the patient did not respond. Ultimately, the patient underwent bariatric surgery (Roux-en-Y gastric bypass (RYGB)) to achieve successful weight loss response. 

Figure 8. The life events graph depicts the response to treatment and strategies for further intervention.


Identification of Weight Regain after Successful Weight Loss:  Importance of Prompt Intervention and Identification of Lifetime Maximum Weight

Figure 9.  Life graph showing effect of weight loss program intervention over time with weight regain.


The life-events graph of a 55-year-old patient with a history of hypertension, obstructive sleep apnea, and severe obesity (BMI 41.8 kg/m2) in Figure 9 shows a 95 pounds over a 1.5-year period through self-monitoring using an electronic smart phone tracking application, 1800 kcal/day intake, and an increase in physical activity as tolerated. However, after 1.5 years of successful weight loss, despite continued intensive lifestyle changes, the patient experienced weight regain over the next 3 years. Weight regain after a period of caloric restriction is physiologic as long-term persistence of metabolic adaptation occurs and hunger and satiety signals resist weight loss (65). It important to initiate anti-obesity pharmacotherapy at this critical stage to help sustain the weight loss and prevent weight regain. In this patient, starting an anti-obesity medication after 1.5 years when weight gain had started to occur would be recommended. It is also important to identify the patient’s lifetime max as the starting point when gauging effectiveness of anti-obesity medications in this scenario. Simply using the pre-medication weight might lead to inappropriate stopping of this treatment if weight stabilization is achieved, since the absence of subsequent weight loss might be misinterpreted as medication “failure.” By determining the lifetime maximum weight, however, weight stabilization is a very successful ~20% to 30% total weight loss (50 to 100 lbs. weight loss compared to the lifetime maximum weight of 293 lbs., depending on when it was started).

Figure 10.  Life graph showing a patient status post gastric-bypass surgery with weight regain following situational life transitions (marriage, birth of children).

Figure 11.  Life graph showing weight loss in a patient after bariatric surgery followed by weight regain after high job-related stress and retirement. 

Figures 10 and 11 depict life-event graphs of two patients who underwent metabolic and bariatric surgery. Following successful weight loss, they both experienced weight regain.  Weight regain in the postoperative bariatric patient is often difficult to treat and is usually of multifactorial etiology (as examples, recurrence of obesity-related comorbidities, non-compliance and adherence to treatment recommendations and routine bariatric care, physiologic return of hunger signals, introduction of life stressors). Early recognition, evaluation and medical management, provided anatomical causes have been ruled out, with multidisciplinary team support are crucial to removing obstacles to weight maintenance and patient’s continued commitment to lifestyle improvements. Further, it presents an opportunity to intervene early and initiate anti-obesity pharmacotherapy, ideally at the expected weight loss nadir, usually 1-3 years after surgery, to help optimize weight loss response and prevent weight regain (66).    

Communicating with Patients About the Disease of Obesity

To effectively communicate obesity treatment recommendations to patients, medical professionals first need to translate obesity pathophysiology in language understood by patients, without bias or stigma. General questions, concerns, or sentiments often echoed by patients during their weight journey include:


  1. “Doc, are you calling me ‘fat?’”
  2. “I have tried every diet in the past. I lose weight only to regain it back.”
  3. “I know it’s my fault I am this weight.”
  4. “I have always been 300 pounds my entire life, no matter what.”
  5. “I don’t think I need surgery. I’ll just have to diet and exercise anyways.”
  6. “I don’t need medications to lose weight.”


Clinically, there are three important concepts to convey to patients about the disease state: 


  1. Obesity is a disease, like hypertension or diabetes.
  2. Because it is a disease, we can treat it as such, either starting with lifestyle and then moving on to medical and surgical treatments for obesity, or initiating lifestyle plus these treatments in patients with severe obesity.
  3. It is not the patient’s fault that they developed obesity.There are strong biological and genetic forces at play that determine body mass in addition to medical, behavioral, lifestyle, psychosocial, and environmental influences.


To clearly communicate with patients about the disease of obesity, a thorough understanding of energy metabolism is often necessary. Energy metabolism is complexly regulated in the arcuate nucleus of the hypothalamus to set a defended body weight (10,36,67). This body weight “set point” is oftentimes biologically and genetically determined with influences from the modern macro- and micro-environments. Chronic exposure to an obesogenic environment can increase body fat mass set point in susceptible individuals causing the body to defend a higher weight regardless of well-intended volitional efforts to lose weight. Thus, current treatment strategies include coupling intensive lifestyle therapy with anti-obesity medications and/or bariatric surgery, to allow significant and sustained reductions in the fat mass set point. Discontinuation of treatments that successfully lower the body mass set point will result in regain of body weight to the original, pathologically higher body mass set point. Therefore, patients need to understand that treatments for obesity are long-term, as is true for any medication prescribed for a chronic medical condition. Regain of weight after discontinuation of therapy is not evidence of failed treatment or lack of willpower; rather it is physiologically expected. 


Medical professionals can incorporate this scientific understanding in a manner that evades bias and stigma and transforms the patient’s queries into a constructive dialogue. In response to the questions or concerns posed by the patients above, medical professionals can reply in the following manner: 


  1. “Doc, are you calling me ‘fat’?” Response: “We only use the word ‘fat’ to describe mice and rodents, not humans. We are people. There are various parameters we check to make sure your body is healthy, not only from the outside, but also from the inside, similar to us checking your blood pressure and cholesterol. Your weight indicates that your body-mass-index is elevated. It means that it places you at high risk for, or already contributing to, other weight-related medical conditions. A high BMI is a result of a disease process inside your body, like diabetes. You have obesity, or adiposity-based chronic disease. The good news is that you have treatment options beyond just saying ‘eat less and exercise more’.” 
  2. “I have tried every diet in the past. I lose weight only to regain it back.”  Response: “Contrary to popular belief, we don’t consciously control our weight. It is regulated by a fat mass set point in our brains.  If your fat mass set point is abnormally high (again, not your fault), your body will continue to defend that weight. This abnormal physiology is why weight regain is common. There are treatments that more effectively lower that fat mass set point, so you do not have to struggle. That way, when you are making healthy food choices and are active, your body starts to respond. If you’d like, we can discuss those treatment options and how they may benefit you.” 
  3. “I know it’s my fault I am this weight.” Response:First of all, I want you to understand that it’s not your fault you developed obesity. You did not choose to ‘have’ obesity. If you were here today to discuss your diabetes diagnosis, it would be a completely different conversation, correct? Just like you did not have a choice in selecting your parents, you did not have a choice in the development of your obesity.  Again, contrary to popular belief, majority of our weight is not under our control.  The good news is that we can treat it.” 
  4. “I have always been 300 pounds my entire life, no matter what.” Response: “Have you wondered why that has been the reason?  We now know that there is a weight set point in our brain that determines what our brains think of as “normal.”. It is biologically and genetically determined with influences from the outside environment, medications, and other factors. In patients with obesity, this weight set point is abnormally high—your brain thinks that weight is now “normal.”  Thus, when you try to lose weight, you regain it back to this set point and, sometime, more. If improving your lifestyle isn’t working, we have treatments to lower this fat mass set point when it is high.  Anti-obesity medications and bariatric surgery are great tools to allow your brain to be happy with a lower weight set point so that you do not have to fight against your body.”
  5. “I don’t think I need surgery. I’ll just have to diet and exercise anyways.”  Response: “Let’s explore this further.  Can you help me understand more your reasons as to why you think you do not need surgery? What are your concerns and fears? What is your understanding about bariatric surgery? Let’s see if we can address some of those today.”
  6. “I don’t need medications to lose weight.” Response: “Can you help me understand your reasons for not considering medications? What is your understanding of obesity medications and how they work? If we try to manage your weight without medications, I would like to reassess your progress in 12 weeks.  If you are still struggling despite all your best efforts, please know that it is not your fault, and that your body is telling you that it needs something more intensive to treat the weight gain. You do have options still!”


CONCLUSIONS


An obesity-focused medical history is important for the care of the patient who is overweight or has obesity. In addition to identifying obesity-related complications by means of a thorough history, physical, and appropriate laboratory work up, using electronic health record weight graphs and identifying significant medical and life-events that influence body weight provide context and relevance for weight trajectories in the management of a patient with obesity.  For example, these events can help guide the clinical discussion in regard to potentially modifiable influences on a patient’s weight, including identifying causative medical conditions or culprit medications that promote weight gain, associating weight gain with known life-transitions that increase a patient’s risk for becoming overweight or obese (e.g., puberty, pregnancy, menopause), help patients to re-commit to improved lifestyle choices, assess an individual’s responsiveness to recommended therapies, and help with timing for when initiating anti-obesity, therapies such as weight loss medications, weight loss surgery, or both, when indicated.       


REFERENCES


  1. Flegal KM, Carroll MD, Kit BK, Ogden CL. Prevalence of obesity and trends in the distribution of body mass index among US adults, 1999-2010. JAMA. 2012;307(5):491-497.
  2. Penman AD, Johnson WD. The changing shape of the body mass index distribution curve in the population: implications for public health policy to reduce the prevalence of adult obesity. Prev Chronic Dis. 2006;3(3):A74.
  3. Fryar CD, Kruszon-Moran D, Gu Q, Ogden CL. Mean Body Weight, Height, Waist Circumference, and Body Mass Index Among Adults: United States, 1999-2000 Through 2015-2016. Natl Health Stat Report. 2018(122):1-16.
  4. Ritchie SA, Connell JM. The link between abdominal obesity, metabolic syndrome and cardiovascular disease. Nutr Metab Cardiovasc Dis. 2007;17(4):319-326.
  5. Bessler M, Daud A, DiGiorgi MF, Schrope BA, Inabnet WB, Davis DG. Frequency distribution of weight loss percentage after gastric bypass and adjustable gastric banding. Surg Obes Relat Dis. 2008;4(4):486-491.
  6. Gardner CD. Tailoring dietary approaches for weight loss. Int J Obes Suppl. 2012;2(Suppl 1):S11-S15.
  7. Smith SR, Prosser WA, Donahue DJ, Morgan ME, Anderson CM, Shanahan WR, Group APDS. Lorcaserin (APD356), a selective 5-HT(2C) agonist, reduces body weight in obese men and women. Obesity (Silver Spring). 2009;17(3):494-503.
  8. Hatoum IJ, Greenawalt DM, Cotsapas C, Reitman ML, Daly MJ, Kaplan LM. Heritability of the weight loss response to gastric bypass surgery. J Clin Endocrinol Metab. 2011;96(10):E1630-1633.
  9. Buford TW, Roberts MD, Church TS. Toward exercise as personalized medicine. Sports Med. 2013;43(3):157-165.
  10. Srivastava G, Apovian CM. Current pharmacotherapy for obesity. Nat Rev Endocrinol. 2018;14(1):12-24.
  11. Verhaegen AA, Van Gaal LF. Drugs That Affect Body Weight, Body Fat Distribution, and Metabolism. In: Feingold KR, Anawalt, B., Boyce, A., Chrousos, G., Dungan, K., Grossman, A., Hershman, J. M., Kaltsas, G., Koch, C., Kopp, P., Korbonits, M., McLachlan, R., Morley, J. E., New, M., Perreault, L., Purnell, J., Rebar, R., Singer, F., Trence, D. L., Vinik, A., Wilson, D. P., ed. Endotext [Internet]. South Dartmouth (MA) MDText.com, Inc.; 2000-; 2019 Feb 11.
  12. Akinci B, Sahinoz M, Oral E. Lipodystrophy Syndromes: Presentation and Treatment. In: Feingold KR, Anawalt, B., Boyce ,A., Chrousos, G., Dungan, K., Grossman, A., Hershman, J. M., Kaltsas, G., Koch, C., Kopp, P., Korbonits, M., McLachlan, R., Morley, J. E., New, M., Perreault, L., Purnell, J., Rebar, R., Singer, F., Trence, D. L., Vinik, A., Wilson, D., ed. Endotext [Internet]. South Dartmouth (MA): MDText.com, Inc.; 2000-. 2018 Apr 24.
  13. Herbst KL. Subcutaneous Adipose Tissue Diseases: Dercum Disease, Lipedema, Familial Multiple Lipomatosis, and Madelung Disease. In: Feingold KR, Anawalt B, Boyce A, Chrousos G, de Herder WW, Dhatariya K, Dungan K, Hershman JM, Hofland J, Kalra S, Kaltsas G, Koch C, Kopp P, Korbonits M, Kovacs CS, Kuohung W, Laferrere B, Levy M, McGee EA, McLachlan R, Morley JE, New M, Purnell J, Sahay R, Singer F, Sperling MA, Stratakis CA, Trence DL, Wilson DP, eds. Endotext. South Dartmouth (MA)2000.
  14. Adler HM. The history of the present illness as treatment: who's listening, and why does it matter? J Am Board Fam Pract. 1997;10(1):28-35.
  15. Redelmeier DA, Schull MJ, Hux JE, Tu JV, Ferris LE. Problems for clinical judgement: 1. Eliciting an insightful history of present illness. CMAJ. 2001;164(5):647-651.
  16. Kushner RF, Batsis JA, Butsch WS, Davis N, Golden A, Halperin F, Kidambi S, Machineni S, Novick M, Port A, Rubino DM, Saunders KH, Shapiro Manning L, Soleymani T, Kahan S. Weight History in Clinical Practice: The State of the Science and Future Directions. Obesity (Silver Spring). 2020;28(1):9-17.
  17. Malhotra R, Ostbye T, Riley CM, Finkelstein EA. Young adult weight trajectories through midlife by body mass category. Obesity (Silver Spring). 2013;21(9):1923-1934.
  18. Stokes A, Ni Y, Preston SH. Prevalence and Trends in Lifetime Obesity in the U.S., 1988-2014. Am J Prev Med.2017;53(5):567-575.
  19. Zheng Y, Manson JE, Yuan C, Liang MH, Grodstein F, Stampfer MJ, Willett WC, Hu FB. Associations of Weight Gain From Early to Middle Adulthood With Major Health Outcomes Later in Life. JAMA. 2017;318(3):255-269.
  20. Zheng Y, Song M, Manson JE, Giovannucci EL, Hu FB. Group-Based Trajectory of Body Shape From Ages 5 to 55 Years and Cardiometabolic Disease Risk in 2 US Cohorts. Am J Epidemiol. 2017;186(11):1246-1255.
  21. Petrick JL, Kelly SP, Liao LM, Freedman ND, Graubard BI, Cook MB. Body weight trajectories and risk of oesophageal and gastric cardia adenocarcinomas: a pooled analysis of NIH-AARP and PLCO Studies. Br J Cancer. 2017;116(7):951-959.
  22. Yu E, Ley SH, Manson JE, Willett W, Satija A, Hu FB, Stokes A. Weight History and All-Cause and Cause-Specific Mortality in Three Prospective Cohort Studies. Ann Intern Med. 2017;166(9):613-620.
  23. Farooqi IS, O'Rahilly S. The Genetics of Obesity in Humans. In: Feingold KR, Anawalt, B., Boyce A3, Chrousos, G., Dungan, K., Grossman, A., Hershman, J. M., Kaltsas, G., Koch, C., Kopp, P., Korbonits, M., McLachlan, R., Morley, J. E., New, M., Perreault, L., Purnell, J., Rebar, R., Singer, F., Trence, D. L., Vinik, A., Wilson, D. P., ed. Endotext [Internet]. South Dartmouth (MA): MDText.com, Inc.; 2000-; 2017 Dec 23.
  24. Geserick M, Vogel M, Gausche R, Lipek T, Spielau U, Keller E, Pfaffle R, Kiess W, Korner A. Acceleration of BMI in Early Childhood and Risk of Sustained Obesity. N Engl J Med. 2018;379(14):1303-1312.
  25. Twig G, Yaniv G, Levine H, Leiba A, Goldberger N, Derazne E, Ben-Ami Shor D, Tzur D, Afek A, Shamiss A, Haklai Z, Kark JD. Body-Mass Index in 2.3 Million Adolescents and Cardiovascular Death in Adulthood. N Engl J Med. 2016;374(25):2430-2440.
  26. Bush T, Lovejoy JC, Deprey M, Carpenter KM. The effect of tobacco cessation on weight gain, obesity, and diabetes risk. Obesity (Silver Spring). 2016;24(9):1834-1841.
  27. Schneider DF, Nookala R, Jaraczewski TJ, Chen H, Solorzano CC, Sippel RS. Thyroidectomy as primary treatment optimizes body mass index in patients with hyperthyroidism. Ann Surg Oncol. 2014;21(7):2303-2309.
  28. Choi KM. Sarcopenia and sarcopenic obesity. Korean J Intern Med. 2016;31(6):1054-1060.
  29. Oswal A, Yeo GS. The leptin melanocortin pathway and the control of body weight: lessons from human and murine genetics. Obes Rev. 2007;8(4):293-306.
  30. Doulla M, McIntyre AD, Hegele RA, Gallego PH. A novel MC4R mutation associated with childhood-onset obesity: A case report. Paediatr Child Health. 2014;19(10):515-518.
  31. Malhotra S, Sivasubramanian R, Srivastava G. Evaluation and Mangement of Early Onset Genetic Obesity in Childhood. Journal of Pediatric Genetics. 2021.
  32. Rolland-Cachera MF, Peneau S. Growth trajectories associated with adult obesity. World Rev Nutr Diet.2013;106:127-134.
  33. Lee JM, Wasserman R, Kaciroti N, Gebremariam A, Steffes J, Dowshen S, Harris D, Serwint J, Abney D, Smitherman L, Reiter E, Herman-Giddens ME. Timing of Puberty in Overweight Versus Obese Boys. Pediatrics.2016;137(2):e20150164.
  34. Loomba-Albrecht LA, Styne DM. Effect of puberty on body composition. Curr Opin Endocrinol Diabetes Obes.2009;16(1):10-15.
  35. Srivastava G, Fox CK, Kelly AS, Jastreboff AM, Browne AF, Browne NT, Pratt JSA, Bolling C, Michalsky MP, Cook S, Lenders CM, Apovian CM. Clinical Considerations Regarding the Use of Obesity Pharmacotherapy in Adolescents with Obesity. Obesity (Silver Spring). 2019;27(2):190-204.
  36. Kumar RB, Srivastava G, Reid TJ, Aronne LJ. Understanding the pathophysiologic pathways that underlie obesity and options for treatment. Expert Rev Endocrinol Metab. 2021;16(6):321-338.
  37. Pratt JSA, Browne A, Browne NT, Bruzoni M, Cohen M, Desai A, Inge T, Linden BC, Mattar SG, Michalsky M, Podkameni D, Reichard KW, Stanford FC, Zeller MH, Zitsman J. ASMBS pediatric metabolic and bariatric surgery guidelines, 2018. Surg Obes Relat Dis. 2018;14(7):882-901.
  38. Cardel MI, Jastreboff AM, Kelly AS. Treatment of Adolescent Obesity in 2020. JAMA. 2019;322(17):1707-1708.
  39. Stephenson J, Heslehurst N, Hall J, Schoenaker D, Hutchinson J, Cade JE, Poston L, Barrett G, Crozier SR, Barker M, Kumaran K, Yajnik CS, Baird J, Mishra GD. Before the beginning: nutrition and lifestyle in the preconception period and its importance for future health. Lancet. 2018;391(10132):1830-1841.
  40. Fleming TP, Watkins AJ, Velazquez MA, Mathers JC, Prentice AM, Stephenson J, Barker M, Saffery R, Yajnik CS, Eckert JJ, Hanson MA, Forrester T, Gluckman PD, Godfrey KM. Origins of lifetime health around the time of conception: causes and consequences. Lancet. 2018;391(10132):1842-1852.
  41. Fernandez-Twinn DS, Hjort L, Novakovic B, Ozanne SE, Saffery R. Intrauterine programming of obesity and type 2 diabetes. Diabetologia. 2019;62(10):1789-1801.
  42. Jansen MAC, Dalmeijer GW, Saldi SR, Grobbee DE, Baharuddin M, Uiterwaal CS, Idris NS. Pre-pregnancy parental BMI and offspring blood pressure in infancy. European journal of preventive cardiology.2019:2047487319858157.
  43. Heslehurst N, Vieira R, Akhter Z, Bailey H, Slack E, Ngongalah L, Pemu A, Rankin J. The association between maternal body mass index and child obesity: A systematic review and meta-analysis. PLoS medicine.2019;16(6):e1002817.
  44. Razaz N, Villamor E, Muraca GM, Bonamy AE, Cnattingius S. Maternal obesity and risk of cardiovascular diseases in offspring: a population-based cohort and sibling-controlled study. Lancet Diabetes Endocrinol.2020;8(7):572-581.
  45. Perak AM, Lancki N, Kuang A, Labarthe DR, Allen NB, Shah SH, Lowe LP, Grobman WA, Lawrence JM, Lloyd-Jones DM, Lowe WL, Jr., Scholtens DM, Group HF-USCR. Associations of Maternal Cardiovascular Health in Pregnancy With Offspring Cardiovascular Health in Early Adolescence. JAMA. 2021;325(7):658-668.
  46. Mission JF, Marshall NE, Caughey AB. Pregnancy risks associated with obesity. Obstet Gynecol Clin North Am.2015;42(2):335-353.
  47. Marshall NE, Guild C, Cheng YW, Caughey AB, Halloran DR. Maternal superobesity and perinatal outcomes. American journal of obstetrics and gynecology. 2012;206(5):417 e411-416.
  48. Getahun D, Ananth CV, Peltier MR, Salihu HM, Scorza WE. Changes in prepregnancy body mass index between the first and second pregnancies and risk of large-for-gestational-age birth. American journal of obstetrics and gynecology. 2007;196(6):530 e531-538.
  49. Wallace JM, Bhattacharya S, Horgan GW. Weight change across the start of three consecutive pregnancies and the risk of maternal morbidity and SGA birth at the second and third pregnancy. PloS one.2017;12(6):e0179589.
  50. Neville CE, McKinley MC, Holmes VA, Spence D, Woodside JV. The effectiveness of weight management interventions in breastfeeding women--a systematic review and critical evaluation. Birth. 2014;41(3):223-236.
  51. Neville CE, McKinley MC, Holmes VA, Spence D, Woodside JV. The relationship between breastfeeding and postpartum weight change--a systematic review and critical evaluation. Int J Obes (Lond). 2014;38(4):577-590.
  52. Lucas A. Scientific Evidence for Breastfeeding. Nestle Nutr Inst Workshop Ser. 2019;90:1-12.
  53. Kapoor E, Collazo-Clavell ML, Faubion SS. Weight Gain in Women at Midlife: A Concise Review of the Pathophysiology and Strategies for Management. Mayo Clin Proc. 2017;92(10):1552-1558.
  54. Kozakowski J, Gietka-Czernel M, Leszczynska D, Majos A. Obesity in menopause - our negligence or an unfortunate inevitability? Prz Menopauzalny. 2017;16(2):61-65.
  55. Ramezani Tehrani F, Behboudi-Gandevani S, Ghanbarian A, Azizi F. Effect of menopause on cardiovascular disease and its risk factors: a 9-year follow-up study. Climacteric. 2014;17(2):164-172.
  56. Davis SR, Castelo-Branco C, Chedraui P, Lumsden MA, Nappi RE, Shah D, Villaseca P, Writing Group of the International Menopause Society for World Menopause D. Understanding weight gain at menopause. Climacteric. 2012;15(5):419-429.
  57. Senechal M, Arguin H, Bouchard DR, Carpentier AC, Ardilouze JL, Dionne IJ, Brochu M. Weight gain since menopause and its associations with weight loss maintenance in obese postmenopausal women. Clin Interv Aging. 2011;6:221-225.
  58. LeBlanc ES, Kapphahn K, Hedlin H, Desai M, Parikh NI, Liu S, Parker DR, Anderson M, Aroda V, Sullivan S, Woods NF, Waring ME, Lewis CE, Stefanick M. Reproductive history and risk of type 2 diabetes mellitus in postmenopausal women: findings from the Women's Health Initiative. Menopause. 2017;24(1):64-72.
  59. Pandeya N, Huxley RR, Chung HF, Dobson AJ, Kuh D, Hardy R, Cade JE, Greenwood DC, Giles GG, Bruinsma F, Demakakos P, Simonsen MK, Adami HO, Weiderpass E, Mishra GD. Female reproductive history and risk of type 2 diabetes: A prospective analysis of 126 721 women. Diabetes Obes Metab. 2018;20(9):2103-2112.
  60. Verhaegen AA, Van Gaal LF. Drugs That Affect Body Weight, Body Fat Distribution, and Metabolism. In: Feingold KR, Anawalt B, Boyce A, Chrousos G, de Herder WW, Dhatariya K, Dungan K, Hershman JM, Hofland J, Kalra S, Kaltsas G, Koch C, Kopp P, Korbonits M, Kovacs CS, Kuohung W, Laferrere B, Levy M, McGee EA, McLachlan R, Morley JE, New M, Purnell J, Sahay R, Singer F, Sperling MA, Stratakis CA, Trence DL, Wilson DP, eds. Endotext. South Dartmouth (MA)2000.
  61. Infurna FJ, Luthar SS. Resilience to Major Life Stressors Is Not as Common as Thought. Perspect Psychol Sci.2016;11(2):175-194.
  62. Just-Ostergaard E, Mortensen EL, Flensborg-Madsen T. Major life events and risk of alcohol use disorders: a prospective cohort study. Addiction. 2018;113(1):25-33.
  63. Hendrick V, Dasher R, Gitlin M, Parsi M. Minimizing weight gain for patients taking antipsychotic medications: The potential role for early use of metformin. Ann Clin Psychiatry. 2017;29(2):120-124.
  64. Apovian CM, Aronne LJ, Bessesen DH, McDonnell ME, Murad MH, Pagotto U, Ryan DH, Still CD, Endocrine S. Pharmacological management of obesity: an endocrine Society clinical practice guideline. J Clin Endocrinol Metab. 2015;100(2):342-362.
  65. Sumithran P, Prendergast LA, Delbridge E, Purcell K, Shulkes A, Kriketos A, Proietto J. Long-term persistence of hormonal adaptations to weight loss. N Engl J Med. 2011;365(17):1597-1604.
  66. Srivastava G, Buffington C. A Specialized Medical Management Program to Address Post-operative Weight Regain in Bariatric Patients. Obes Surg. 2018.
  67. Garvey WT. Is Obesity or Adiposity-Based Chronic Disease Curable: The Set Point Theory, the Environment, and Second-Generation Medications. Endocr Pract. 2022;28(2):214-222.


Thyrotropin-Secreting Pituitary Adenomas

ABSTRACT


Thyrotropin-secreting pituitary tumors (TSH-omas) are a rare cause of hyperthyroidism and account for less than 1% of all pituitary adenomas. It is, however, noteworthy that the number of reported cases increased over the last few years because of the routine use of ultrasensitive immunometric assays for measuring TSH levels. Contrary to previous RIAs, ultrasensitive TSH assays allow a clear distinction between patients with suppressed and those with non-suppressed circulating TSH concentrations, i.e., between patients with primary hyperthyroidism (Graves’ disease or toxic nodular goiter) and those with central hyperthyroidism (TSH-oma or pituitary resistance to thyroid hormone action, PRTH). Failure to recognize the presence of a TSH-oma may result in dramatic consequences, such as improper thyroid ablation that may cause the pituitary tumor volume to further expand. The presence of neurological signs and symptoms (visual defects, headache) or clinical features of concomitant hypersecretion of other pituitary hormones (acromegaly, galactorrhea/amenorrhea) strongly supports the diagnosis of TSH-oma. Nevertheless, the differential diagnosis between TSH-oma and PRTH may be difficult when the pituitary adenoma is very small, or in the case of confusing lesions, such as an empty sella or pituitary incidentalomas. First-line treatment of TSH-omas is pituitary adenomectomy followed by irradiation in the case of surgical failure. However, medical treatment with long-acting somatostatin analogues, such as octreotide and lanreotide, are effective in reducing TSH secretion in more than 90% of cases with consequent normalization of FT4 and FT3 levels and restoration of the euthyroid state.


INTRODUCTION


Thyrotropin (TSH)-secreting pituitary adenomas (TSH-omas) are a rare cause of hyperthyroidism. In this situation, TSH secretion is autonomous and refractory to the negative feedback of thyroid hormones (inappropriate TSH secretion) and TSH itself is responsible for the hyperstimulation of the thyroid gland and the consequent hypersecretion of T4 and T3 (1, 2). Therefore, this entity can be appropriately classified as a form of "central hyperthyroidism". The first case of TSH-oma was described in 1960 by measuring serum TSH levels with a bioassay (3). In 1970, Hamilton et al. (4) reported the first case of TSH-oma proved by measuring TSH by RIA.


Classically, TSH-omas were diagnosed at the stage of invasive macroadenoma and were considered difficult to cure. However, the advent of ultrasensitive immunometric assays, routinely performed as first line test of thyroid function, has greatly improved the diagnostic workup of hyperthyroid patients, allowing the recognition of the cases with unsuppressed TSH secretion. Therefore, TSH-omas are now more often diagnosed at an earlier stage, before they become a macroadenoma, and an increased number of patients with normal or elevated TSH levels in the presence of high free thyroid hormone concentrations have been recognized. Signs and symptoms of hyperthyroidism along with values of thyroid function tests similar to those found in TSH-oma may be recorded also among patients affected with resistance to thyroid hormones (5-7). This form of resistance to thyroid hormones is called pituitary resistance to thyroid hormones (PRTH), as the resistance to thyroid hormone action appears more severe at the pituitary than at the peripheral tissue level. The clinical importance of these rare entities is based on the diagnostic and therapeutic challenges they present.


Failure to recognize these different diseases may result in dramatic consequences, such as improper thyroid ablation in patients with central hyperthyroidism or unnecessary pituitary surgery in those with PRTH. Conversely, early diagnosis and the correct treatment of TSH-omas may prevent the occurrence of neurological and endocrinological complications, such as visual defects by compression of the optic chiasm, headache, and hypopituitarism, and should improve the rate of cure.


EPIDEMIOLOGY


TSH-producing adenoma is a rare disorder, accounting for about 0.5% to 2% of all pituitary adenomas, the prevalence in the general population being 1 to 2 cases per million (1, 2, 8-69). However, this figure is probably underestimated as confirmed by data obtained from The Swedish Pituitary Registry (70), demonstrating an increased incidence of TSH-omas over time (0.05 per 1 million per year in 1990-1994 to 0.26 per 1 million per year in 2005-2009), the national prevalence in 2010 being 2.8 per 1 million inhabitants. The increased number of reported cases principally results from the introduction of ultrasensitive TSH immunometric assays and from improved general practitioner and endocrinologist awareness. Based on the finding of measurable serum TSH levels in the presence of elevated FT4 and FT3 concentrations, many patients, previously thought to be affected with primary hyperthyroidism (Graves' disease on multinodular goiter), can nowadays be correctly diagnosed as patients with TSH-oma or, alternatively, with PRTH (1, 2, 5-7).


The presence of a TSH-oma has been reported at ages ranging from 8 to 84 years (2, 58, 58a,59), the mean age at diagnosis being 46 ± 6 years (59a). TSH-omas occur with equal frequency in men and women, in contrast with the female predominance seen in other thyroid disorders, a recent structured review of 535 adult cases of adult cases confirmed a female to male ratio of 1.07 (59a) Familial cases of TSH-oma have been reported as part of multiple endocrine neoplasia type 1 (MEN1) syndrome (10) and in familial isolated pituitary adenoma (FIPA) families with an AIP mutation (52).


PATHOLOGICAL ASPECTS


Immunostaining studies showed the presence of TSH beta subunit, either free or combined, in all adenomatous cells from every type of TSH-oma, with only few exceptions (1, 2, 8, 9, 71, 71a). Most TSH-secreting adenomas (72%) are secreting TSH alone, often accompanied by unbalanced hypersecretion of alpha-subunit of glycoprotein hormones (alpha-GSU) (Table 1). Interestingly, the existence of TSH-omas composed of two different cell types, one secreting alpha-GSU alone and another co-secreting alpha-GSU and the entire TSH molecules (mixed TSH/alpha-GSU adenomas), was documented by using double gold particle immunostaining (72). The presence of a mixed TSH/alpha-GSU adenoma is suggested by the finding of an extremely high alpha-GSU/TSH molar ratio and/or by the observation of dissociated TSH and alpha-GSU responses to TRH (1, 72). Classic mixed adenomas characterized by concomitant hypersecretion of other anterior pituitary hormones are found in about 30% of patients.


Table 1. Recorded Cases of TSH-Secreting Adenomas of Different Type


Number 

% of total

Total TSH-secreting adenomas (TSH-omas) 

598

---

Pure TSH-omas 

450

75.2

TSH-omas with associated hypersecretion of other pituitary hormones (mixed TSH-omas) 

148

24.8

Mixed TSH/GH-omas 

90

15.1

Mixed TSH/PRL-omas 

50 

  8.4

Mixed TSH/FSH/LH-omas 

  1.3

(Updated end May 2022 and personal unpublished observations)


Hypersecretion of GH and/or PRL, resulting in acromegaly and/or an amenorrhea/galactorrhea syndrome, are the most frequent associations (59a). This may be due to the fact that somatotroph and lactotroph cells share with thyrotropes common transcription factors, such as Prop-1 and Pit-1 (73). Rare is the occurrence of mixed TSH/gonadotropin adenoma, while no association with ACTH hypersecretion has been documented to date, probably due to the distant origin of corticotrope and thyrotrope lineages. Nonetheless, positive immunohistochemistry for one or more pituitary hormone does not necessarily correlate with its or their hypersecretion in vivo (9, 71, 74). Accordingly, clinically and biochemically silent thyrotropinomas have been reported (9, 75, 76). Moreover, true TSH-secreting tumors associated with Hashimoto’s thyroiditis and hypothyroidism have been documented (2, 39, 77, 78). Finally, an isolated pituitary gangliocytoma producing TSH and TRH has been recently reported (78a).


Microadenomas, with a diameter <1 cm, were recorded in less than 15% of the cases before 1996 (22), but their prevalence among all the TSH-omas is progressively increasing due to improved testing of thyroid function and awareness among endocrinologists and general practitioners. Consistently, in the series recently published by our Institution (79), up to 30% of TSH-omas were microadenomas. In this view, a recent structured review of 533 cases of adult TSH-omas confirmed that 23.1% of them were microadenomas the remaining 76.9% being macroadenoma with a mean diameter of 21.5 ± 7.9 mm (59a). Most TSH-omas had been diagnosed at the stage of macroadenomas and showed localized or diffuse invasiveness into the surrounding structures, especially into the dura mater (1, 8, 15, 22, 71). Extrasellar extension in the supra- and/or parasellar direction were present in the majority of cases. The occurrence of invasive macroadenomas is particularly high among patients with previous thyroid ablation by surgery or radioiodine (Figure 1) (2). This finding emphasizes the deleterious effects of incorrect diagnosis and treatment of these adenomas, and the relevant action on tumor growth exerted by the reduction of circulating thyroid hormone levels through an altered feedback mechanism. Such an aggressive transformation of the tumor resembles that occurring in Nelson's syndrome after adrenalectomy for Cushing's disease. Finally, some data suggest that somatic mutations of the thyroid hormone receptor beta may be responsible for the defect in negative regulation of TSH secretion in some TSH-omas (56, 80-82). In addition, alteration in iodothyronine deiodinase enzyme expression and function may contribute to the resistance of tumor cells to the feedback mechanism of elevated thyroid hormone levels (83). However, these data were not confirmed by another study on this topic (84).

Figure 1. Clinical manifestations in patients with TSH-secreting adenomas. Patients have been divided into two categories according to previous thyroid surgery. The presence of goiter is the rule, even in patients with partial thyroidectomy. Hyperthyroid features may be overshadowed by those of associated hypersecretion/deficiency of other pituitary hormones. Invasive tumors are seen in about half of the patients with previous thyroidectomy and in 1/4 of untreated patients (P<0.01 by Fisher's exact test). Intrasellar tumors show an opposite distribution pattern.

The consistency of TSH-omas is usually very fibrous and sometimes so hard that they deserve the name of "pituitary stone" (85). Increased basic fibroblast growth factor (bFGF) levels were found in blood from two patients with invasive mixed PRL/TSH-secreting adenomas characterized by marked fibrosis (86). The tumoral origin of bFGF was confirmed by the finding of specific transcript in the tissues removed at surgery, suggesting a possible autocrine role for this growth factor in tumor development.


By light microscopy and appropriate staining, adenoma cells usually have a chromophobe appearance. Cells are often organized in cords, and they frequently appear polymorphous and characterized by large nuclei and prominent nucleoli. Ultrastructurally, the well differentiated adenomatous thyrotropes resemble the normal ones, while the poorly differentiated adenomas are composed of elongated angular cells with irregular nuclei, poorly developed RER, long cytoplasmic processes and sparse small secretory granules (50-200 nm) usually lining up along the cell membrane (9, 71). Generally, no exocytosis is detectable. Cells with abnormal morphology or mitoses are occasionally found which may be mistaken for a pituitary malignancy or metastases from distant carcinomas (87). Nevertheless, the transformation of a TSH-oma into a pituitary carcinoma with multiple metastases has seldom been reported (35, 59a, 60, 88). Future malignant behavior might be predicted by the finding of a concomitant, spontaneous and marked decrease of both TSH and alpha-GSU serum concentrations that might indicate that the tumor is becoming less differentiated. Finally, in a mouse model of TSH-oma, the activation of phosphatidyl-inositol 3-kinase promoted aberrant pituitary growth that may induce transformation of the adenoma into a carcinoma (89).


MOLECULAR AND IN VITRO SECRETION STUDIES


The molecular mechanisms leading to the formation of TSH-omas are presently unknown, as is true for the large majority of pituitary adenomas. X-chromosomal inactivation analysis demonstrated that most pituitary adenomas, including the small number of TSH-omas investigated, derive from the clonal expansion of a single initially transformed cell (43). Accordingly, the general principles of tumorigenesis, which assume the presence of a transforming event providing gain of proliferative function followed by secondary mutations or alterations favoring tumor progression, presumably also apply to TSH-omas.


A large number of candidate genes, including common proto-oncogenes and tumor suppressor genes as well as pituitary specific genes, have been screened for mutations able to confer growth advantage to thyrotrope cells. In analogy with the other pituitary adenomas, no mutations in oncogenes commonly activated in human cancer, particularly RAS, have been reported in TSH-omas. In contrast, with GH-secreting adenomas in which the oncogene gsp (GNAS mutation) is frequently present, none of the TSH-oma screened has been shown to express activating mutations of genes encoding for G protein subunits, such as alpha s, alpha q, alpha 11 or alpha i2 (90). Similarly, no mutations in the TRH receptor or dopamine D2 receptor genes (90-91) have been reported in 9 and 3 TSH-omas, respectively, while these tumors were not screened for alterations in protein kinase C, previously identified in some invasive tumors. In consideration of the crucial role that the transcription factor Pit-1 exerts on cell differentiation and PRL, GH and TSH gene expression, the Pit-1 gene has been screened for mutations in 14 TSH-omas and found to be wild-type (2). By contrast, as occurs in GH-omas, Pit-1 was demonstrated to also be overexpressed in TSH-omas, although the proliferative potential of these findings remains to be elucidated (2, 71, 73).


In addition to activating mutations or overexpression of protooncogenes, tumors may originate from the loss of genes with antiproliferative action. As far as the loss of tumor suppressor genes is concerned, no loss of p53 was found in one TSH-oma studied, while the loss of retinoblastoma gene (Rb), which is unaltered in other pituitary adenomas, was not investigated in TSH-omas. Another candidate gene is MEN1 coding for menin. In fact, 3-30% of sporadic pituitary adenomas show loss of heterozygosity (LOH) on 11q13, where MEN1 is located, and LOH on this chromosome seems to be associated with the transition from the non-invasive to the invasive phenotype. A screening study carried out on 13 TSH-omas using polymorphic markers on 11q13 showed LOH in 3, but none of them showed a MEN1mutation after sequence analysis (92). Interestingly, hyperthyroidism due to TSH-omas has been reported in five cases within a familial setting of multiple endocrine neoplasia type 1 syndrome (1, 2, 10). In addition, LOH and in particular polymorphisms at the somatostatin receptor type 5 gene locus, seem to be associated with an aggressive phenotype and resistance to somatostatin analogue treatment (93). Moreover, germline mutations in the aryl hydrocarbon receptor interacting protein (AIP) are known to be involved in sporadic pituitary tumorigenesis, but mutations were found in two patients with TSH-omas (52, 94). Finally, a recent study based on whole-exome sequencing identified several candidate somatic mutations and change in copy numbers in 12 sporadic TSH-omas, but with low number per tumor and without recurrence of mutations (95). A recent publication by Villa and others analyzing a series of secreting and non-secreting pituitary adenomas (including 6 TSH-omas) demonstrated a higher frequency of chromosomal alterations in TSH-omas, these alterations not being related to aggressiveness (95a). The same authors also demonstrated that POU1F1/PIT1-lineage tumors (including TSH-omas) were characterized by a global hypomethylation possibly inducing chromosomal alteration through the activation of transposable elements. Finally, transcriptosome analysis demonstrated that thyrotrope tumors cluster with sparsely granulated somatotroph adenomas and plurihormonal PIT1-positive adenomas, a group characterized by a higher high interferon-α and -γ gene expression (95a).


The extreme refractoriness of neoplastic thyrotropes to the inhibitory action of thyroid hormones indicates mutant forms of thyroid hormone receptors (TR) as other potential candidate oncogenes. Absence of TR alpha1, TR alpha2 and TR beta1 expression was reported in two TSH-omas (82, 96), but aberrant alternative splicing of thyroid hormone receptor beta2 (THRB) mRNA encoding TR beta variant lacking T3 binding activity and other THRB mutations were shown as a mechanism for impaired T3-dependent negative regulation of both TSH and alpha-GSU in tumoral tissue (80, 81). Moreover, an aberrant expression of a novel thyroid hormone receptor β isoform (TRβ4) may partly contribute to the inappropriate secretion of TSH in TSH-omas (56). Several patients with THRB mutation and an PRTH phenotype have been described to bear pituitary lesions at imaging of the sella region, raising diagnostic and therapeutic dilemmas (30, 97-99). The results of dynamic testing of TSH secretion were consistent with PRTH, rather than TSH-omas, indicating that these lesions are likely to be pituitary incidentalomas, whose prevalence in not selected autopsy series reaches 20%.


Pharmacological manipulations in short-term cultures of TSH-omas indicate that these tumors express a large number of functioning receptors. Although in vivo TSH response to TRH is usually absent, several in vitro studies showed either the presence or the absence of TSH response, indicating that the majority of tumors possess TRH receptors (2). Similarly, somatostatin binding experiments indicate that almost all TSH-omas express a variable number of somatostatin receptors, the highest somatostatin-binding site densities being found in mixed GH/TSH adenomas (57, 100, 101). Since somatostatin analogues are highly effective in reducing TSH secretion by neoplastic thyrotropes (12, 13, 102, 103), the inhibitory pathway mediated by somatostatin receptors appears to be largely intact in such adenomas. Consistently, there is a good correlation between somatostatin binding capacity and maximal biological response, as quantified by inhibition of TSH secretion and in vivo restoration of euthyroid state (57, 102-104). The presence of dopamine receptors in TSH-omas was the rationale for therapeutic trials with dopaminergic agonists, such as bromocriptine (57, 105, 106). Several studies have shown a large heterogeneity of TSH responses to dopaminergic agents, either in primary cultures or in vivo (1, 41, 107, 108). The effects of these two inhibitory agents should be nowadays re-evaluated in light of the demonstration of the possible heterodimerization of somatostatin receptor subtype 5 (sst5) and dopamine D2 receptor (109).


CLINICAL FINDINGS


Patients with TSH-omas present with signs and symptoms of hyperthyroidism that are frequently associated with those related to the pressure effects of the pituitary adenomas, causing loss of vision, visual field defects, headache, and/or loss of anterior pituitary function (Figure 1) (22, 49, 63, 110). TSH-omas may occur at any age and, in contrast with the common thyroid disorders, there is no preferential incidence in females (2, 8, 22, 59, 59a). Due to the long history of thyroid dysfunction, many patients had been mistakenly diagnosed as having primary hyperthyroidism (Graves' disease or multinodular goiter), and about one third had inappropriate thyroid ablation by thyroidectomy and/or radioiodine. True coexistence of Graves’ disease and TSH-oma has been reported in 14 cases (54, 111, 111a, 111b). The majority of these cases were females (aged between 25 and 53 years old) and the dual diagnosis was confirmed within 3 years from the original diagnosis in all cases. When Graves’ disease is diagnosed initially, it has been speculated that antithyroid medications may promote the growth of a TSH-oma via the positive feedback system (111c).


Clinical features of hyperthyroidism are present in up to 75% of patients (59a), sometimes milder than expected given the level of thyroid hormones, probably due to their longstanding duration (112). Interestingly, only two cases of TSH-oma complicated with a thyroid storm peri- or post-operatively have been published (112a, 112b). Consistently, several untreated patients with TSH-oma were described as clinically euthyroid (59, 113). Moreover, hyperthyroid features can be overshadowed by those of acromegaly in patients with mixed TSH/GH adenomas (59a, 79, 114-118), thus emphasizing the importance of the systematic measurement of TSH and FT4 in patients with pituitary tumors. Acromegaly itself can often be associated with multinodular goiter, presenting a further possible differential diagnostic scenario.


Cardiotoxicosis with atrial fibrillation, cardiac failure, massive pleural and pericardial effusions have been reported in sporadic cases (119-123). Thyrotoxic heart failure and atrial fibrillation were found to be present in 11.1% of cases (59a). Typical episodes of periodic paralysis have also been described in two patients (20, 124). A high prevalence of radiological vertebral fracture has been recently documented in a series of patients with TSH-omas (125) thus confirming the deleterious effects of thyrotoxicosis on bone health.


The presence of a goiter is the rule, even in the patients with previous partial thyroidectomy, since thyroid residue may regrow as a consequence of TSH hyperstimulation. The occurrence of uni- or multinodular goiter is frequent (about 72% of reported cases), but progression towards functional autonomy seems to be rare (126, 127). The monitoring of the thyroid nodule(s) and the performance of fine needle aspiration biopsy are indicated in TSH-omas since differentiated thyroid carcinomas were documented in several patients (1, 11, 55, 59a, 128-131). A recent publication evaluating sixty-two patients who underwent surgery for TSH-oma demonstrated an estimated incidence of thyroid carcinoma of 4.8%, thus suggesting a possible role of TSH hypersecretion in the development of thyroid tumors (130). The prevalence of circulating antithyroid autoantibodies (anti-thyroglobulin: Tg-Ab, and anti-thyroid peroxidase: TPO-Ab) is similar to that found in the general population, but some patients developed Graves' disease after pituitary surgery and a few others presented bilateral exophthalmos due to autoimmune thyroiditis (2, 55, 132), while unilateral exophthalmos due to orbital invasion by the pituitary tumor has also been reported (3, 133).


Dysfunction of the gonadal axis is not rare, with menstrual disorders present in one third of the reported cases, mainly in the mixed TSH/PRL adenomas. In this respect, a recent report described a case of a 37-year-old woman who had experienced galactorrhea and menstrual disorder and undergone infertility treatment in 1 year before TSH-oma was identified (133a). Central hypogonadism, delayed puberty, and decreased libido were also found in a number of males with TSH-omas and/or mixed TSH/FSH adenomas (1, 107, 134, 135).


Because of suprasellar extension or invasiveness, signs and symptoms of an expanding tumor mass are predominant in many patients. Partial or total hypopituitarism was seen in about 25% of cases, headache reported in 20-25% of patients, and visual field defects are present in about 50% of patients (Figure 1).


BIOCHEMICAL FINDINGS


High concentrations of circulating free thyroid hormones in the presence of detectable TSH levels characterize the hyperthyroidism secondary to TSH-secreting pituitary adenomas. In a review of 533 cases of TSH-omas it has been shown that the median TSH at diagnosis was 6.75 (4.02–11.90) mU/L in the case series and 5.16 (3.20–7.43) mU/L in the case reports whereas FT4 averaged 35.7 ± 8.5 and 41.5 ± 15.3 pmol/L, respectively (59a). Interestingly, normal levels of total T4 were recorded in several patients with TSH-omas despite the presence of clinical signs and symptoms of hyperthyroidism. This observation indicates that the measurement of circulating free thyroid hormones (FT4 and FT3) is mandatory. In fact, these measurements show the highest sensitivity for the correct diagnosis of central hyperthyroidism and prevent misclassification in the case of excess of circulating levels of thyroxine-binding globulin (26). Many different physiological or clinical conditions, such as pregnancy or PRTH, may present with hyperthyroxinemia and detectable serum TSH levels, and should be distinguished from TSH-omas. Most of these conditions may be recognized on the basis of either a patient's clinical history or by measuring the concentrations of FT4 and FT3 with direct "two-step" methods, i.e., the methods able to avoid possible interference due to the contact between serum factors and tracer at the time of the assay (e.g., equilibrium dialysis+RIA, adsorption chromatography+RIA, and back-titration) (136, 137). In fact, some factors may interfere with the measurement of either thyroid hormones or TSH. The presence of anti-iodothyronine autoantibodies (anti-T4 and/or anti-T3) or abnormal albumin/transthyretin forms, such as those circulating in familial dysalbuminemic hyperthyroxinemia, may cause FT4 and/or FT3 to be overestimated, particularly when "one-step" analog methods are employed (137, 138). The more common factors interfering in TSH measurement and giving spuriously high levels of TSH are the circulating heterophilic antibodies, i.e., antibodies directed against mouse gamma-globulins (36, 139).


About 30% of TSH-oma patients with an intact thyroid gland showed TSH levels within the normal range (2). In this respect, it is worth noting that TSH with “reflex FT4 strategy” (i.e., measurement of FT4 test only in the presence of an abnormal TSH result) fails to recognize both central hypo and hyperthyroidism thus leading to TSH deficiency or TSH-oma misdiagnosis (140, 141). The diurnal rhythm is preserved in TSH-omas and TSH secretion shares many characteristics (cross-approximate entropy, cross-correlation and cosinor regression) of other pituitary hormone-secreting adenomas (142). Interestingly, a case of TSH-oma with cyclic fluctuations in serum TSH levels has recently been reported (143).


Furthermore, despite the TSH-dependent origin of hyperthyroidism, there is no direct correlation between free thyroid hormone and immunoreactive TSH levels (Figure 2). An increased biological activity of secreted TSH molecules likely accounts for the finding of normal TSH in the presence of high levels of FT4 and FT3 (114). TSH molecules secreted by pituitary tumors are heterogeneous and may have either a normal, reduced, or increased ratio between their biological and immunological activities, probably due to modification of glycosylation processes secondary to alterations of the post-translational processing of the hormone within the tumor cell (144, 145). Interestingly, TSH levels in patients previously treated with thyroid ablation were 6-fold higher than in untreated patients, though free thyroid hormone levels were still in the hyperthyroid range (115). Moreover, tumoral thyrotropes may undergo more active cellular proliferation in response to even small reductions in circulating thyroid hormone levels, as documented by the higher number of invasive macroadenomas found in previously treated patients (Figure 1), beyond the increase of TSH secretion.

Figure 2. Absent correlation between immunoreactive concentrations of circulating TSH and FT3 in 14 patients with TSH-secreting adenomas. Dotted lines indicate the upper limits of normal ranges for both parameters.

Independently of previous thyroid ablation, circulating free alpha-GSU levels and alpha-GSU/TSH molar ratio were clearly elevated in the majority of patients with TSH-oma, either due to unbalanced secretion of the subunit or to the presence of a mixed TSH/alpha-GSU adenoma (72). The calculation of the alpha-GSU/TSH molar ratio increases the diagnostic sensitivity of hormone measurement, and an alpha-GSU/TSH molar ratio above 1.0 was associated with the presence of a TSH-secreting pituitary adenoma (2, 8). However, data from our group show that the individual values must be compared with those of control groups matched for TSH and gonadotropin levels before drawing any diagnostic conclusions. Controls with normal levels of TSH and gonadotropins may have alpha-GSU/TSH molar ratios as high as 5.7, and values as high as 29.1 can be found in euthyroid postmenopausal women (146). Indeed, hypersecretion of alpha-GSU is not unique to TSH-omas, being present in the majority of true gonadotropinomas, in a subset of non-functioning pituitary adenomas, and in a number of GH- or PRL-secreting tumors. Moreover, high alpha-GSU levels may be observed in conditions other than pituitary adenomas, such as in patients with inflammatory bowel disease (e.g., ulcerative colitis, Crohn disease) or with other neuroendocrine tumors (e.g., carcinoids) (146).


PARAMETERS OF THYROID HORMONE ACTION


Patients with central hyperthyroidism may present with mild signs and symptoms of thyroid hormone overproduction. Therefore, the measurements of several parameters of peripheral thyroid hormone action have been proposed to quantify the degree of tissue hyperthyroidism (2, 5-8, 98). Some of them are measured in vivo (basal metabolic rate, cardiac systolic time intervals, "Achilles" reflex time) and others in vitro (sex hormone-binding globulin: SHBG, cholesterol, angiotensin converting enzyme, soluble interleukin-2 receptor, osteocalcin, carboxyterminal cross-linked telopeptide of type I collagen (ICTP), etc.). Liver (SHBG) and bone parameters (ICTP) have been successfully used to differentiate hyperthyroid patients with TSH-omas from those with pituitary RTH (Figure 3). In fact, as seen in the common forms of hyperthyroidism, patients with TSH-omas have high SHBG and ICTP levels, while they are in the normal range in patients with hyperthyroidism due to PRTH (147, 148).


Figure 3. Values of sex hormone-binding globulin (SHBG) and carboxyterminal cross-linked telopeptide of type 1 collagen (ICTP) in patients with PRTH or TSH-omas. Shaded areas represent the normal ranges either in premenopausal women or in postmenopausal women and men. The combined measurement of parameters from different tissues may be useful for the differential diagnosis and by-pass possible interference by different factors (age, liver or bone diseases, combined alteration of pituitary functions, treatments, etc.). Tx TSH-omas, treated TSH-omas.

DYNAMIC TESTING


Although both stimulatory and inhibitory tests had been proposed for the diagnosis of TSH-omas, none of them is of clear-cut diagnostic value. Classically, T3 suppression test has been used to assess the presence of a TSH-oma. A complete inhibition of TSH secretion after T3 suppression test (80-100 mcg/day for 8-10 days) has never been recorded in patients with TSH-oma. T3 suppression test can be combined with TRH testing, where normal subjects and TSH-oma patients do not show elevation of TSH in response to TRH, while PRTH patients show a brisk elevation (1). In patients with previous thyroid ablation, T3 suppression seems to be the most sensitive and specific test in assessing the presence of a TSH-oma (2, 8, 98). However, this test is strictly contraindicated in elderly patients or in those with coronary heart disease.


TRH testing has been widely used to investigate the presence of a TSH-oma. In the vast majority of patients, TSH and alpha-GSU levels do not increase after TRH injection. In patients with hyperthyroidism, discrepancies between TSH and alpha-GSU responses to TRH (i.e., higher alpha-GSU than TSH response) are pathognomonic of TSH-omas co-secreting other pituitary hormones. Such a discrepancy is also found in an opposite clinical condition, i.e., the congenital hypothyroidism due to a TSH beta gene mutation (149).


The majority of TSH-omas maintain sensitivity to native somatostatin and its analogues. Indeed, administration of native neuropeptide or its analogues (octreotide or lanreotide) induces a reduction of TSH levels in the majority of cases, and these tests may be predictive of the efficacy of long-term treatment (30, 89, 102, 104). Recently, it has been confirmed that a positive somatostatin test result is suggestive for a TSH-oma even before positive findings become apparent on pituitary imaging (104a).


As suggested by ETA 2013 guidelines we recommend the use of both T3 suppression and TRH tests whenever possible, because the combination of their results increases the specificity and sensitivity of the diagnostic work-up (158).


IMAGING STUDIES AND LOCALIZATION OF THE TUMOR


As for other tumors of the region of the sella turcica, nuclear magnetic resonance imaging (MRI) is nowadays the preferred tool for the visualization of a TSH-oma. High-resolution computed tomography (CT) is the alternative investigation in the case of contraindications, such as patients with pacemakers. Most TSH-omas have been diagnosed in the past at the stage of macroadenomas, and various degrees of suprasellar extension or sphenoidal sinus invasion are seen in two thirds of cases.


Microadenomas are now reported with increasing frequency, accounting for about 20-30% of all recorded cases in both clinical and surgical series. Pituitary scintigraphy with radiolabeled octreotide (Octreoscan) has been shown to successfully localize TSH-omas that express somatostatin receptors (8, 150, 151). However, the specificity of the Octreoscan is low, since positive scans can be seen in the case of a pituitary mass of different types, either secreting or non-secreting.


Finally, ectopic localization of a TSH-oma has been reported by different groups who found a nasopharyngeal mass in few patients with clinical and biochemical features of central hyperthyroidism (21, 32, 152-157a). Histological and immunohistochemical studies of both specimens collected during the operation showed unequivocally that the tumor was a TSH-oma, and the resection of the mass restored TSH and alpha-GSU levels to normal. Interestingly, in these cases either Octreoscan or Gallium 68 DOTATATE Positron Emission Tomography/Computed Tomography might be helpful in identifying an ectopic lesion (157a).


DIFFERENTIAL DIAGNOSIS


If FT4 and FT3 concentrations are elevated in the presence of measurable TSH levels, it is important to exclude methodological interference due to the presence of circulating autoantibodies (e.g., against T3 and T4) or heterophilic antibodies (e.g., for TSH). A recent publication by Campi and others indicated assay interference as the main source of error due to the widespread use of high-throughput platforms based on one-step assays that increased the frequency of assay artifact, due to interference from biotin, circulating heterophilic antibodies, or abnormal binding proteins (157b). In this respect, in an asymptomatic patient with elevated FT4/FT3 and detectable TSH levels, the so called Familial dysalbuminemic hyperthyroxinemia should be taken into account. FSH is a familial autosomal dominant condition caused by an abnormal albumin molecule with an increased affinity for serum thyroxine thus leading to a false increase of FT4 and FT3 while TSH levels are normal (138, 157c). In a patient with signs and symptoms of hyperthyroidism, the confirmed presence of elevated FT4/FT3 and detectable TSH levels rules out Graves' disease or other forms of primary hyperthyroidism. In patients on levothyroxine replacement therapy, the finding of measurable TSH in the presence of high FT4/FT3 levels may be due to poor compliance or to an incorrect high L-T4 dosage, probably administered before blood sampling.


When the existence of central hyperthyroidism is confirmed, several diagnostic steps have to be carried out to differentiate a TSH-oma from PRTH (Table 2) (1, 5-8, 30, 97, 98, 158). The presence of neurological signs and symptoms (visual defects, headache) of an expanding intra-cranial mass or clinical feature of concomitant hypersecretion of other pituitary hormones (acromegaly, galactorrhea/amenorrhea) points to the presence of a TSH-oma. The presence of alterations of the pituitary content on MRI or CT scanning strongly supports the diagnosis of a TSH-oma. Nevertheless, the differential diagnosis may be difficult when the pituitary adenoma is very small, or in the case of confusing lesions, such as an empty sella. Moreover, the possibility of pituitary incidentalomas should always be considered, due to their high prevalence. In our series, about 20% of PRTH patients have a pituitary lesion on MRI.


No significant differences in age, sex, previous thyroid ablation, TSH levels or free thyroid hormone concentrations were seen between patients with TSH-oma and those with PRTH. However, in contrast to PRTH patients, familial cases of TSH-oma have never been documented. Serum TSH levels within the normal range are more frequently found in PRTH, while elevated alpha-GSU concentrations and/or a high alpha-GSU/TSH molar ratio are typically present in patients with TSH-omas. Moreover, TSH unresponsiveness to TRH stimulation and/or to T3 suppression tests favors the presence of a TSH-oma. We have shown that chronic administration of long-acting somatostatin analogues in patients with central hyperthyroidism caused a marked decrease of FT3 and FT4 levels in all patients but one with TSH-oma, while patients with PRTH did not respond at all (30). Thus, administration of long-acting somatostatin analogues for at least 2 months can be useful in the differential diagnosis in problematic cases of central hyperthyroidism (30, 157b) (Table 2).


Indexes of thyroid hormone action at the tissue level (such as SHBG or ICTP levels) are in the hyperthyroid range in most patients with TSH-oma, while they are generally normal/low in PRTH (Figure 3). Exceptions are the findings of normal SHBG levels in patients with mixed GH/TSH adenoma, due to the inhibitory action of GH on SHBG synthesis and secretion, and of high SHBG in PRTH patients treated with estrogens or showing profound hypogonadism. Genetic analysis of the TR beta gene may be useful in the differential diagnosis, as TR beta mutations in leukocyte DNA have been found only in patients with PRTH (Table 2).


Table 2. Differential Diagnosis Between TSH-Secreting Adenomas (TSH-omas) and Resistance to Thyroid Hormones (RTH).

Parameter

TSH-omas

RTH

P

Female/Male ratio 

1.3 

1.4 

NS

Familial cases 

0 % 

85 % 

<0.0001

TSH mU/L 

3.0 ±0.4 

2.3 ±0.3

NS

FT4 pmol/L 

38.8 ±3.9 

29.9 ±2.3 

NS

FT3 pmol/L 

14.0 ±1.2 

11.3 ±0.8 

NS

Lesions at CT or MRI 

99 % 

23 % 

<0.0001

Germline THRB mutation

0%

84%

<0.0001

High biological activity of circulating serum TSH

38%

90%

NS

High alpha-GSU levels 

69 % 

3 % 

<0.0001

High alpha-GSU/TSH molar ratio 

81 % 

2 % 

<0.0001

Elevated SHBG and/or ICTP

90%

8% 

<0.0001

Blunted TSH response to TRH test (cutoff <3 mU/L in males and <5 mU/L in females)

87 % 

2 % 

<0.0001

Abnormal TSH response to T3 suppressiona

100 % 

100 %

NS

FT4/FT3 reduction/normalization during long-acting somatostatin analogc

92%

0%

<0.0001

a Werner's test (80-100 µg T3 for 8-10 days). Quantitatively normal responses to T3, i.e., complete inhibition of both basal and TRH-stimulated TSH levels, have never been recorded in either group of patients.

b Although abnormal in quantitative terms, TSH response to T3 suppression test was qualitatively normal in 45/47 PRTH patients.

c Two or more injections of somatostatin analogues (e.g., Octreotide-LAR 20-30 mg every month or Lanreotide Autogel 120 mg every 6-8 weeks)

Only patients with intact thyroid were taken into account. Data are obtained from patients followed at our department and are expressed as mean ± SE.


TREATMENT AND OUTCOME


As stated in 2013 guideline by European Thyroid Association (158), surgical resection is the recommended therapy for TSH-secreting pituitary tumors, with the aim of removing neoplastic tissue and restoring normal pituitary/thyroid function. However, radical removal of large tumors, that still represent the majority of TSH-omas, is particularly difficult because of the marked fibrosis of these tumors and the local invasion involving the cavernous sinus, internal carotid artery, or optic chiasm. Considering this high invasiveness, surgical removal or debulking of the tumor by transsphenoidal or subfrontal adenomectomy, depending on the tumor volume and its suprasellar extension, should be undertaken as soon as possible (158a). According to the review of 535 cases of TSH-omas by De Herdt and others, surgical resection of the adenoma was performed in 87.7% of patients of which 33.5% had residual pituitary adenoma (59a). Particular attention has to be paid to presurgical preparation of the patient, particularly in the preanesthetic period (159): antithyroid drugs or octreotide along with propranolol should be used, aiming at restoration of euthyroidism. In patients with very severe hyperthyroidism, the administration of iopanoic acid may be successfully employed (25). Though the preoperative treatment with somatostatin analogues may be useful to reduce hyperthyroid signs and symptoms in a significant number of patients, as well as the adenoma size (160-161a), no correlations between FT4/FT3 normalization and a higher rate of remission has been demonstrated (68). However, a recent multicenter, single-arm, phase 3 study in Japan confirmed in a series of TSH-omas that preoperative lanreotide autogel treatment was effective in normalizing thyroid function in 10/13 patients and to induce a -23.8% median percent change in pituitary tumor size from baseline at final assessment (161b). Finally, a single report on the efficacy of pasireotide in the pre-operative treatment of a TSH-omas has been so far published (161c).


It is worth noting that somatostatin analogues may lead to a condition of TSH deficiency. In this respect, in the series published by Illouz and others TSH deficiency appeared in 15% of 46 treated TSH-omas after a median time of 4 weeks, the TSH deficiency occurring after one to three injections of long-acting somatostatin analogues (161d). These data suggest that thyrotropic function should be reassessed after the first three injections of somatostatin analogues in order to diagnose TSH deficiency and to reduce the frequency of injections when control of thyrotoxicosis is the aim of the treatment.


After surgery, partial or complete hypopituitarism may result (162, 163). However, a case of thyroid storm after pituitary surgery was documented (164). Evaluation of pituitary function, particularly ACTH secretion, should be carefully undertaken soon after surgery and hormone replacement therapy initiated, if needed. In case of failure of pituitary surgery and in the presence of life-threatening hyperthyroidism, total thyroidectomy or thyroid ablation with radioiodine is indicated (165).


According to the largest published series, pituitary surgery is effective in restoring euthyroidism in 75% to 83% of patients with TSH-omas (61, 79, 165a) and a recent metanalysis by Cossu and others showed that the pooled rate of postoperative biochemical remission was 69.7% and a gross total resection was observed in 54% of patients. As expected, the extent of resection was significantly increased in microadenomas and cavernous sinus invasion was predictive of lower gross total resection (68).


If pituitary surgery is contraindicated or declined, as well as in the case of surgical failure, pituitary radiotherapy and/or medical treatment with somatostatin analogues (octreotide or lanretotide) are valid alternatives (158). In the case of radiotherapy, the recommended dose is no less than 45 Gy fractionated at 2 Gy per day or 10-25 Gy in a single dose if a stereotactic gamma knife is available (158, 166). Radiotherapy and radiosurgery are effective in normalizing thyroid function in 37% of patients within 2 years (79). The successful experience of an invasive TSH-oma associated with an unruptured aneurysm treated by two-stage operation and gamma knife has been reported (167). Although earlier diagnosis has improved the surgical cure rate of TSH-omas, several patients have required medical therapy in order to control the hyperthyroidism. Dopamine agonists, and particularly cabergoline, have been employed in some TSH-omas with variable results, positive effects being mainly observed in some patients with mixed PRL/TSH adenoma (121, 168, 169). Today, the medical treatment of TSH-omas relies on long-acting somatostatin analogues, such as octreotide or lanreotide (12, 13, 85, 158, 170-172). Indeed, many papers suggest the use of somatostatin analogues as first-line therapy for patients with TSH-omas, particularly for invasive macroadenomas (173-176). Treatment with these analogues lead to a reduction of TSH and alpha-GSU secretion in almost all cases, with restoration of the euthyroid state in the majority of them and it is safe even during pregnancy (18, 24, 177, 178). In some cases, inhibition of tumoral TSH secretion may be so profound that hypothyroidism may even be seen. During somatostatin analogues therapy tumor shrinkage occurs in about 50% of patients and vision improvement is seen in 75% (61, 79, 179). Very rapid shrinkage of the tumor has been described (34). Resistance to octreotide treatment has been documented in a few cases. Patients on somatostatin analogues have to be carefully monitored, as untoward side effects, such as cholelithiasis and carbohydrate intolerance, may become manifest. The dose administered should be tailored for each patient, depending on therapeutic response. Tolerance is usually very good, as gastrointestinal side effects are transient with long-acting analogues (12, 13, 57, 179, 180). As a whole, post-operative treatment with a somatostatin analogue induces a biochemical remission in 76% of patients (68) and led to a stable disease in 81.3% of the cases with residual tumor (59a).


CRITERIA OF CURE AND FOLLOW-UP


Due to the rarity of the disease and the great heterogeneity of the methods used, the criteria of cure of patients operated or irradiated for TSH-omas has not been clearly established. Previous thyroid ablation makes some of these criteria inapplicable (Table 3).


Table 3. Criteria for the Evaluation of the Outcome of Treatment

Criteria 

Comments

Remission from hyperthyroid

 manifestations (clinical and biochemical) 

Clinical improvement may be transient

No predictive value

Disappearance of neurological

 manifestations (adenoma imaging,

visual field defects, headache) 

May be transient

Poor predictive value

Normalization of free thyroid hormone levels 

Biochemical remission may be transient

Poor predictive value

Normalization of circulating TSH levels

Not applicable to patients with normal TSH

Poor predictive value

Undetectable TSH one week after

neurosurgery

Applicable to hyperthyroid patients that stopped treatments at least 10 days before surgery

Good prognostic value

Normalization of alpha-GSU levels and

alpha-GSU/TSH molar ratio 

Not applicable to patients with normal values before neurosurgery

Lack of sensitivity

Positive T3-suppression test with

 undetectable TSH and no response to TRH (or central hypothyroidism) 

Not applicable to elderly patients or in

 those with cardiac diseases

Optimal sensitivity/specificity and predictive

 value


In untreated hyperthyroid patients, it is reasonable to assume that cured patients have clinical and biochemical reversal of thyroid hyperfunction. However, the findings of normal free thyroid hormone concentrations or indices of peripheral thyroid hormone action (SHBG, ICTP, etc.) are not synonymous with complete removal or destruction of tumoral cells, since transient clinical remission accompanied by normalization of thyroid function is possible (62, 63, 67, 98, 115). Disappearance of neurological signs and symptoms is a good prognostic event, but lacks both sensitivity and specificity, as even an incomplete debulking of the tumor may cause visual field defects and headache to vanish. The resolution of specific neuroradiological abnormalities is confusing, since the pituitary imaging performed soon after surgery is often difficult to interpret. The criteria of normalization of circulating TSH are not applicable to previously thyroidectomized patients and to the 26% of patients with normal basal values of TSH. In our experience, undetectable TSH levels one week after surgery are likely to indicate complete adenomectomy, provided that the patient was hyperthyroid and presurgical treatments were stopped before surgery (115). A recent publication from a Korean group analyzing the outcome of adenomectomy in a series of 31 TSH-omas found that immediate postoperative TSH level at 12 hours after surgery was the strongest predictor of cure, with a 0.62 μIU/mL cutoff (165a). Normalization of alpha-GSU and/or the alpha-GSU/TSH molar ratio is in general a good index for the evaluation of therapy efficacy (8, 115). However, both parameters are characterized by less-than-optimal sensitivity, as they are normal in about 25% of patients with TSH-oma. The most sensitive and specific test to document the complete removal of the adenoma remains, in the absence of contraindication, the T3 suppression test (115). In fact, only patients in whom T3 administration completely inhibits basal and TRH-stimulated TSH secretion, appear to be truly cured.


Few data on the recurrence rates of TSH-oma in patients judged cured after surgery or radiotherapy have been reported. However, the recurrence of the adenoma does not appear to be frequent, at least in the first years after successful surgery (62, 115). In general, the patient should be evaluated clinically and biochemically 2 or 3 times the first year postoperatively, and then every year. Pituitary imaging should be performed every two or three years but should be promptly done whenever an increase in TSH and thyroid hormone levels, or clinical symptoms occur. In the case of a persistent macroadenoma, close visual field follow-up is required, as visual function could be threatened. Emergency surgical decompression is not always able to reverse even a recent visual deficit.


REFERENCES


  1. Beck-Peccoz P, Brucker-Davis F, Persani L, Smallridge RC, Weintraub BD. Thyrotropin-secreting pituitary tumors. Endocr Rev 1996; 17:610-638.
  2. Beck-Peccoz P, Lania A, Persani L. TSH-producing adenomas: in Endocrinology, Adult and Pediatric (7th Edition, vol. I), edited by Jameson LJ and DeGroot LJ. Sauderns Elsevier, Philadelphia, PA, 2015 pp.266-274.
  3. Jailer JW, Holub DA. Remission of Graves' disease following radiotherapy of a pituitary neoplasm. Am J Med 1960; 28:497-500.
  4. Hamilton C, Adams LC, Maloof F Hyperthyroidism due to thyrotropin-producing pituitary chromophobe adenoma. N Engl J Med 1970; 283:1077-1080.
  5. Refetoff S., Dumitrescu AM. Impaired sensitivity to thyroid hormone: defects of transport, metabolism and action, 2010 https://www.thyroidmanager.org/chapter/thyroid-hormone-resistance-syndromes/
  6. Gurnell M, Visser TJ, Beck-Peccoz P, Chatterjee VKK. Resistance to Thyroid Hormone: in Endocrinology, Adult and Pediatric (7th Edition, vol. II), edited by Jameson LJ and DeGroot LJ. Sauderns Elsevier, Philadelphia, PA, 2015 pp. 1648-1665.
  7. Hannoush ZC, Weiss RE. Defects of Thyroid Hormone Synthesis and Action. Endocrinol Metab Clin North Am. 2017;46:375-388.
  8. Brucker-Davis F, Oldfield EH, Skarulis MC, Doppman JL, Weintraub BD. Thyrotropin-secreting pituitary tumors: diagnostic criteria, thyroid hormone sensitivity, and treatment outcome in 25 patients followed at the National Institutes of Health. J Clin Endocrinol Metab 1999; 84: 476-486.
  9. Bertholon-Grégoire M, Trouillas J, Guigard MP, Loras B, Tourniaire J. Mono- and plurihormonal thyrotropic pituitary adenomas: pathological, hormonal and clinical studies in 12 patients. Eur J Endocrinol 1999; 140: 519-527.
  10. Taylor TJ, Donlon SS, Bale AE, Smallridge RC, Francis TB, Christensen RS, Burma KD. Treatment of a thyrotropinoma with octreotide-LAR in a patient with multiple endocrine neoplasia-1. Thyroid 2000; 10: 1001-1007.
  11. Kishida M, Otsuka F, Kataoka H, Yokota K, Oishi T, Yamauchi T, Doihara H, Tamiya T, Mimura Y, Ogura T, Makino H. Hyperthyroidism in a patient with TSH-producing pituitary adenoma coexisting with thyroid papillary adenocarcinoma. Endocr J 2000; 47:731-738.
  12. Kuhn JM, Arlot S, Lefebvre H; Caron P, Cortet-Rudelli C, Archambaud F, Chanson P, Tabarin A, Goth MI, Blumberg J, Catus F, Ispas S, Beck-Peccoz P. Evaluation of the treatment of thyrotropin-secreting pituitary adenomas with a slow release formulation of the somatostatin analog lanreotide. J Clin Endocrinol Metab 2000; 85:1487-1491.
  13. Caron P, Arlot S, Bauters C, Chanson P, Kuhn JM, Pugeat M, Marechaud R, Teutsch C, Vidal E, Sassano P. Efficacy of the long-acting octreotide formulation (octreotide-LAR) in patients with thyrotropin-secreting pituitary adenomas. J Clin Endocrinol Metab 2001; 86:2849-2853.
  14. Sunthornthepvarakul T, Prachasilchai P, Komindr A, Ngowngarmaratana S, Dansirikul R. A case of thyrotropin-secreting pituitary macroadenoma. J Med Assoc Thai 2001; 84: 897-906.
  15. Kon YC, Loh KC, Tambyah JA, Lim LH, Marshall JC. Thyrotropin (TSH)-secreting pituitary macroadenoma with cavernous sinus invasion. Singapore Med J 2001; 42: 433-439.
  16. Garcia Lafuente N, Berna Gascon MT, Pujalte Lopez E, Falco Jover G, Dominguez Escribano JR. Response of thyrotropinoma to somatostatin analogues: report of a case. Ann Med Interna 2001; 18: 663.
  17. Tella OI jr, Herculano MA, Delcello R, Prandini MN. TSH pituitary adenoma: case report. Arq Neuropsiquiatr 2002; 60:129-132.
  18. Blackhurst G, Strachan MW, Collie D, Gregor A, Statham PF, Seckl JE. The treatment of a thyrotropin-secreting pituitary macroadenoma with octreotide in twin pregnancy. Clin Endocrinol (Oxf). 2002;57:401-404.
  19. Kuo CS, Ho DM, Yang AH, Lin HD. Thyrotropin-secreting pituitary adenoma with growth hormone hypersecretion. Zhonghua Yi Xue Za Zhi (Taipei). 2002;65:489-493.
  20. Hsu FS, Tsai WS, Chau T, Chen HH, Chen YC, Lin SH. Thyrotropin-secreting pituitary adenoma presenting as hypokalemic periodic paralysis. Am J Med Sci. 2003;325:48-50.
  21. Pasquini E, Faustini-Fustini M, Sciarretta V, Saggese D, Roncaroli F, Serra D, Frank G. Ectopic TSH-secreting pituitary adenoma of the vomerosphenoidal junction. Eur J Endocrinol. 2003; 148: 253-257.
  22. Socin HV, Chanson P, Delemer B, Tabarin A, Rohmer V, Mockel J, Stevenaert A, Beckers A. The changing spectrum of TSH-secreting pituitary adenomas: diagnosis and management in 43 patients. Eur J Endocrinol. 2003; 148: 433-442.
  23. Wu YY, Chang HY, Lin JD, Chen KW, Huang YY, Jung SM. Clinical characteristics of patients with thyrotropin-secreting pituitary adenoma. J Formos Med Assoc. 2003; 102: 164-171.
  24. Chaiamnuay S, Moster M, Katz MR, Kim YN. Successful management of a pregnant woman with a TSH secreting pituitary adenoma with surgical and medical therapy. Pituitary. 2003;6:109-113.
  25. Dhillon KS, Cohan P, Kelly DF, Darwin CH, Iyer KV, Chopra IJ. Treatment of hyperthyroidism associated with thyrotropin-secreting pituitary adenomas with iopanoic acid. J Clin Endocrinol Metab. 2004; 89 :708-711.
  26. Soubhi Nizam M, Kennedy L. Co-occurrence of thyroid binding globulin excess and a pituitary macroadenoma containing thyroid stimulating hormone-producing cells. Postgrad Med J. 2004;80:114-115.
  27. Hubalewska-Hola A, Fross K, Kostecka-Matyja M, Sowa-Staszczak A, Szybinski Z, Huszno B, Ptak M. Macro- and microadenoma of thyrotropin secreting pituitary tumors--two clinical cases. Przegl Lek. 2003; 60: 768-171.
  28. Teramoto A, Sanno N, Tahara S, Osamura YR. Pathological study of thyrotropin-secreting pituitary adenoma: plurihormonality and medical treatment. Acta Neuropathol (Berl). 2004; 108: 147-153.
  29. Yang D, Tao W, Liu TH, Wei SZ. Thyrotropin-secreting pituitary adenoma:a clinicopathological analysis of seven cases. Zhonghua Bing Li Xue Za Zhi. 2004; 33: 208-211.
  30. Mannavola D, Persani L, Vannucchi G, Zanardelli M, Fugazzola L, Verga U, Facchetti M, Beck-Peccoz P. Different responses to chronic somatostatin analogues in patients with central hyperthyroidism. Clin Endocrinol (Oxf). 2005; 62: 176-181.
  31. Del Monte P, Bernasconi D, Ruelle A, Marugo A, Marugo M, Torre R. Effect of long-term treatment with octreotide-lar in a TSH-secreting pituitary macroadenoma and secondary hyperthyroidism. Minerva Endocrinol. 2005; 30: 95-99.
  32. Collie RB, Collie MJ. Extracranial thyroid-stimulating hormone-secreting ectopic pituitary adenoma of the nasopharynx. Otolaryngol Head Neck Surg. 2005; 133: 453-454.
  33. Usui T, Izawa S, Sano T, Tagami T, Nagata D, Shimatsu A, Takahashi JA, Naruse M. Clinical and molecular features of a TSH-secreting pituitary microadenoma. Pituitary. 2005; 8: 127-134.
  34. Atkinson JL, Abboud CF, Lane JI. Dramatic volume reduction of a large GH/TSH secreting pituitary tumor with short term Octreotide therapy. Pituitary. 2005; 8: 89-91.
  35. Brown RL, Muzzafar T, Wollman R, Weiss RE. A pituitary carcinoma secreting TSH and prolactin: a non-secreting adenoma gone awry. Eur J Endocrinol. 2006 May;154(5):639-43.
  36. Tan MJ, Tan F, Hawkins R, Cheah WK, Mukherjee JJ. A hyperthyroid patient with measurable thyroid-stimulating hormone concentration - a trap for the unwary. Ann Acad Med Singapore. 2006; 35: 500-503.
  37. Meas T, Sobngwi E, Vexiau P, Boudou P. An unusual somatotropin and thyreotropin secreting pituitary adenoma efficiently controlled by Octreotide and Pegvisomant. Ann Endocrinol (Paris). 2006; 67: 249-52.
  38. Gołkowski F, Buziak-Bereza M, Stefańska A, Trofimiuk M, Pantofliński J, Huszno B, Czepko R, Adamek D. A case of GH and TSH secreting pituitary macroadenoma. Przegl Lek. 2006; 63: 106-108.
  39. Losa M, Mortini P, Minelli R, Giovanelli M. Coexistence of TSH-secreting pituitary adenoma and autoimmune hypothyroidism. J Endocrinol Invest. 2006; 29 : 555-559.
  40. Kienitz T, Quinkler M, Strasburger CJ, Ventz M. Long-term management in five cases of TSH-secreting pituitary adenomas: a single center study and review of the literature. Eur J Endocrinol. 2007; 157: 39-46.
  41. Foppiani L, Del Monte P, Ruelle A, Bandelloni R, Quilici P, Bernasconi D. TSH-secreting adenomas: rare pituitary tumors with multifaceted clinical and biological features. J Endocrinol Invest. 2007; 30: 603-609.
  42. Ness-Abramof R, Ishay A, Harel G, Sylvetzky N, Baron E, Greenman Y, Shimon I. TSH-secreting pituitary adenomas: follow-up of 11 cases and review of the literature. Pituitary. 2007;10: 307-310.
  43. Chien WM, Garrison K, Caufield E, Orthel J, Dill J, Fero ML. Differential gene expression of p27Kip1 and Rb knockout pituitary tumors associated with altered growth and angiogenesis. Cell Cycle. 2007; 6: 750-757.
  44. Losa M, Fortunato M, Molteni L, Peretti E, Mortini P. Thyrotropin-secreting pituitary adenomas: biological and molecular features, diagnosis and therapy. Minerva Endocrinol. 2008; 33: 329-340.
  45. Clarke MJ, Erickson D, Castro MR, Atkinson JL. Thyroid-stimulating hormone pituitary adenomas. J Neurosurg. 2008; 109: 17-22.
  46. Caron P. Thyrotropin-secreting pituitary adenomas. Presse Med. 2009; 38: 107-111.
  47. Macchia E, Gasperi M, Lombardi M, Morselli L, Pinchera A, Acerbi G, Rossi G, Martino E. Clinical aspects and therapeutic outcome in thyrotropin-secreting pituitary adenomas: a single center experience. J Endocrinol Invest. 2009; 32: 773-779.
  48. Duarte FH, Jallad RS, Salgado LR, Bronstein MD. TSH-secreting pituitary tumors: two case reports and literature review. Arq Bras Endocrinol Metabol. 2009; 53: 1157-1166.
  49. Elston MS, Conaglen JV. Clinical and biochemical characteristics of patients with TSH-secreting pituitary adenomas from one New Zealand centre. Intern Med J. 2009; 40: 214-9.
  50. Marucci G, Faustini-Fustini M, Righi A, Pasquini E, Frank G, Agati R, Foschini MP. Thyrotropin-secreting pituitary tumors: significance of "atypical adenomas" in a series of 10 patients and association with Hashimoto thyroiditis as a cause of delay in diagnosis. J Clin Pathol. 2009; 62: 455-459.
  51. Latrech H, Rousseau A, Le Marois E, Billaud L, Bertagna X, Azzoug S, Raffin-Sanson ML. Manifestations and prognosis of thyrotropin-secreting pituitary adenomas: a case series of three patients. Rev Med Interne. 2010; 31: 858-862.
  52. Daly AF, Tichomirowa MA, Petrossians P, Heliövaara E, Jaffrain-Rea ML, Barlier A, Naves LA, Ebeling T, Karhu A, Raappana A, Cazabat L, De Menis E, Montañana CF, Raverot G, Weil RJ, Sane T, Maiter D, Neggers S, Yaneva M, Tabarin A, Verrua E, Eloranta E, Murat A, Vierimaa O, Salmela PI, Emy P, Toledo RA, Sabaté MI, Villa C, Popelier M, Salvatori R, Jennings J, Longás AF, Labarta Aizpún JI, Georgitsi M, Paschke R, Ronchi C, Valimaki M, Saloranta C, De Herder W, Cozzi R, Guitelman M, Magri F, Lagonigro MS, Halaby G, Corman V, Hagelstein MT, Vanbellinghen JF, Barra GB, Gimenez-Roqueplo AP, Cameron FJ, Borson-Chazot F, Holdaway I, Toledo SP, Stalla GK, Spada A, Zacharieva S, Bertherat J, Brue T, Bours V, Chanson P, Aaltonen LA, Beckers A.Clinical characteristics and therapeutic responses in patients with germ-line AIP mutations and pituitary adenomas: an international collaborative study. J Clin Endocrinol Metab. 2010; 95: E373-E383.
  53. Raappana A, Koivukangas J, Ebeling T, Pirilä T. Incidence of pituitary adenomas in Northern Finland in 1992-2007. J Clin Endocrinol Metab. 2010; 95: 4268-4275.
  54. Lee MT, Wang CY. Concomitant Graves hyperthyroidism with thyrotrophin-secreting pituitary adenoma. South Med J. 2010; 103: 347-349.
  55. Nguyen HD, Galitz MS, Mai VQ, Clyde PW, Glister BC, Shakir MK. Management of coexisting thyrotropin/growth-hormone-secreting pituitary adenoma and papillary thyroid carcinoma: a therapeutic challenge. Thyroid. 2010; 20: 99-103.
  56. Tagami T, Usui T, Shimatsu A, Beniko M, Yamamoto H, Moriyama K, Naruse M. Aberrant expression of thyroid hormone receptor beta isoform may cause inappropriate secretion of TSH in a TSH-secreting pituitary adenoma. J Clin Endocrinol Metab. 2011; 96: E948-E952.
  57. Gatto F, Barbieri F, Gatti M, Wurth R, Schulz S, Ravetti JL, Zona G, Culler MD, Saveanu A, Giusti M, Minuto F, Hofland LJ, Ferone D, Florio T. Balance between somatostatin and D2 receptor expression drives TSH-secreting adenoma response to somatostatin analogues and dopastatins. Clin Endocrinol (Oxf). 2012; 76: 407-414.
  58. Nakayama Y, Jinguji S, Kumakura S, Nagasaki K, Natsumeda M, Yoneoka Y, Saito T, Fujii Y. Thyroid-stimulating hormone (thyrotropin)-secretion pituitary adenoma in an 8-year-old boy: case report. Pituitary. 2012; 15: 110-115.

58a.     Yang Y, Liu J, Deng K, Lu L, Zhu H, Lian X, Bao X, Duan L, Yao Y. Clinical and Therapeutic Characteristics of Pituitary TSH-Secreting Adenoma in Adolescent-Onset Patients: Six Case Studies and Literature Review. Front Endocrinol (Lausanne). 2021; 12:771673.

  1. Rabbiosi S, Peroni E, Tronconi GM, Chiumello G, Losa M, Weber G. Asymptomatic thyrotropin-secreting pituitary macroadenoma in a 13-year-old girl: successful first-line treatment with somatostatin analogues. Thyroid. 2012; 22: 1076-1079.

59a.     De Herdt C, Philipse E, De Block C. ENDOCRINE TUMORS: Thyrotropin-secreting pituitary adenoma: a structured review of 535 adult cases. Eur J Endocrinol. 2021; 185(2):R65-R74.

  1. Lee W, Cheung AS, Freilich R. TSH-secreting pituitary carcinoma with intrathecal drop metastases. Clin Endocrinol (Oxf). 2012; 76: 604-606.
  2. Yamada S, Fukuhara N, Horiguchi K, Yamaguchi-Okada M, Nishioka H, Takeshita A, Takeuchi Y, Ito J, Inoshita N. Clinicopathological characteristics and therapeutic outcomes in thyrotropin-secreting pituitary adenomas: a single-center study of 90 cases. J Neurosurg. 2014; 121: 1462-1473.
  3. Kirkman MA, Jaunmuktane Z, Brandner S, Khan AA, Powell M, Baldeweg SE. Active and silent thyroid-stimulating hormone-expressing pituitary adenomas: presenting symptoms, treatment, outcomes, and recurrence. World Neurosurg. 2014; 82: 1224-1231.
  4. van Varsseveld NC, Bisschop PH, Biermasz NR, Pereira AM, Fliers E, Drent ML. A long-term follow-up study of eighteen patients with thyrotrophin-secreting pituitary adenomas. Clin Endocrinol (Oxf). 2014; 80: 395-402.
  5. Azzalin A, Appin CL, Schniederjan MJ, Constantin T, Ritchie JC, Veledar E, Oyesiku NM, Ioachimescu AG. Comprehensive evaluation of thyrotropinomas: single-center 20-year experience. Pituitary. 2016; 19: 183-193.
  6. Astaf'eva LI, Kadashev BA, Shishkina LV, Kalinin PL, Fomichev DV, Kutin MA, Aref'eva IA, Dzeranova LK, Sidneva YG, Klochkova IS, Rotin DL. Clinical and morphological characteristics, diagnostic criteria, and outcomes of surgical treatment of TSH-secreting pituitary adenomas. Zh Vopr Neirokhir Im N N Burdenko. 2016; 80: 24-35.
  7. Tjörnstrand A, Nyström HF. DIAGNOSIS OF ENDOCRINE DISEASE: Diagnostic approach to TSH-producing pituitary adenoma. Eur J Endocrinol. 2017; 177: R183-R197.
  8. Nazato DM, Abucham J. Diagnosis and treatment of TSH-secreting adenomas: review of a longtime experience in a reference center. J Endocrinol Invest. 2018; 41: 447-454.
  9. Cossu G, Daniel RT, Pierzchala K, Berhouma M, Pitteloud N, Lamine F, Colao A, Messerer M. Thyrotropin-secreting pituitary adenomas: a systematic review and meta-analysis of postoperative outcomes and management. Pituitary. 2019 Feb;22(1):79-88.
  10. Asioli S, Righi A, Iommi M, Baldovini C, Ambrosi F, Guaraldi F, Zoli M, Mazzatenta D, Faustini-Fustini M, Rucci P, Giannini C, Foschini MP. Validation of a clinico-pathological score for the prediction of post-surgical evolution of pituitary adenoma: retrospective analysis on 566 patients from a tertiary care centre. Eur J Endocrinol. Eur J Endocrinol. 2019 Feb 1;180(2):127-134
  11. Önnestam L, Berinder K, Burman P, Dahlqvist P, Engström BE, Wahlberg J, Filipsson Nyström H. National incidence and prevalence of TSH-secreting pituitary adenomas in Sweden. J Clin Endocrinol Metab. 2013; 98: 626-635.
  12. Sanno N, Teramoto A, Osamura RY. Thyrotropin-secreting pituitary adenomas. Clinical and biological heterogeneity and current treatment. J Neurooncol 2001; 54: 179-186.

71a.     Căpraru OM, Gaillard C, Vasiljevic A, Lasolle H, Borson-Chazot F, Raverot V, Jouanneau E, Trouillas J, Raverot G. Diagnosis, pathology, and management of TSH-secreting pituitary tumors. A single-center retrospective study of 20 patients from 1981 to 2014. 2019 Ann Endocrinol (Paris). 80(4):216-224.

  1. Terzolo M, Orlandi F, Bassetti M, Medri G, Paccotti P, Cortelazzi D, Angeli A, Beck-Peccoz P. Hyperthyroidism due to a pituitary adenoma composed of two different cell types, one secreting alpha-subunit alone and another cosecreting alpha-subunit and thyrotropin. J Clin Endocrinol Metab 1991; 72:415-421.
  2. Pereira BD, Raimundo L, Mete O, Oliveira A, Portugal J, Asa SL. Monomorphous plurihormonal pituitary adenoma of Pit-1 lineage in a giant adolescent with central hyperthyroidism. Endocr Pathol. 2016; 27: 25-33.
  3. Berker D, Isik S, Aydin Y, Tutuncu Y, Akdemir G, Ozcan HN, Guler S. Thyrotropin secreting pituitary adenoma accompanying a silent somatotropinoma. Turk Neurosurg. 2011; 21: 403-407.
  4. Banerjee AK, Sharma BS, Kak VK. Clinically and biochemically silent thyrotrope adenoma with oncocytic change. Neurol India 2000; 48: 374-377.
  5. Pawlikowski M, Pisarek H, Jaranowska M, Radek M, Winczyk K, Kunert-Radek J. "Silent" thyrotropin (TSH) expression in acromegaly and clinicallynon-functioning pituitary adenomas. Endokrynol Pol. 2016; 67: 515-518.
  6. Iskandar SB, Supit E, Jordan RM, Peiris AN. Thyrotropin-secreting pituitary tumor and Hashimoto's disease: a novel association. South Med J. 2003; 96: 933-936.
  7. Ma W, Ikeda H, Watabe N, Kanno M, Yoshimoto T. A plurihormonal TSH-producing pituitary tumor of monoclonal origin in a patient with hypothyroidism. Horm Res. 2003; 59: 257-261. 78

78a.     Sakata K, Fujimori K, Komaki S, Furuta T, Sugita Y, Ashida K, Nomura M, Morioka M.
Pituitary Gangliocytoma Producing TSH and TRH:  A Review of “Gangliocytomas of the Sellar Region”J Clin Endocrinol Metab. 2020 105(10):3109-3121.

  1. Malchiodi E, Profka E, Ferrante E, Sala E, Verrua E, Campi I, Lania AG, Arosio M, Locatelli M, Mortini P, Losa M, Beck-Peccoz P, Spada A, Mantovani G. Thyrotropin-secreting pituitary adenomas: outcome of pituitary surgery and irradiation. J Clin Endocrinol Metab. 2014;99: 2069-2076.
  2. Ando S, Sarlis NJ, Krishnan J, Feng X, Refetoff S, Zhang MQ, Oldfield EH, Yen PM. Aberrant alternative splicing of thyroid hormone receptor in a TSH-secreting pituitary tumor is a mechanism for hormone resistance. Mol Endocrinol. 2001; 15: 1529-1538.
  3. Ando S, Sarlis NJ, Oldfield EH, Yen PM. Somatic mutation of TRbeta can cause a defect in negative regulation of TSH in a TSH-secreting pituitary tumor. J Clin Endocrinol Metab. 2001; 86: 5572-5576.
  4. Teng X, Jin T, Brent GA, Wu A, Teng W, Shan Z. A patient with a thyrotropin-secreting microadenoma and resistance to thyroid hormone (P453T). J Clin Endocrinol Metab. 2015; 100: 2511-2514.
  5. Tannahill LA, Visser TJ, McCabe CJ, Kachilele S, Boelaert K, Sheppard MC, Franklyn JA, Gittoes NJ. Dysregulation of iodothyronine deiodinase enzyme expression and function in human pituitary tumors. Clin Endocrinol (Oxf). 2002; 56: 735-743.
  6. Baur A, Buchfelder M, Kohrle J. Expression of 5'-deiodinase enzymes in normal pituitaries and in various human pituitary adenomas. Eur J Endocrinol. 2002; 147: 263-268.
  7. Webster J, Peters JR, John R, Smith J, Chan V, Hall R, Scanlon MF. Pituitary stone: two cases of densely calcified thyrotropin-secreting pituitary adenomas. Clin Endocrinol (Oxf) 1994; 40:137-143.
  8. Ezzat S, Horvath E, Kovacs K, Smyth HS, Singer W, Asa SL. Basic fibroblast growth factor expression by two prolactin and thyrotropin-producing pituitary adenomas. Endocr Pathol 1995; 6:125-134.
  9. Trouillas J, Girod C, Loras B, Claustrat B, Sassolas G, Perrin G, Buonaguidi R. The TSH secretion in the human pituitary adenomas. Pathol Res Pract 1988; 183: 596-600.
  10. Mixson AJ, Friedman TC, David AK, Feuerstein IM, Taubenberger JK, Colandrea JM, Doppman JL, Oldfield EH, Weintraub BD. Thyrotropin-secreting pituitary carcinoma. J Clin Endocrinol Metab 1993; 76: 529-533.
  11. Lu C, Willingham MC, Furuya F, Cheng SY. Activation of phosphatidylinositol 3-kinase signaling promotes aberrant pituitary growth in a mouse model of thyroid-stimulating hormone-secreting pituitary tumors. Endocrinology. 2008; 149: 3339-3345.
  12. Dong Q, Brucker-Davis F, Weintraub BD, Smallridge RC, Carr FE, Battey J, Spiegel AM, Shenker A. Screening of candidate oncogenes in human thyrotrope tumors: absence of activating mutations of the Gq, G11, Gs, or thyrotropin-releasing hormone receptor genes. J Clin Endocrinol Metab. 1996; 81: 1134-1140.
  13. Friedman E, Adams EF, Höög A, Gejman PV, Carson E, Larsson C, De Marco L, Werner S, Fahlbusch R, Nordenskjöld M. Normal structural dopamine type 2 receptor gene in prolactin-secreting and other pituitary tumors. J Clin Endocrinol Metab. 1994; 78: 568-574.
  14. Asteria C, Anagni M, Persani L, Beck-Peccoz P. Loss of heterozigosity of the MEN1 gene in a large series of TSH-secreting pituitary adenomas. J Endocrinol Invest. 2001; 24: 796-801.
  15. Filopanti M, Ballare E, Lania AG et al. Loss of heterozygosity at the SS receptor type 5 locus in human GH- and TSH-secreting pituitary adenomas. J Endocrinol Invest. 2004; 27: 937-942.
  16. Barlier A, Vanbellinghen JF, Daly AF, Silvy M, Jaffrain-Rea ML, Trouillas J, Tamagno G, Cazabat L, Bours V, Brue T, Enjalbert A, Beckers A. Mutations in the aryl hydrocarbon receptor interacting protein gene are not highly prevalent among subjects with sporadic pituitary adenomas. J Clin Endocrinol Metab. 2007; 92: 1952-1955.
  17. Sapkota S, Horiguchi K, Tosaka M, Yamada S, Yamada M. Whole-exome sequencing study of thyrotropin-secreting pituitary adenomas. J Clin Endocrinol Metab. 2017; 102: 566-75.

95a.     Neou M, Villa C, Armignacco R, Jouinot A, Raffin-Sanson ML, Septier A, Letourneur F, Diry S, Diedisheim M, Izac B, Gaspar C, Perlemoine K, Verjus V, Bernier M, Boulin A, Emile JF, Bertagna X, Jaffrezic F, Laloe D, Baussart B, Bertherat J, Gaillard S, Assié G. Pangenomic Classification of Pituitary Neuroendocrine Tumors. Cancer Cell. 2020;37(1):123-134.

  1. Watanabe K, Kameya T, Yamauchi A, Yamamoto N, Kuwayama A, Takei I, Maruyama H, Saruta T. Thyrotropin-producing adenoma associated with pituitary resistance to thyroid hormone. J Clin Endocrinol Metab 1993; 76:1025-1030.
  2. Safer JD, Colan SD, Fraser LM, Wondisford FE. A pituitary tumor in a patient with thyroid hormone resistance: a diagnostic dilemma. Thyroid 2001; 11: 281-291.
  3. Beck-Peccoz P, Persani L. TSH-induced hyperthyroidism caused by a pituitary tumor. Nat Clin Pract Endocrinol Metab. 2006; 2: 524-528.
  4. Sriphrapradang C, Srichomkwun P, Refetoff S, Mamanasiri S. A Novel thyroid hormone receptor beta gene mutation (G251V) in a Thai patient with resistance to thyroid hormone coexisting with pituitary incidentaloma. Thyroid. 2016; 26: 1804-806.
  5. Gancel A, Vuillermet P, Legrand A, Catus F, Thomas F, Kuhn J M. Effets of a slow-release formulation of the new somatostatin analogue lanreotide in TSH-secreting pituitary adenomas. Clin Endocrinol (Oxf). 1994; 40: 421-428.
  6. Bertherat J, Brue T, Enjalbert A, Gunz G, Rasolonjanahary R, Warnet A, Jaquet P, Epelbaum J. Somatostatin receptors on thyrotropin-secreting pituitary adenomas: comparison with the inhibitory effects of octreotide upon in vivo and in vitro hormonal secretions. J Clin Endocrinol Metab. 1992; 75: 540-546.
  7. Yoshihara A, Isozaki O, Hizuka N, Nozoe Y, Harada C, Ono M, Kawamata T, Kubo O, Hori T, Takano K. Expression of type 5 somatostatin receptor in TSH-secreting pituitary adenomas: a possible marker for predicting long-term response to octreotide therapy. Endocr J. 2007; 54: 133-138.
  8. Gatto F, Barbieri F, Castelletti L, Arvigo M, Pattarozzi A, Annunziata F, Saveanu A, Minuto F, Castellan L, Zona G, Florio T, Ferone D. In vivo and in vitro response to octreotide LAR in a TSH-secreting adenoma: characterization of somatostatin receptor expression and role of subtype 5. Pituitary. 2011; 14: 141-147.
  9. Horiguchi K, Yamada M, Umezawa R, Satoh T, Hashimoto K, Tosaka M, Yamada S, Mori M. Somatostatin receptor subtypes mRNA in TSH-secreting pituitary adenomas: a case showing a dramatic reduction in tumor size during short octreotide treatment. Endocr J. 2007; 54: 371-378.

104a    Han R, Shen L, Zhang J, Xie J, Fang W, Sun Q, Bian L, Zhou Y, Wang S, Ning G, Wang W, Ye L. Diagnosing Thyrotropin-Secreting Pituitary Adenomas by Short-Term Somatostatin Analogue Test. Thyroid. 2020; 30(9):1236-1244.

  1. Wood DF, Johnston JM, Johnston DG. Dopamine, the dopamine D2 receptor and pituitary tumors. Clin Endocrinol (Oxf). 1991; 35: 455-466.
  2. Verhoeff NPLG, Bemelman FJ, Wiersinga WM, et al: Imaging of dopamine D2 and somatostatin receptors in vivo using single-photon emission tomography in a patient with a TSH/PRL-producing pituitary macroadenoma, Eur J Nucl Med. 1993; 20: 555-560.
  3. Gesundheit N, Petrick P, Nissim M, Dahlberg PA, Doppman L, Emerson CH, Braverman LE, Oldfield EH, Weintraub BD. Thyrotropin-secreting pituitary adenomas: clinical and biochemical heterogeneity. Ann Intern Med 1989; 111: 827-835.
  4. Spada A, Bassetti M, Martino E, Giannattasio G, Beck-Peccoz P, Sartorio P, Vallar L, Baschieri L, Pinchera A, Faglia G. In vitro studies on TSH secretion and adenylate cyclase activity in a human TSH-secreting pituitary adenoma. Effects of somatostatin and dopamine. J Endocrinol Invest 1985; 8:193-198.
  5. Rocheville M, Lange DC, Kumar U, Patel SC, Patel RC, Patel YC. Receptors for dopamine and somatostatin: formation of hetero-oligomers with enhanced functional activity. Science 2000; 288:154-157.
  6. Olt S, Şirik M. TSH secreting adenoma: a rare cause of severe headache. Pan Afr Med J. 2016; 23: 2.
  7. Kamoun M, d'Herbomez M, Lemaire C, Fayard A, Desailloud R, Huglo D, Wemeau JL. Coexistence of thyroid-stimulating hormone-secreting pituitary adenoma and Graves' hyperthyroidism. Eur Thyroid J. 2014; 3: 60-4.

111a.   Fu J, Wu A, Wang X, Guan H. Concurrent Graves' Disease and TSH Secreting Pituitary Adenoma Presenting Suppressed Thyrotropin Levels: A Case Report and Review of the Literature. Front Endocrinol (Lausanne). 2020 Aug 6;11:523.

111b.   Quinn M, Bashari W, Smith D, Gurnell M, Agha A. A remarkable case of thyrotoxicosis initially caused by graves' disease followed by a probable TSHoma - a case report. BMC  Endocr Disord. 2020 Aug 27;20(1):133

111c.   Arai N, Inaba M, Ichijyo T, Kagami H, Mine Y. Thyrotropin-producing pituitary adenoma simultaneously existing with Graves' disease: a case report. J Med Case Rep. 2017;11(1):9.

  1. Daya SK, Paulus AO, Braxton EE Jr, Vroman PJ, Mathis DA, Lin R, True MW. Delayed diagnosis of TSH-Secreting adenoma attributed to worsening post-traumatic stress disorder symptoms in a military veteran because of provider anchoring bias. Mil Med. 2017; 182: e1849-e1853.

112a.   Page KA, Roehmholdt BF, Jablonski M & Mayerson AB. Development of thyroid storm after surgical resection of a thyrotropin-secreting pituitary adenoma. Endocrine Practice. 2008; 14: 732-737.

112b.   Fujio S, Ashari, Habu M, Yamahata H, Moinuddin FM, Bohara M, Arimura H, Nishijima Y & Arita K. Thyroid storm induced by TSHsecreting pituitary adenoma: a case report. Endocrine Journal 2014; 61: 1131-1136.

  1. Lim EM, Bhagat CI, Walsh J. Asymptomatic thyrotropin-secreting pituitary microadenoma. Intern Med J. 2001; 31: 428-429.
  2. Beck-Peccoz P, Piscitelli G, Amr S, Ballabio M, Bassetti M, Giannattasio G, Spada A, Nissim M, Weintraub BD, Faglia G. Endocrine, biochemical, and morphological studies of a pituitary adenoma secreting growth hormone, thyrotropin (TSH), and alpha-subunit: evidence for secretion of TSH with increased bioactivity. J Clin Endocrinol Metab. 1986; 62: 704-711.
  3. Losa M, Giovanelli M, Persani L, Mortini P, Faglia G, Beck-Peccoz P. Criteria of cure and follow-up of central hyperthyroidism due to thyrotropin-secreting pituitary adenomas. J Clin Endocrinol Metab. 1996; 81: 3086-3090.
  4. Maisnam I, Dutta D, Jain R, Ghosh S, Mukhopadhyay S, Chowdhury S. Plurihormone secreting pituitary macroadenoma masquerading as thyrotoxicosis: Clinical presentation and diagnostic challenges. Indian J Endocrinol Metab. 2012;16 (Suppl 2): S315-S317.
  5. Glynn N, Agha A. Unexpected clinical course during treatment of a TSH-secreting pituitary adenoma. Endocr Pract. 2013; 19: e88-e91.
  6. Johnston PC, Hamrahian AH, Prayson RA, Kennedy L, Weil RJ. Thyrotoxicosis with absence of clinical features of acromegaly in a TSH- and GH-secreting,invasive pituitary macroadenoma. Endocrinol Diabetes Metab Case Rep. 2015; 2015: 140070.
  7. George JT, Thow JC, Matthews B, Pye MP, Jayagopal V. Atrial fibrillation associated with a thyroid stimulating hormone-secreting adenoma of the pituitary gland leading to a presentation of acute cardiac decompensation: a case report. J Med Case Reports. 2008; 2: 67.
  8. Fujio S, Ashari, Habu M, Yamahata H, Moinuddin FM, Bohara M, Arimura H, Nishijima Y, Arita K. Thyroid storm induced by TSH-secreting pituitary adenoma: a case report. Endocr J. 2014; 61: 1131-1136.
  9. Kao YH, Chang TJ, Huang TS. Thyrotropin-secreting pituitary tumor presenting with congestive heart failure and good response to dopaminergic agonist cabergoline. J Formos Med Assoc. 2013; 112: 721-724.
  10. Mousiolis AC, Rapti E, Grammatiki M, Yavropoulou M, Efstathiou M, Foroglou N, Daniilidis M, Kotsa K. Somatostatin analogue treatment of a TSH-secreting adenoma presenting with accelerated bone metabolism and a pericardial effusion: a case report. Medicine (Baltimore). 2016; 95: e2358.
  11. Lee JH, Park M, Park MJ, Jo YS. Massive pleural and pericardial effusion dueto hypothyroidism in a patient with a surgically treated thyroid-stimulating hormone-producing pituitary adenoma. Acta Clin Belg. 2018; 73: 398-401.
  12. Pappa T, Papanastasiou L, Markou A, Androulakis I, Kontogeorgos G, Seretis A, Piaditis G. Thyrotoxic periodic paralysis as the first manifestation of a thyrotropin-secreting pituitary adenoma. Hormones (Athens). 2010; 9: 82-86.
  13. Frara S, Losa M, Doga M, Formenti AM, Mortini P, Mazziotti G, Giustina A. High prevalence of radiological vertebral fractures in patients with TSH-secreting pituitary adenoma. J Endocr Soc. 2018; 2: 1089-1099.
  14. Abs R, Stevenaert A, Beckers A. Autonomously functioning thyroid nodules in a patient with a thyrotropin-secreting pituitary adenoma: possible cause-effect relationship. Eur J Endocrinol. 1994; 131: 355-358.
  15. Aksoy DY, Gedik A, Cinar N, Soylemezoglu F, Berker M, Gurlek OA. Thyrotropinoma and multinodular goiter: A diagnostic challenge for hyperthyroidism. J Res Med Sci. 2013; 18: 1008-1010.
  16. Gasparoni P, Rubello D, Persani L, Beck-Peccoz P. Unusual association between a thyrotropin-secreting pituitary adenoma and a papillary thyroid carcinoma. Thyroid 1998; 8: 181-183.
  17. Poggi M, Monti S, Pascucci C, Toscano V. A rare case of follicular thyroid carcinoma in a patient with thyrotropin-secreting pituitary adenoma. Am J Med Sci. 2009; 337: 462-465.
  18. Perticone F, Pigliaru F, Mariotti S, Deiana L, Furlani L, Mortini P, Losa M. Is the incidence of differentiated thyroid cancer increased in patients with thyrotropin-secreting adenomas? Report of three cases from a large consecutive series. Thyroid. 2015; 25: 417-424.
  19. Ünlütürk U, Sriphrapradang C, Erdoğan MF, Emral R, Güldiken S, Refetoff S, Güllü S. Management of differentiated thyroid cancer in the presence ofresistance to thyroid hormone and TSH-secreting adenomas: a report of four cases and review of the literature. J Clin Endocrinol Metab. 2013; 98: 2210-2217.
  20. Azukizawa M, Morimoto S, Miyai K, Miki T, Yabu Y, Amino N, Kuma K, Kumahara Y. TSH-producing pituitary adenoma associated with Graves' disease. In: Stockigt JR, Nagataki S (eds) Thyroid Research, vol.VIII, Australian Academy of Sciences, Canberra, 1980: 645-648.
  21. Yovos JG, Falko JM, O'Dorisio TM, Malarkey WN, Cataland S, Capen CC. Thyrotoxicosis and a thyrotropin-secreting pituitary tumor causing unilateral exophthalmos. J Clin Endocrinol Metab 1981; 53: 338-343.

133a.   Kaneto H, Kamei S, Tatsumi F, Shimoda M, Kimura T, Obata A, Anno T, Nakanishi S, Kaku K, Mune T. Syndrome of inappropriate secretion of TSH in a subject with galactorrhea and menstrual disorder and undergoing infertility treatment: Case report. Medicine (Baltimore). 2021;100(52): e28414.

  1. Sy ARG, Bernstein R, Chynn KI, Kourides IA. Reduction in size of a thyrotropin- and gonadotropin-secreting pituitary adenoma treated with octreotide acetate (somatostatin analogue). J Clin Endocrinol Metab 1992; 74: 690-694.
  2. Li J, Li J, Jiang S, Yu R, Yu Y. Case report of a pituitary thyrotropin-secreting macroadenoma with Hashimoto thyroiditis and infertility. Medicine (Baltimore). 2018; 97: e9546.
  3. Beck-Peccoz P, Piscitelli G, Cattaneo MG, Faglia G, White EL, Barlow JW, Stockigt JR. Evaluation of free thyroxine methods in the presence of iodothyronine binding autoantibodies. J Clin Endocrinol Metab. 1984; 58: 736-739.
  4. Koulouri O, Moran C, Halsall D, Chatterjee K, Gurnell M. Pitfalls in the measurement and interpretation of thyroid function tests. Best Pract Res Clin Endocrinol Metab. 2013; 27: 745-762.
  5. Schoenmakers N, Moran C, Campi I, Agostini M, Bacon O, Rajanayagam O, Schwabe J, Bradbury S, Barrett T, Geoghegan F, Druce M, Beck-Peccoz P, O'Toole A, Clark P, Bignell M, Lyons G, Halsall D, Gurnell M, Chatterjee K. A novel albumin gene mutation (R221I) in familial dysalbuminemic hyperthyroxinemia. J Clin Endocrinol Metab. 2014; 99: E1381-E1386.
  6. Zweig MH, Csako G, Spero M. Escape from blockade of interfering heterophile antibodies in a two-site immunoradiometric assay for thyrotropin. Clin Chem. 1988; 34: 2589-2591.
  7. Srivastava, R, Bartlett WA, Kennedy IM, Hiney A, Fletcher C, Murphy MJ. Reflex and reflective testing: efficiency and effectiveness of adding on laboratory tests. Ann. Clin. Biochem. 2010; 47: 223-227.
  8. Wardle CA, Fraser WD, Squire CR. Pitfalls in the use of thyrotropin concentration as a first-line thyroid-function test. Lancet 2001; 357: 1013-1014.
  9. Roelfsema F, Kok S, Kok P, Pereira AM, Biermasz NR, Smit JW, Frolich M, Keenan DM, Veldhuis JD, Romijn JA. Pituitary-hormone secretion by thyrotropinomas. Pituitary. 2009; 12: 200-210.
  10. Okuma H, Hashimoto K, Ohashi T, Mihara M, Minami I, Izumiyama H, Sasaki S, Inoshita N, Nishioka H, Yamada S, Yoshimoto T. A case of TSH-secreting pituitary adenoma with cyclic fluctuations in serum TSH levels. Endocr J. 2018; 65: 737-746.
  11. Beck-Peccoz P, Persani L. Variable biological activity of thyroid-stimulating hormone. Eur J Endocrinol 1994; 131: 331-340.
  12. Magner J, Klibanski A, Fein H, Smallridge R, Blackard W, Young W Jr, Ferriss JB, Murphy D, Kane J, Rubin D. Ricin and lentil lectin affinity chromatography reveals oligosaccharide heterogeneity of thyrotropin secreted by 12 human pituitary tumors. Metabolism 1992; 41: 1009-1015.
  13. Beck-Peccoz P, Persani L, Faglia G. Glycoprotein hormone -subunit in pituitary adenomas. Trends Endocrinol Metab 1992; 3: 41-45.
  14. Beck-Peccoz P, Roncoroni R, Mariotti S, Medri G, Marcocci C, Brabant G, Forloni F, Pinchera A, Faglia G. Sex hormone-binding globulin measurement in patients with inappropriate secretion of thyrotropin (IST): evidence against selective pituitary thyroid hormone resistance in nonneoplastic IST. J Clin Endocrinol Metab 1990; 71: 19-25.
  15. Persani L, Preziati D, Matthews CH, Sartorio A, Chatterjee VK, Beck-Peccoz P. Serum levels of carboxyterminal cross-linked telopeptide of type I collagen (ICTP) in the differential diagnosis of the syndromes of inappropriate secretion of TSH. Clin Endocrinol (Oxf.) 1997; 47: 207-214.
  16. Bonomi M, Proverbio MC, Weber G, Chiumello G, Beck-Peccoz P, Persani L. Hyperplastic pituitary gland, high serum glycoprotein hormone alpha-subunit, and variable circulating thyrotropin (TSH) levels as hallmark of central hypothyroidism due to mutations of the TSH beta gene. J Clin Endocrinol Metab. 2001; 86: 1600-1604.
  17. Losa M, Magnani P, Mortini P, Persani L, Acerno S, Giugni E, Fazio F, Beck-Peccoz P, Giovanelli M. Indium-111 pentetreotide single-photon emission tomography in patients with TSH-secreting pituitary adenomas: correlation with the effect of a single administration of octreotide on serum TSH levels. Eur J Nucl Med. 1997; 24: 728-731.
  18. Brandstätter W, Hatzl M, Weis S, Javor A, Gabriel M. Successful resection of TSH-secreting pituitary adenoma demonstrated by serial 99mTc-scintigraphy. Nuklearmedizin. 2015; 54: N23-N24.
  19. Cooper DS, Wenig BM. Hyperthyroidism caused by an ectopic TSH-secreting pituitary tumor. Thyroid. 1996; 6: 337-343.
  20. Song M, Wang H, Song L, Tian H, Ge Q, Li J, Zhu Y, Li J, Zhao R, Ji HL. Ectopic TSH-secreting pituitary tumor: a case report and review of prior cases. BMC Cancer. 2014; 14: 544.
  21. Tong A, Xia W, Qi F, Jin Z, Yang D, Zhang Z, Li F, Xing X, Lian X. Hyperthyroidism caused by an ectopic thyrotropin-secreting tumor of the nasopharynx: a case report and review of the literature. Thyroid. 2013; 23: 1172-1177.
  22. Wang Q, Lu XJ, Sun J, Wang J, Huang CY, Wu ZF. Ectopic suprasellar thyrotropin-secreting pituitary adenoma: case report and literature review. World Neurosurg. 2016; 95: 617.e13-617.e18.
  23. Yang J, Liu S, Yang Z, Shi YB. Ectopic thyrotropin secreting pituitary adenoma concomitant with papillary thyroid carcinoma: Case report. Medicine (Baltimore). 2017; 96: e8912.
  24. Hanaoka Y, Ogiwara T, Kakizawa Y, Nagm A, Seguchi T, Aoyama T, Koyama JI, Sato A, Hongo K. Calcified ectopic TSH-secreting pituitary adenoma mimicking craniopharyngioma: a rare case report and literature review. Acta Neurochir (Wien). 2018; 160: 2001-2005.

157a.   Kim S, Dillon WP, Hope TA, El-Sayed IH, van Zante A, Wu K, Masharani U. Ectopic Thyroid-Stimulating Hormone-Secreting Pituitary Adenoma of the Nasopharynx Diagnosed by Gallium 68 DOTATATE Positron Emission Tomography/Computed Tomography. World Neurosurg. 2019; 125: 400-404.

157b.   Campi I, Covelli D, Moran C, Fugazzola L, Cacciatore C, Orlandi F, Gallone G, Chatterjee K, Beck-Peccoz P, Persani L. The Differential Diagnosis of Discrepant Thyroid Function Tests: Insistent Pitfalls and Updated Flow-Chart Based on a Long-Standing Experience. Front Endocrinol (Lausanne). 2020 Jul 7;11:432

157c.   Mimoto MS, Refetoff S. Clinical recognition and evaluation of patients with inherited serum thyroid hormone-binding protein mutations. J Endocrinol Invest. 2020 Jan;43(1):31-41

  1. Beck-Peccoz P, Lania A, Beckers A, Chatterjee K, Wemeau JL. European thyroid association guidelines for the diagnosis and treatment of thyrotropin-secreting pituitary tumors. Eur Thyroid J. 2013; 2: 76-82.

158a.   Varlamov EV, McCartney S, Fleseriu M. 2019 Functioning pituitary adenomas – Current treatment options and emerging medical therapies. Eur Endocrinol. 201; 15(1):30-40.

  1. Dyer MW, Gnagey A, Jones BT, Pula RD, Lanier WL, Atkinson JLD, Pasternak JJ. Perianesthetic management of patients with thyroid-stimulating hormone-secreting pituitary adenomas. J Neurosurg Anesthesiol. 2017; 29: 341-346.
  2. Wallace IR, Healy E, Cooke RS, Ellis PK, Harper R, Hunter SJ. TSH-secreting pituitary adenoma: benefits of pre-operative octreotide. Endocrinol Diabetes Metab Case Rep. 2015; 2015: 150007.
  3. Fukuhara N, Horiguchi K, Nishioka H, Suzuki H, Takeshita A, Inoshita N, Yamada S. Short-term preoperative octreotide treatment for TSH-secreting pituitary adenoma. Endocr J. 2015; 62: 21-27.

161a.  Tokutsu A, Okada Y, Torimoto K, Otsuka T, Narisawa M, Kurozumi A, Tanaka Y. Response of thyrotropin-secreting pituitary tumors to preoperative lanreotide therapy. Report of two cases. Neuro Endocrinol Lett. 2020; 41(1):10-16.

161b.   Shimatsu A, Nakamura A, Takahashi Y, Fujio S, Satoh F, Tahara S, Nishioka H, Takano K, Yamashita M, Arima H, Tominaga A, Tateishi S, Matsushita Y. Preoperative and long-term efficacy and safety of lanreotide autogel in patients with thyrotropin-secreting pituitary adenoma: a multicenter, single-arm, phase 3 study in Japan. Endocr J. 2021; 68(7):791-805.

161c.   van Eersel MEA, Meeuwisse-Pasterkamp SH, Muller Kobold AC, Meiners LC, den Dunnen WF, Hofland LJ, van den Berg G. Treatment of a thyrotropin-secreting pituitary adenoma (TSH-oma) with pasireotide LAR. Clin Endocrinol (Oxf). 2017; 87(6):877-87.

161d.   Illouz F, Chanson P, Sonnet E, Brue T, Ferriere A, Raffin Sanson ML, Vantyghem MC, Raverot G, Munier M, Rodien P, Briet C. Somatostatin receptor ligands induce TSH deficiency in thyrotropin-secreting pituitary adenoma. Eur J Endocrinol. 2021; 184(1):1-8.

  1. McCutcheon IE, Weintraub BD, Oldfield EH. Surgical treatment of thyrotropin-secreting pituitary adenomas, J Neurosurg 1990; 73: 674-683.
  2. Losa M, Mortini P, Franzin A. Surgical management of thyrotropin-secreting pituitary adenomas, Pituitary. 1999; 2: 127-131.
  3. Page KA, Roehmholdt BF, Jablonski M, Mayerson AB. Development of thyroid storm after surgical resection of a thyrotropin-secreting pituitary adenoma. Endocr Pract. 2008; 14: 732-737.
  4. Daousi C, Foy PM, MacFarlane IA. Ablative thyroid treatment for thyrotoxicosis due to thyrotropin-producing pituitary tumors. J Neurol Neurosurg Psychiatry. 2007; 78: 93-95.

165a.   Kim SH, Ku CR, Na M, Yoo J, Kim W, Jung IH, Kim KW, Moon JH, Kim D, Lee EJ, Kim SH, Kim EH. Immediate postoperative measurement of thyroid-stimulating hormone as an early predictor of remission in thyroid-stimulating hormone-secreting pituitary adenomas. J Neurosurg. 2020; 134(3):794-800.

  1. Mouslech Z, Somali M, Sakali AK, Savopoulos C, Mastorakos G, Hatzitolios AI. TSH-secreting pituitary adenomas treated by gamma knife radiosurgery: our case experience and a review of the literature. Hormones (Athens). 2016; 15: 122-128.
  2. Ohki M, Sato K, Tuchiya D, Sato S, Saito S, Kinjo T, Kayama T, Yokura H, Yoshimoto T. A case of TSH-secreting pituitary adenoma associated with an unruptured aneurysm: successful treatment by two-stage operation and gamma knife. No To Shinkei 1999; 51: 895-899.
  3. Mulinda JR, Hasinski S, Rose LI. Successful therapy for a mixed thyrotropin-and prolactin-secreting pituitary macroadenoma with cabergoline. Endocr Pract. 1999; 5: 76-79.
  4. Mouton F, Faivre-Defrance F, Cortet-Rudelli C, Assaker R, Soto-Ares G, Defoort-Dhellemmes S, Blond S, Wemeau JL, Vantyghem MC. TSH-secreting adenoma improved with cabergoline. Ann Endocrinol (Paris). 2008; 69: 244-248.
  5. Prieto-Tenreiro A, Díaz-Guardiola P. Long term treatment of a thyrotropin-secreting microadenoma with somatostatin analogues. Arq Bras Endocrinol Metabol. 2010; 54: 502-506.
  6. Gruszka A, Zielinski GM, Kunert-Radek J. Preoperative long-acting octreotide treatment for invasive thyrotropin-secreting pituitary macroadenoma after previous radioiodine thyroid ablation. J Clin Neurosci. 2014; 21: 340-342.
  7. Zhang CF, Liang D, Zhong LY. Efficacy of the long-acting octreotide formulation in patients with thyroid-stimulating hormone-secreting pituitary adenomas after incomplete surgery and octreotide treatment failure. Chin Med J (Engl). 2012; 125: 2758-2763.
  8. Fliers E, van Furth WR, Bisschop PH. Cure of a thyrotrophin (TSH)-secreting pituitary adenoma by medical therapy. Clin Endocrinol (Oxf). 2012 ; 77: 788-790.
  9. Neggers SJ, van der Lely AJ. Medical approach to pituitary tumors. Handb Clin Neurol. 2014; 124: 303-316.
  10. Gatto F, Grasso LF, Nazzari E, Cuny T, Anania P, Di Somma C, Colao A, Zona G, Weryha G, Pivonello R, Ferone D. Clinical outcome and evidence of high ratepost-surgical anterior hypopituitarism in a cohort of TSH-secreting adenoma patients: Might somatostatin analogues have a role as first-line therapy? Pituitary. 2015; 18: 583-591.
  11. Rimareix F, Grunenwald S, Vezzosi D, Rivière LD, Bennet A, Caron P. Primary medical treatment of thyrotropin-secreting pituitary adenomas by first-generation somatostatin analogues: a case study of seven patients. Thyroid. 2015; 25: 877-882.
  12. Araujo PB, Vieira Neto L, Gadelha MR. Pituitary tumor management in pregnancy. Endocrinol Metab Clin North Am. 2015; 44: 181-197.
  13. Bolz M, Körber S, Schober HC. TSH secreting adenoma of pituitary gland (TSHom) - rare cause of hyperthyroidism in pregnancy. Dtsch Med Wochenschr. 2013; 138: 362-366.
  14. Beck-Peccoz P, Persani L. Medical management of thyrotropin-secreting pituitary adenomas. Pituitary. 2002; 5: 83-88.
  15. Chanson P, Weintraub BD, Harris AG. Octreotide therapy for thyroid stimulating-secreting pituitary adenomas. A follow-up of 52 patients. Ann Intern Med. 1993; 119: 236-240.