Archives

Management of Diabetes and Hyperglycemia in Hospitalized Patients

ABSTRACT

Diabetes is the most prevalent metabolic disorder and it is estimated to affect more than 460 million people globally. In the United States, 34.2 million Americans, or 10.5% of the population, have diabetes. Patients with diabetes have a 3-fold greater chance of hospitalization compared to those without diabetes. In 2016 in the U.S., there were over 7.8 million hospital stays for patients with diabetes. Hyperglycemia, defined as a blood glucose greater than 140 mg/dl (7.8 mmol/l), is reported in 22-46% of non- critically ill hospitalized patients. Extensive data indicates that inpatient hyperglycemia, in patients with or without prior diagnosis of diabetes, is associated with an increased risk of complications and mortality. Recently the American Diabetes Association recommended a target glucose between 140 mg/dl (7.8 mmol/l) and 180 mg/dl (10.0 mmol/l) for critically ill patients in the ICU as well as for most patients admitted to general medicine and surgery in the non-ICU setting. Insulin remains the best way to control hyperglycemia in the inpatient setting especially in the critically ill patient. Intravenously administered insulin is the preferred method to achieve the recommended glycemic target in the ICU. The use of oral antidiabetic agents was not recommended in previous guidelines because the lack of safety and efficacy studies in the inpatient setting. However, increasing evidence indicates that treatment with oral agents such as DPP4 inhibitors, alone or in combination with basal insulin, is safe and effective in general medicine and surgery patients with mild to moderate hyperglycemia.

INTRODUCTION

Diabetes is a prevalent metabolic disorder that affects more than 460 million people globally, and is projected to rise to 700 million (10.9% of the adult population) by 2045 (1). In the United States, data from the National Diabetes Statistics Report in 2020 estimated that a total of 34.2 million Americans, or 10.5% of the population, had diabetes (2). The percentage of the population with diagnosed diabetes is expected to rise, with one study projecting that as many as one in three U.S. adults will have diabetes by 2050 (3). People with diabetes have a 35% greater chance of referral for elective operations and an up to 4-fold greater chance of hospitalization compared to those without diabetes (4-7). Data from the US and Scotland estimate that of those individuals with a discharge diagnosis of diabetes, 30% will require 2 or more hospitalizations in any given year (5,6,8). In 2016 in the U.S., there were over 7.8 million hospital stays for people with diabetes (i.e., diabetes as either a principal diagnosis for hospitalization or as a secondary diagnosis, coexisting condition) (2), and in the UK the annual National Diabetes Inpatient Audit suggested that the prevalence of diabetes amongst inpatients had risen from 15% in 2010 to almost 20% in 2019 (9). In addition, those hospitalized with a diagnosis of diabetes stay in the hospital for longer than those without a diagnosis of diabetes admitted for the same condition (10,11).

Diabetes was the 7th leading cause of death in the United States in 2017, with 83,564 death certificates listing diabetes as the underlying cause of death, accounting for 25.7 deaths per 100,000 of the population (12). The care of people with diabetes imposes a substantial burden on the economy, with a total estimated cost of treating people diagnosed with diabetes in the United States in 2017 was $414 billion – or 24% or all health care spending in the US (11). This included $237 billion in direct medical costs. It is estimated that a further cost of $690 billion is incurred due to reduced productivity (11). Globally, diabetes care costs have been estimated at $1.3 trillion, rising to an estimated $2.1-2.5 trillion by 2030 (13,14). This represents a rise in spending on diabetes as a proportion of  global gross domestic product from 1.8% in 2015 to 2.2% in 2030 (14). Other than the costs of diabetes medications, the largest component of this medical expenditure is hospital inpatient care, accounting for $69.7 billion of the total medical cost (11).

Hyperglycemia is defined as a blood glucose concentration of greater than 140 mg/dl (7.8 mmol/l) (15,16). It is reported in 22% to 46% of non-critically ill hospitalized patients (8,15). Extensive observational and trial data indicate that inpatient hyperglycemia, in patients with or without a prior diagnosis of diabetes, is associated with an increased risk of complications and mortality, a longer hospital stay, a higher admission rate to the intensive care unit (ICU), and a higher need for transitional or nursing home care after hospital discharge (8,17,18).

Several studies and meta-analyses have shown that attempting ‘tight’ glycemic control using intensive insulin therapy is associated with increased risk of hypoglycemia (19-23). This has been associated with increased morbidity and mortality in hospitalized patients (15,24-28). Thus, while insulin therapy is recommended for the management of hyperglycemia in hospitalized patients, the concern about hypoglycemia have led to revised glucose target recommendations from leading professional organizations around the world (16,22,29-32).

This chapter reviews the pathophysiology of hyperglycemia during illness, the mechanisms for increased complications and mortality due to hyperglycemia and hypoglycemia, and reviews the evidence supporting different therapies and approaches for the management of inpatient diabetes and hyperglycemia in the critical care and in the general medicine and surgical settings.

PREVALENCE OF DIABETES AND HYPERGLYCEMIA IN THE HOSPITALIZED PATIENT

Observational studies have reported a prevalence of hyperglycemia and diabetes ranging from 38% to 40% in hospitalized patients (8), and in 70-80% of those with diabetes who have a critical illnesses or cardiac surgery (33-35). A 2017 report using point-of-care bedside glucose tests data in almost 3.5 million people (653,359 ICU and 2,831,436 non-ICU) from 575 hospitals in the United States reported a prevalence of hyperglycemia, (defined as a glucose level >180 mg/dl [10.0 mmol/l]) of 32.2% in ICU patients and in 32.0% of non-ICU patients (33). These numbers included those with newly identified or stress hyperglycemia as well as those with a prior diagnosis of diabetes. The American Diabetes Association (ADA) and American Association of Clinical Endocrinologists (AACE) consensus on inpatient hyperglycemia defined stress hyperglycemia or hospital-related hyperglycemia as any blood glucose concentration >140 mg/dl (>7.8 mmol/l) in patients without a prior history of diabetes (15,16). Although stress hyperglycemia typically resolves as the acute illness or surgical stress abates, a significant proportion (up to 60% in some reports) had confirmed diabetes at 6-12 months after discharge (36,37). A guide from the UK on the management of ‘diabetes at the front door’, also recommends that any individual with diabetes who presents acutely unwell should have a capillary glucose measurement and blood/urine ketone measurement taken, but that if it is high on admission (i.e. >140mg/dl [7.8 mmol/l]) and subsequently goes down to normal, then a diagnosis of stress hyperglycemia should be made and documented to the primary care team (38).

Measurement of HbA1c is indicated in people with hyperglycemia without a history of diabetes to differentiate between stress induced hyperglycemia and previously undiagnosed diabetes (38-41). The Endocrine Society and the UK Joint British Diabetes Societies for Inpatient Care recommendations indicate that people hospitalized with both an elevated blood glucose >140 mg/dl (7.8 mmol/l) and an HbA1c of 6.5% (48 mmol/mol) or higher can be identified as having diabetes (15,38).

PATHOPHYSIOLOGY OF HYPERGLYCEMIA DURING ILLNESS

In subjects without diabetes during the fasted state, plasma glucose is maintained between 70 – 100 mg/dl (3.9 – 5.6 mmol/l) by a finely regulated balance between hepatic glucose production and glucose utilization in peripheral tissues. Maintenance of normal glucose concentration is essential for cardiovascular functioning as well as central nervous system function because the brain can neither synthesize nor store glucose (42,43).


Systemic glucose balance is maintained by a dynamic, minute-to-minute regulation of endogenous glucose production and of glucose utilization by peripheral tissues (44). Glucose production is accomplished by gluconeogenesis or glycogenolysis primarily in the liver and to a lesser degree by the kidneys (45). Gluconeogenesis results from conversion of non-carbohydrate precursors such as lactate, alanine, and glycerol to glucose in the liver (46). Excess glucose is polymerized to glycogen, which is mainly stored in the liver and muscle. Hyperglycemia develops because of three processes: 1) increased gluconeogenesis, 2)   accelerated glycogenolysis, and 3) impaired glucose utilization by peripheral tissues (Figure 1).
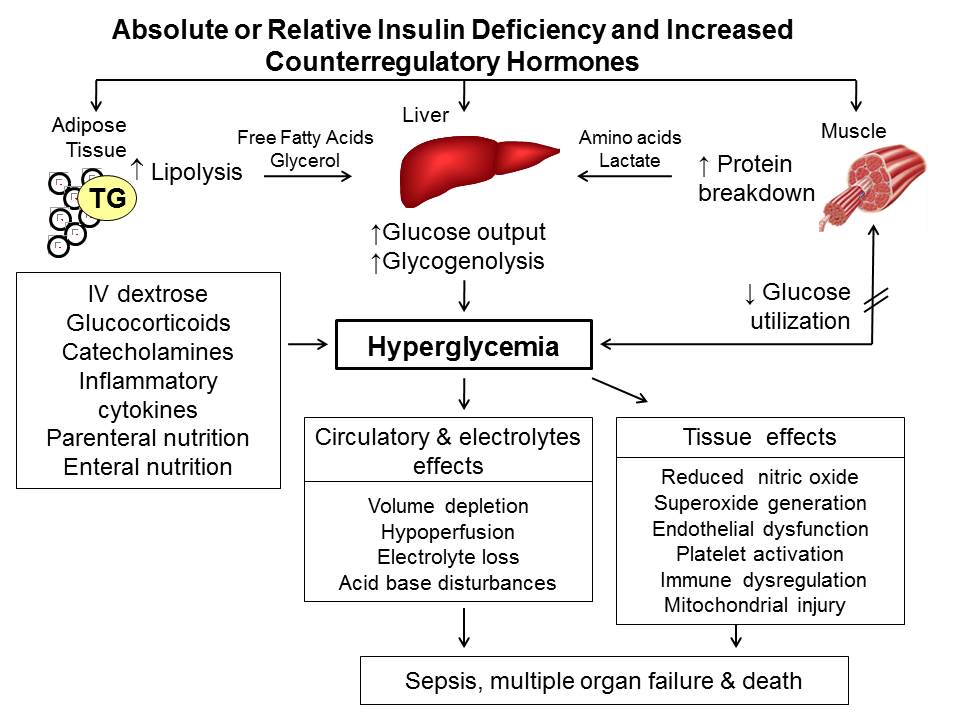
Figure 1. Pathogenesis of hyperglycemia. Hyperglycemia results from increased hepatic glucose production and impaired glucose utilization in peripheral tissues. Reduced insulin and excess counter-regulatory hormones (glucagon, cortisol, catecholamines and growth hormone) increase lipolysis and protein breakdown (proteolysis), and impair glucose utilization by peripheral tissues. Hyperglycemia causes osmotic diuresis that leads to hypovolemia, decreased glomerular filtration rate, and worsening hyperglycemia. At the cellular level, increased blood glucose levels result in mitochondrial injury by generating reactive oxygen species, and endothelial dysfunction by inhibiting nitric oxide production. Hyperglycemia increases levels of pro-inflammatory cytokines such as TNF-α and IL-6 leading to immune system dysfunction. These changes can eventually lead to increased risk of infection, impaired wound healing, multiple organ failure, prolonged hospital stay and death. Adapted from ref (20).

 From the quantitative standpoint, inappropriately increased hepatic glucose production represents the major pathogenic disturbance. Increased hepatic glucose production results from the high availability of gluconeogenic precursors including the amino acids alanine and glutamine, as a result of accelerated proteolysis and decreased protein synthesis; lactate as a result of increased muscle glycogenolysis; and glycerol as a result of increased lipolysis; and from the increased activity of gluconeogenic enzymes (phosphoenol pyruvate carboxykinase, fructose-1,6-bisphosphatase, and pyruvate carboxylase) (45,46).

Glucose metabolism is maintained by an interaction of glucoregulatory hormones – insulin and counter-regulatory hormones (glucagon, cortisol, catecholamines and growth hormone). Insulin controls hepatic glucose production by suppressing hepatic gluconeogenesis and glycogenolysis. Depending on the concentration in the circulation, insulin promotes protein anabolism in insulin-sensitive tissues such as muscle, glucose uptake and glycogen synthesis, and inhibits glycogenolysis and protein breakdown (44,47,48). In addition, insulin is a powerful inhibitor of lipolysis, free fatty acid oxidation, and ketogenesis (47,48).

Counter-regulatory hormones (glucagon, cortisol, catecholamines and growth hormone) also play an important role in the regulation of glucose production and utilization. Glucagon is the most important glycogenolytic hormone, therefore, regulates hepatic glucose production during normal state and in every state of hyperglycemia (45). During stress, excess concentration of counter-regulatory hormones results in altered carbohydrate metabolism by inducing insulin resistance, increasing hepatic glucose production, and reducing peripheral glucose utilization. In addition, high epinephrine levels stimulate glucagon secretion and inhibits insulin release by pancreatic β-cells (49,50).

The development of hyperglycemia results in an inflammatory state characterized by an elevation of pro-inflammatory cytokines and increased oxidative stress markers (51-53). Circulating levels of tumor necrosis factor-α (TNF-α), interleukin [IL]-6, IL1-ß, IL-8, and C-reactive protein are significantly increased two- to fourfold on admission in people with severe hyperglycemia compared with control subjects, and levels returned to normal levels after insulin treatment and resolution of hyperglycemic crises (51). Raised concentrations of TNF-α lead to insulin resistance at the level of the insulin receptor and through altered regulation of the insulin-signaling pathway. Increasing evidence indicates that during acute stressful states, increased concentrations of these inflammatory cytokines can increase insulin resistance by interfering with insulin signaling (52,54). In addition, by preventing insulin-mediated activation of phosphatidylinositol 3- kinase TNF-α reduces insulin- stimulated glucose uptake in peripheral tissues (52,54,55).

CONSEQUENCES OF HYPERGLYCEMIA IN THE HOSPITALIZED PATIENTS

A large body of literature including observational and prospective randomized clinical trials, in people with and without diabetes, as well those who are critically or non-critically ill has shown a strong association between hyperglycemia and poor clinical outcomes, such as mortality, infections and hospital complications (5,56-64). This association correlates with severity of hyperglycemia on admission as well as during the hospital stay (62,65,66). Of interest, increasing evidence indicates an increased risk of complications and mortality in patients without a history of diabetes (stress induced) compared to patients with known diagnosis of diabetes (8,59,65,67,68). It is not clear if stress hyperglycemia is the direct cause of poor outcomes or it is a general marker of severity of illness.


The mechanisms implicated on the detrimental effects of hyperglycemia during acute illnesses are not completely understood. Current evidence indicates that severe hyperglycemia results in impaired neutrophil granulocyte function, high circulating free fatty acids, and overproduction of pro-inflammatory cytokines and reactive oxygen species (ROS) that can result in direct cellular damage, and vascular and immune dysfunction (69).

The majority of evidence linking hyperglycemia and poor outcomes comes from studies in the ICU. Falciglia et al in a retrospective study of over 250,000 veterans admitted to various ICUs reported that hyperglycemia is an independent risk factor for mortality and complications (65). In a nonrandomized, prospective study, Furnary followed 3,554 patients with diabetes that underwent coronary artery bypass graft. Patients treated with subcutaneous insulin (SCI) who had an average blood glucose of 214 mg/dl (11.9 mmol/l) and patients treated with continuous insulin infusion (CII) with an average blood glucose of 177 mg/dl (9.8 mmol/l) had significantly more deep sternal wound infections (63) and a 50% higher risk-adjusted mortality (70). In a different ICU study, patients with blood glucose levels >200 mg/dl (>11.1 mmol/l) were shown to have higher mortality compared to those with blood glucose levels <200 mg/dl (<11.1 mmol/) (5.0% vs. 1.8%, p < 0.001) (62). Importantly however, once again it has been shown that it was those people who were not previously known to have diabetes who developed hyperglycemia in the ICU who fared worst (71). This was confirmed by another ICU study with almost 350,000 people, looking at the outcomes in those with sepsis (72). These authors showed that having hyperglycemia was associated with increased stay in hospital and ICU, and greater 90-day mortality (72). However, there was no difference in outcomes for those with diabetes, unless they had experienced severe hypoglycemia, in which case mortality rose (OR 2.95 95%CI 1.19-7.32) (72). Thus, despite a large amount of work having been done, the optimal blood glucose concentration for people on ICU has yet to be determined (73).


The association of hyperglycemia and poor outcomes also applies to those not in the ICU, but admitted to general medicine and surgery services. In such individuals, hyperglycemia is associated with poor hospital outcomes including prolonged hospital stay, infections, disability after hospital discharge, and death (5,8,56,57,66,74). In a retrospective study of 1,886 patients admitted to a community hospital, mortality in the general floors was significantly higher in patients with newly (stress) diagnosed hyperglycemia and with known diabetes compared to subjects with normal glucose values (10% vs. 1.7% vs. 0.8%, respectively; p < 0.01) (8). In a prospective cohort multicenter study of 2,471 patients with community-acquired pneumonia, those with an admission glucose levels >198 mg/dl (>11.0 mmol/l) had a greater risk of mortality and complications than those with glucose levels <198 mg/dl (<11.0 mmol/l) (68). The risk of complications increased 3% for each 18 mg/dl (1.0 mmol/l) increase in admission glucose (68). In a retrospective study of 348 patients with chronic obstructive pulmonary disease and respiratory tract infection, the relative risk of death was 2.1 in those with a blood glucose of 126-160 mg/dl (7.0-8.9 mmol/l), and 3.4 for those with a blood glucose of >162 mg/dl (9.0 mmol/l) compared to patients with a blood glucose of 108 mg/dl (6.0 mmol/l) (74).

General surgery patients with hyperglycemia during the perioperative period are also at increased risk for adverse outcomes. A systematic review of diabetes and the risk of surgical site infection across a variety of surgical specialties showed that high peri-operative glucose levels were associated with an increased risk of infection (75). In a case-control study, elevated preoperative glucose levels increased the risk of postoperative mortality in patients undergoing elective non-cardiac non-vascular surgery (76). Patients with glucose levels of 110-200 mg/dl (5.6-11.1 mmol/l) and those with glucose levels of >200 mg/dl (>11.1 mmol/l) had, respectively, 1.7-fold and 2.1-fold increased mortality compared to those with glucose levels <5.6 mmol/l (<110 mg/dl) (76). In another study, patients with glucose levels >220 mg/dl (>12.2 mmol/l) on the first postoperative day had a rate of infection 2.7 times higher than those who had serum glucose levels <220 mg/dl (<12.2 mmol/l) (77). A more recent study showed an increase of postoperative infection rate by 30% for every 40mg/dl (2.2 mmol/l) rise in postoperative glucose level above 110 mg/dl (6.1 mmol/l) (78) [67]. Furthermore, a study looking at perioperative glycemic control and the effect on surgical site infections in diabetic patients undergoing foot and ankle surgery showed that 11.9% of those with a serum glucose ≥200 mg/dl (11.1 mmol/l) during the admission developed a surgical site infection versus only 5.2% of those with a serum glucose <200 mg/dl (11.1 mmol/l) (odds ratio = 2.45; 95% CI 1.09-5.52, P = 0.03) (79). Lastly, a prospective randomized study looking at the impact of glycemic control at 1-year post liver transplant showed that in those randomized to a glycemic control of blood glucose below 140 mg/dl (7.8 mmol/l) any infection within 1 year occurred in 35 of the 82 patients (42.7%) versus 54 of 82 (65.9%) in those randomized to a glycemic control of 180 mg/dl (10.0 mmol/l) (P = 0.0046) (80). There is now emerging evidence to suggest that early intervention and the use of technology allowing pro-active identification of people at risk, helps to reduce hospital acquired infection rates, episodes of hyper- and hypoglycemia, as well as, in some cases, reduced length of stay (81-84). A meta-analysis also shows that improving peri-operative glycemic control reduced postoperative infection rates (85).

GLYCEMIC TARGETS IN THE ICU AND NON-ICU SETTINGS

The American Diabetes Association (ADA) and American Association of Clinical Endocrinologist (AACE) task force on inpatient glycemic control and other groups  recommended different glycemic targets in the ICU setting (16) (Table 1). These guidelines suggest targeting a glucose level between 140 and 180 mg/dl (7.8 and 10.0 mmol/l) for the majority of ICU patients and lower glucose targets between 110 and 140 mg/dl (6.1 and 7.8 mmol/l) in selected ICU patients (i.e., centers with extensive experience and appropriate nursing support, cardiac surgical patients, patients with stable glycemic control without hypoglycemia). Glucose targets >180 mg/dl (>10.0 mmol/l) or <110 mg/dl (<6.1 mmol/l) are not recommended in ICU patients. There is an argument to say that lowering glucose thresholds for those in hospital is likely to be associated with harm (27,86) and an equally persuasive argument to suggest that the implementation of the thresholds as advocated by national and organizational guidelines have led to safer care (87).

The most recent guidelines from the Society of Critical Care Medicine (SCCM) for the management of hyperglycemia in critically ill (ICU) patients recommended that a blood glucose ≥150 mg/dl (≥8.3 mmol/l) should trigger interventions to maintain blood glucose below that level and absolutely <180 mg/dl (<10.0 mmol/l) (30). They also suggest that the insulin regimen and monitoring system be designed to avoid and detect hypoglycemia (blood glucose <70 mg/dl [<3.9 mmol/l]) and to minimize glycemic variability (30). The technology to allow this to occur is being development and may enter routine clinical use relatively soon (88-92).

Table 1. Major Guidelines for Treatment of Hyperglycemia in a Hospital Setting


ICU

Non-ICU

ADA/AACE (16)

Initiate insulin therapy for persistent hyperglycemia (glucose >180 mg/dl [>10 mmol/l]).

Treatment goal: For most people, target a glucose level between 140 – 180 mg/dl (7.8 – 10.0 mmol/l].

More stringent goals (110 – 140 mg/dl [6.1 – 7.8 mmol/l]) may be appropriate for selected individuals, if achievable without significant risk for hypoglycemia.

No specific guidelines.

If treated with insulin, pre-meal glucose targets should generally be <140 mg/dl (<7.8 mmol/l), with random glucose levels <180 mg/dl (<10.0 mmol/l).

More stringent targets may be appropriate for those with previously tight glycemic control. Less stringent targets may be appropriate in people with severe comorbidities.


ACP (22)

Recommends against intensive insulin therapy in those with or without diabetes in surgical / medical ICUs

Treatment goal: target glucose between 140 – 200 mg/dl (7.8 – 11.0 mmol/l), in people with or without diabetes, in surgical / medical ICUs


Critical Care Society (30)

Glucose >150 mg/dl (>8.3 mmol/l) should trigger insulin therapy

Treatment goal: maintain glucose <150 mg/dl (<8.3 mmol/l) for most adults in ICU.

Maintain glucose levels <180 mg/dl (10.0 mmol/l) while avoiding hypoglycemia.


Endocrine Society (15)


Pre-meal glucose target <140 mg/dl (<7.8mmol/l) and random blood glucose <180 mg/dl (<10.0 mmol/l). A lower target range may be appropriate in people able to achieve and maintain glycemic control without hypoglycemia. A glucose of <180 – 200 mg/dl (<10.0 – 11.0 mmol/l) is appropriate in those with terminal illness and/or with limited life expectancy or at high risk for hypoglycemia.

Adjust antidiabetic therapy when glucose falls <100 mg/dl (<5.6 mmol/l) to avoid hypoglycemia.

Society of Thoracic Surgeons (93) (Guidelines specific to adult cardiac surgery)

Continuous insulin infusion preferred over SC or intermittent intravenous boluses.

Treatment goal: Recommend glucose <180 mg/dl (<10.0 mmol/l) during surgery (≤110 mg/dl [≤6.1 mmol/l] in fasting and pre-meal states)


Joint British Diabetes Society for Inpatient Care (94)


Target blood glucose levels in most people of between 108 – 180 mg/dl (6.0 – 10 mmol/l) with an acceptable range of between 72 – 216 mg/dl (4.0 – 12.0 mmol/l).

AACE/ADA, American Association of Endocrinologists and American Diabetes Association joint guidelines; ACP, American College of Physicians; ADA, American Diabetes Association; ICU, intensive care unit;

In the non-ICU setting, the Endocrine Society and the ADA/AACE Practice Guidelines recommended a pre-meal glucose of <140 mg/dl (<7.8 mmol/l) and a random glucose of <180 mg/dl (<10.0 mmol/l) for the majority of non-critically ill patients treated with insulin (15,16,29). More recently the American Diabetes Association has recommended that target glucose for most general medicine and surgery patients in non-ICU settings should be between 140 – 180 mg/dl (7.8 – 10.0 mmol/l) (31). To avoid hypoglycemia <70 mg/dl (<3.9 mmol/l), the total basal and prandial insulin dose should be reduced if glucose levels fall between 70 – 100 mg/dl (3.9 – 5.6 mmol/l). In contrast, higher glucose ranges (>200 mg/dl [>11.1 mmol/l]) may be acceptable in terminally ill patients or in patients with severe comorbidities as a way of avoiding symptomatic hyperglycemia (15,95).

Guidelines from the Joint British Diabetes Society's Inpatient Care Group in the UK published over the last few years, aim for target blood glucose levels in most people between 108 – 180 mg/dl (6.0 – 10.0 mmol/l) with an acceptable range of between 72 – 216 mg/dl (4.0 – 12.0 mmol/l) (94). Table 1 summarizes the currently available guidelines for the management of hyperglycemia in the hospital setting.

EVIDENCE FOR CONTROLLING HYPERGLYCEMIA IN ICU AND NON – ICU SETTINGS

The Leuven surgical ICU study set the stage for promoting intensive glycemic control in the critical care setting (96). This study randomized 1,548 people admitted to the surgical ICU (63% cardiac cases, 13% with diabetes, most patients received early parenteral nutrition). Individuals were randomized to either conventional therapy with a target glucose between 180 – 200 mg/dl (10.0 – 11.1 mmol/l) or intensive therapy to a target glucose between 80 – 110 mg/dl (4.4 – 6.1 mmol/l). Those in the conventional arm had a mean daily glucose average of 153 mg/dl (8.5 mmol/l) and those in the intensive arm had an average glucose of 103 mg/dl (5.7 mmol/l). Those in the intensive group had significantly less bacteremia, less antibiotic requirements, lower length of ventilator dependency, lower number of ICU days, and an overall 34% reduction in mortality (96). Following a similar study design, the same group of investigators randomized people in a medical ICU (18% with diabetes) and reported that intensive insulin therapy (mean daily glucose of 111 mg/dl [6.2 mmol/l]) resulted in less ICU and total hospital complications in those with 3 days of insulin treatment (97).

A large number of well-designed randomized controlled trials and meta-analyses however, have shown that such low glucose targets are difficult to achieve, even in environments with high staff to patient ratios without increasing the risk for severe hypoglycemia (19,98-100). In addition, these and other studies failed to show improvement in clinical outcomes and have even shown increased mortality risk with intensive glycemic control (Table 2) (26,98-102). The Glucontrol trial, a seven-country multicenter trial, randomized people in medical and surgical ICUs to tight glycemic control (80 – 110 mg/dl [4.4 – 6.1 mmol/l]) versus conventional glycemic control (140 – 180 mg/dl [7.8 – 10.0 mmol/l]). The study did not find a difference in mortality between the two groups (103). The Efficacy of Volume Substitution and Insulin Therapy in Sepsis (VISEP) study was another trial that attempted to reproduce the data from the Leuven trial (98). The study was a multicenter study in Germany that randomized people with sepsis to receive intensive insulin therapy to maintain glucose levels between 180 – 200 mg/dl (10.0 – 11.1 mmol/l) versus the intensive arm of 80 – 110 mg/dl (4.4 – 6.1 mmol/l) (98). The investigators evaluated differences between the groups in 28- and 90-day mortality, sepsis-related organ failure, ICU stay and frequency of hypoglycemia (glucose < 40mg/dl [<2.2 mmol/l]). The trial was stopped prematurely after reaching only ~2/3 of the projected enrollment due to an interim analysis that showed no difference in 28- or 90-day mortality between patients treated in the conventional arm versus those in the intensive arm (21.6% vs. 21.9%; 29.5 vs. 32.8%, respectively), but those in the intensive arm experienced a significantly greater amount of severe hypoglycemia (12.1 vs. 2.1%) (98).

The Normoglycemia in Intensive Care Evaluation and Surviving Using Glucose Algorithm Regulation (NICE-SUGAR) trial randomized over 6104 subjects to receive either conventional glycemic control to a target glucose <180 mg/dl [<10.0 mmol/l]) or intensive glycemic control (target 81 – 108 mg/dl [4.5 – 6.0 mmol/l]) reported no difference in hospital mortality, but found increased mortality at 90 days of follow-up (24.9% vs. 27.5%, p=0.02) (19). In a subsequent analysis of the trial, the NICE SUGAR investigators reported a higher frequency of hypoglycemia in the intensive arm (6.8% vs. 0.5%) and those with hypoglycemia had ~2-fold increase in mortality compared to patients without hypoglycemia (24).


Table 2. Clinical Trials of Intensive Glycemic Control in ICU Populations

Study Setting Population Percentage with diabetes Clinical Outcome
Malmberg, 1994 (104) CCU People with diabetes with suspected or confirmed acute MI 100 28% decrease mortality after 1 year
Furnary, 1999 (63)* CCU People with diabetes undergoing CABG 100 65% decrease in deep sternal wound infection rate
Van den Berghe, 2001 (96) Surgical ICU Mixed, with CABG 13 34% decrease in mortality
Furnary, 2003 (70)* CCU People with diabetes undergoing CABG 100 50% decrease in adjusted mortality rate
Krinsley, 2003 (62)* Medical and surgical ICU Mixed 22.4 27% decrease in mortality
Lazar, 2004 (105) Operating room and ICU People with diabetes undergoing CABG 100 60% decrease of post - operative atrial fibrillation
Van den Berghe, 2006 (97) Medical ICU Mixed 17 18% decrease mortality
Gandhi, 2007 (106) Operating Room Mixed, undergoing cardiac surgery 19.6 No difference in mortality; increase in stroke rate in the intensive treatment arm
VISEP, 2008 (98) Medical ICU Mixed, admitted with sepsis 30 No differences in 28-day or 90-day mortality, end-organ failure, length of stay
De La Rosa, 2008 (99) Medical and surgical ICU Mixed 12 No differences in 28-day mortality or infection rate
Glucontrol, 2009 (103) Medical and surgical ICU Mixed 18 No difference in 28-day mortality
NICE-SUGAR, 2009/2012 (19,24) Medical and surgical ICU Mixed 20 No difference in 90-day mortality
Boston Children’s (SPECS), 2012 (107,108) Cardiac ICU Cardiac surgery, people without diabetes 0 No differences in 30-day mortality, length of stay, in the cardiac ICU, length of hospital, duration of mechanical ventilation and vasoactive support, or measures of organ failure
ChiP, 2014 (109) [148] Pediatric ICU Critical illness/injury/major surgery, those without diabetes. 0 No difference in 30-day mortality. Increased hypoglycemia in the intensive treated group
CGAO–REA, 2014 (110,111) Medical ICU Mixed 23 No difference in 90-day mortality. Increased hypoglycemia in the intensive treated group
Okabayashi, 2014 (112)  Surgical ICU Mixed 25.3 Decreased surgical site infection in the intensive treated group

MI, myocardial infarction, ICU – Intensive Care Unit, CABG – Coronary artery bypass graft

*These are observational studies (reference 62, 63, 70) and all the other studies were randomized studies. Mixed – study enrolled those with and without diabetes

The GLUCO-CABG trial was a randomized open-label clinical study that included those with and without diabetes undergoing CABG who experienced perioperative hyperglycemia, defined as a glucose >140 mg/dl (>7.8 mmol/l) (60). A total of 302 people between 18 and 80 years of age were randomized to the intensive glycemic control group (target glucose 100 – 140 mg/dl [5.6 – 7.8 mmol/l]) or to conservative – or conventional – control (glucose 141 – 180 mg/dl [7.9 – 10.0 mmol/l]) in the ICU. After transition from ICU to the telemetry floor, patients were managed with a single treatment protocol aimed to maintain a glucose target <140 mg/dl (<7.8 mmol/l) before meals during the hospital stay. The primary outcome included differences between intensive and conservative glucose control on a composite of perioperative complications including sternal wound infection, bacteremia, respiratory failure, pneumonia, acute kidney injury, and major adverse cardiovascular events including acute coronary syndrome, stroke, heart failure and cardiac arrhythmias (60). The mean glucose during the ICU stay was 132±47 mg/dl (7.3±2.6 mmol/l) in the intensive and 152±17 mg/dl (8.4±1.0 mmol/l) in the conservative group. Intensive glucose treatment resulted in a 20% reduction in perioperative complications compared to the conservative group (42% vs. 52%; p=0.08). Of interest, there were no differences in the rate of complications among patients with diabetes treated with intensive or conservative regimens (49.3% vs. 45.8%, p=0.68); however, in patients without diabetes intensive treatment was associated with significantly lower rate of complications compared to the conservative group (35% vs. 58%, p=0.006) (60). Hospitalization costs were lower in the intensive group (median [IQR] $36,681 [28,488 – 46,074] vs. $40,913 [31,464 – 56,629], p=0.04), with an average total cost savings of $3,654 per case compared to conservative glucose control (113).

To date, no large studies have been conducted to determine if improved control in those not in an ICU may result in reduced morbidity and mortality in general medical and surgical patients.  For most people in the hospital with diabetes while there are observational data to show that dysglycemia is harmful, there were little data to show that improving glycemic control helps (114). A randomized controlled trial and a meta-analysis reported that improved glucose control may reduce hospital complications in general surgery patients (61). Improving glucose control with a basal bolus regimen resulted in a significant reduction in the frequency of composite complications including postoperative wound infection, pneumonia, bacteremia, and acute renal and respiratory failure (61). In that study, treatment with basal bolus insulin reduced average total inpatient costs per day by 14% or $751 compared to treatment with sliding scale alone (115).

HYPOGLYCEMIA

Hypoglycemia is the commonest side effect of treatment of all types of diabetes and stress hyperglycemia in the hospital setting. It presents a major barrier to satisfactory long-term glycemic control. Hypoglycemia results from an imbalance between glucose supply, glucose utilization and current insulin levels. Hypoglycemia is defined as a lower-than-normal level of blood glucose. For the purposes of hospital inpatients, hypoglycemia is defined as any glucose level <70 mg/dl (<3.9 mmol/l) (31,116). Severe hypoglycemia has been defined by many as <40 mg/dl (<2.2 mmol/l) (117). The incidence of severe hypoglycemia among the different trials ranged between 5% and 28% depending on the intensity of glycemic control in the ICU (118). Rates from trials using subcutaneous insulin in non-critically ill patients range from less than 1% to 33% (61,119,120). In 2017, the UK National Diabetes Inpatient Audit (NaDIA) data showed 18% of people with diabetes in hospital experienced one or more hypoglycemic episodes with a blood glucose <72mg/dl (<4.0 mmol/l) – down from 26% in 2011, with 7% (1 in 14) experiencing episodes requiring third party assistance to administer rescue therapy (121). The NaDIA data also showed that those with type 1 diabetes had the highest prevalence, with 25% experiencing a severe hypoglycemic episode (121). Furthermore 1.3% (1 in 80) of those in hospital with diabetes required some form of injectable rescue treatment (i.e. IV glucose or IM glucagon), down from 2.1% in 2011 (121). The same data showed that the highest proportion of episodes took place overnight (28%) between 05:00 and 09.00am when snack availability was likely to have been lowest (121).

The key predictors of hypoglycemic events in those hospitalized include older age, greater illness severity, diabetes, and the use of oral glucose lowering medications and/or insulin (122-124). In-hospital processes of care that contribute to risk for hypoglycemia include unexpected changes in nutritional intake that are not accompanied by associated changes in the glycemic management regimen (e.g., cessation of nutrition for procedures, adjustment in the amount of nutritional support), interruption of the established routine for glucose monitoring, deviations from the established glucose control protocols, and failure to adjust therapy when glucose is trending down or steroid therapy is being tapered (124-126). A common cause of inpatient hypoglycemia is insulin prescription errors including misreading poorly written prescriptions – when ‘U’ is used for units (i.e. 4U becoming 40 units) or confusing the insulin name with the dose (e.g. Humalog Mix25 becoming Humalog 25 units) (127).


Table 3 describes the most common risk factors for developing hypoglycemia in the hospital (124,128). However, other factors may also be involved, such as concurrent use of drugs with hypoglycemic agents e.g., warfarin, quinine, salicylates, fibrates, sulfonamides (including co-trimoxazole), monoamine oxidase inhibitors, NSAIDs, probenecid, somatostatin analogues, or selective serotonin reuptake inhibitors. Secondary causes of inpatient hypoglycemia include loss of counter-regulatory hormone function, e.g., Addison’s disease, growth hormone deficiency, hypothyroidism, or hypopituitarism.

Table 3. Common Risk Factors for Developing Hypoglycemia in the Hospital

Prior episode of hypoglycemia

Older age

Chronic kidney disease

Congestive heart failure

Liver Failure

Sepsis

Malnutrition

Erratic eating patterns / Nutritional interruptions / Lack of access to carbohydrates

Malignancies

Insulin regimen

Type 1 diabetes

Mental status changes

Certain concomitant use of medications

Duration of diabetes


The development of hypoglycemia is associated with poor hospital outcomes (25,97,100,102,103,129-136). Turchin et al examined data from 4,368 admission episodes for people with diabetes of which one third were on regular insulin therapy (25). Patients experiencing inpatient hypoglycemia experienced a 66% increased risk of death within one year and spent 2.8 days longer in hospital compared to those not experiencing hypoglycemia. The odds ratio (95% confidence interval) for mortality associated with one or more episodes was 2.28 (1.41-3.70, p=0.0008) among a cohort of 5,365 patients admitted to a mixed medical-surgical ICU (122). In a larger cohort of over 6,000 patients, hypoglycemia was associated with longer ICU stay and greater hospital mortality especially for patients with more than one episode of hypoglycemia (24). A 2019 systematic review and meta-analysis of hospital acquired hypoglycemia in non-ICU patients suggested that adults exposed to glucose levels <72mg/dl (<4.0 mmol/l) experienced a mean increased length of hospital stay of 4.1 days (95% CI 2.36 – 5.79) compared to those who did not experience hypoglycemia (129). The same dataset suggested an increased relative risk of in-hospital mortality for non-ICU patients of 2.09 (95% CI 1.64 – 2.67) (129). There was a non-significant reduction in mortality for those in the ICU of 0.75 (95% CI 0.49 – 1.16) (129). These data strengthen the argument to have potentially less strict glycemic targets for those not in the ICU (27). For example, if an individual has a glucose of 75 mg/dl (4.2 mmol/l), and is on an intravenous insulin infusion, by the time their bedside capillary glucose is next measured, they may have a glucose well below 72 mg/dl (4.0 mmol/l); thus, they may have potential harm. Indeed, data published from previous NaDIA surveys using data from over 100 hospitals across the UK showed several serious adverse events including seizures; permanent cerebral damage; cardiac arrests; and deaths. Insulin therapy was implicated in several of these events (28,137). The counter argument is that there are initiatives to reduce the risk of developing inpatient hypoglycemia and having national guidance has led to improved patient care overall (87,138).

Bedside point-of-care (POC) capillary glucose monitoring is recommended to assess glycemic control in hospitalized patients. Clinical guidelines recommend bedside capillary POC testing before meals and at bedtime to assess glycemic control and to adjust insulin therapy in the hospital (15). This approach; however, has been shown to fail to detect hypoglycemia, in particular nocturnal hypoglycemia and asymptomatic hypoglycemia, a common scenario in the hospital setting (139,140). Hence, the reported rates of inpatient hypoglycemia are significant and improved methods to monitor glycemic control in the hospital setting may reduce the risk of hypoglycemia. As mentioned, technological advances are currently being evaluated to allow the use of continuous glucose monitoring to help manage patients in the ICU and general wards (88-92).

Hypoglycemia has been associated with adverse cardiovascular outcomes, such as increased myocardial contractility, prolonged QT interval (possibly due to the rapid drop in potassium concentrations due to the increased circulating epinephrine and norepinephrine), ischemic electrocardiogram changes and repolarization abnormalities, angina, arrhythmias, increased inflammation, and sudden death, (43,141-143). The mechanisms for the poor outcome are not completely understood, but hypoglycemia has been associated with increases in pro-inflammatory cytokines (TNFα, IL-1β, IL-6, and IL-8), markers of lipid peroxidation, acute changes in endothelial dysfunction with associated vasoconstriction, increased blood coagulability, cellular adhesion, and oxidative stress (144-147).


Despite these observations, the direct causal effect of iatrogenic hypoglycemia on outcomes is still debatable. Kosiborod et al reported that spontaneous hypoglycemia, but not insulin – induced hypoglycemia was associated with higher in hospital mortality (133). Similarly, another study of 31,970 patients also reported that hypoglycemia is associated with increased in-hospital mortality, but the risk was limited to patients with spontaneous hypoglycemia and not to patients with drug-associated hypoglycemia (148). These studies raised the possibility that hypoglycemia, like hyperglycemia, and despite the biochemical and other changes described, is a marker of disease burden rather than a direct cause of death.

RECOMMENDATIONS FOR MANAGING HYPERGLYCEMIA IN THE HOSPITAL ENVIRONMENT

Knowledge of Diabetes Management Amongst Medical Staff

The burden on inpatient diabetes falls most frequently to junior medical staff who often have little or no specialist diabetes training. As such, it is perhaps not surprising that errors occur. In the UK, a survey of junior doctors showed that unlike other commonly encountered medical conditions, such as acute asthma or angina, their knowledge about and confidence in managing diabetes was significantly lower (149). In 2019, this was also shown in a multicenter study from the US – with the major difference being that the while most staff felt confident and comfortable managing diabetes, when challenged on how to manage certain situations, and in particular identifying glucose targets for those who were critically ill or the threshold for defining hypoglycemia, their confidence was far higher than their knowledge – a potentially devastating combination (150). Given the high prevalence of diabetes amongst hospital inpatients, basic diabetes management should be part of mandatory training.

Management of Inpatient Hyperglycemia in the ICU

Insulin is the best way to control hyperglycemia in the inpatient setting especially in the critically ill patient. A variable rate, intravenous insulin infusion is the preferred method to achieve the recommended glycemic target. The short half-life of intravenous insulin makes it ideal in this setting because of flexibility in the event of unpredicted changes in an individual’s health, medications, and nutrition.


When someone is identified as having hyperglycemia (blood glucose ≥180 mg/dl [≥10.0 mmol/l]), a variable rate intravenous insulin infusion should be started to maintain blood glucose levels <180 mg/dl (<10.0 mmol/l). A variety of intravenous infusion protocols have been shown to be effective in achieving glycemic control with a low-rate of hypoglycemic events, and in improving hospital outcomes (63,70,96,104,151-156). A proper protocol should allow flexible blood glucose targets modified based on the individuals’ clinical situation. Further, it should have clear instructions about the blood glucose threshold for initiating insulin infusion and the initial rate. The appropriate fluids should also be prescribed. It should be validated in order to avoid hyperglycemia if adjusted too slowly and hypoglycemia if adjusted too fast. Accurate insulin administration requires a reliable infusion pump that can deliver the insulin dose in increments of 0.1 unit per hour (118,154).


There is no ideal protocol for the management of hyperglycemia in the critically ill patient. In addition, there is no clear evidence demonstrating the benefit of one protocol/algorithm versus any other. The implementation of any of these algorithms requires close follow up by the nursing staff and is prone to human errors. Some institutions have developed computerized protocols that can be implemented in order to avoid errors in dosing (157-161). Essential elements that increase protocol success of continuous insulin infusion are: 1) rate adjustment that considers the current and previous glucose value and the current rate of insulin infusion, 2) rate adjustment that considers the rate of change (or lack of change) from the previous reading, and 3) frequent glucose monitoring (hourly until stable glycemia is established, and then every 2 – 3 hours) (118,152,162-164).


Several computer-based algorithms aiming to direct the nursing staff adjusting the insulin infusion rate have become commercially available (158-160,165). Retrospective cohorts have been reported, as well as controlled trials have reported a more rapid and tighter glycemic control with computer-guided algorithms than standard paper form protocols in ICU patients (157,159), as well as lower glycemic variability than patients treated with the standard insulin infusion regimens. Despite differences in glycemic control between insulin algorithms, another study showed no difference between computerized protocols versus conventional glucose control (110). Thus, most insulin algorithms appear to be appropriate alternatives for the management of hyperglycemia in critically ill patients, and the choice depends upon the physician’s preferences and cost considerations.

Managing Hyperglycemia in the Non-ICU Setting

Subcutaneous insulin is the preferred therapeutic agent for glucose control in those admitted to non-ICU settings (general medicine and surgery). Several studies have shown that the commonly used subcutaneous sliding scale insulin (SSI) is not acceptable as the single regimen in people with diabetes, because it results in undesirable levels of hypoglycemia and hyperglycemia (166-168). It has become evident in recent years that the use of scheduled subcutaneous insulin therapy with basal (e.g., glargine, detemir or degludec) once daily or with intermediate acting insulin (NPH) given twice daily alone or in combination with short (regular) or rapid acting insulin (lispro, aspart, glulisine) prior to meals is effective and safe for the management of most patients with hyperglycemia and diabetes (16,169).


The basal-bolus (prandial) insulin regimen is considered the physiologic approach as it addresses the three components of insulin requirement: basal (what is required in the fasting state), nutritional (what is required for peripheral glucose disposal following a meal), and supplemental (what is required for unexpected glucose elevations, or to dispose of glucose in hyperglycemia (169).


A prospective, randomized multi-center trial compared the efficacy and safety of a basal/bolus insulin regimen with sliding scale insulin in people with type 2 diabetes admitted to a general medicine service (119). The use of basal-bolus insulin regimen had greater improvement in blood glucose control than subcutaneous sliding scale alone. A blood glucose target <140 mg/dl (<7.8 mmol/l) was achieved in 66% of those in the glargine plus glulisine group and 38% in the sliding scale group (119). The incidence of hypoglycemia, defined as a glucose <60 mg/dl (<3.3 mmol/l), was less than 5% in those treated with basal bolus or SSI. A different study in general surgery inpatients also compared efficacy and safety of a basal bolus regimen to SSI in those with type 2 diabetes (61). The basal bolus regimen resulted in a significant improvement in glucose control and in a reduction in the frequency of the composite of postoperative complications including wound infection, pneumonia, respiratory failure, acute renal failure, and bacteremia.


The use of multi-dose human NPH and regular insulin has been compared to basal bolus treatment with insulin analogs in an open-label, controlled, multicenter trial in 130 medical admissions with type 2 diabetes (170). This study found that both treatment regimens resulted in significant improvements in inpatient glycemic control with a glucose target of <140 mg/dl (<7.8 mmol/l) before meals, as well as no difference in the rate of hypoglycemic events. Thus, it appears that similar improvement in glycemic control can be achieved with either basal bolus therapy with insulin analogs or with NPH/regular human insulin in people with type 2 diabetes.


Most people in the hospital have reduced caloric intake due to lack of appetite, medical procedures or surgical intervention. In the Basal Plus trial people with type 2 diabetes who were treated with diet, oral antidiabetic agents, or low-dose insulin (≤ 0.4 unit/kg/day) prior to admission were randomized to receive a standard basal bolus regimen with glargine once daily and glulisine before meals or a single daily dose of glargine. In addition, supplemental doses of glulisine were administered for correction of hyperglycemia (>140 mg/dl [>7.8 mmol/l]) per sliding scale (171). This study reported that the basal approach resulted in similar improvement in glycemic control and in the frequency of hypoglycemia compared to a standard basal bolus regimen (171). Thus, in insulin naive individuals or in those receiving low-dose insulin on admission, as well as those with reduced oral intake, the use of a basal plus regimen is an effective alternative to basal bolus.


The recommended total daily insulin dose for most people should start between 0.3 to 0.5 units per Kg (119,126,172,173). Starting doses greater than 0.6 – 0.8 unit/kg/day have been associated with 3-fold higher odds of hypoglycemia than doses lower than 0.2 U/kg/day. In elderly individuals or those with impaired renal function, lower initial daily doses (≤ 0.3 units/kg) may lower the risk of hypoglycemia (174).

Hospital Use of Non-Insulin Therapy in Non-Critical Care Settings

There are several other classes of non-insulin glucose lowering agents that have been tried in the hospital setting. However, most are not suitable for use. Metformin, while first line for type 2 diabetes in the outpatient setting may not be appropriate where there is any evidence of dehydration or renal impairment. Thiazolidinediones are excellent at lowering glucose, but they take several weeks to reach their maximum effect, may precipitate heart failure, and may cause peripheral oedema due to the fluid retention (175). Thus they are not suitable for the inpatient setting (176). Sulfonylureas work rapidly, and are often the drugs of choice for worsening of diabetes in an outpatient setting (177). However, they increase the risk of hypoglycemia. There are data to show that they remain one of the most frequent causes of inpatient hypoglycemia, thus extending length of hospital stay and increased risk of inpatient mortality (121,178).


Oral glucose lowering medication use is limited by the delay and unpredictability of onset of action and there is also concern regarding the cardiovascular effects with sulfonylureas and the inability to use metformin in patients with renal or liver dysfunction (15,179). Recent work using the sodium-glucose co-transporter 2 inhibitor dapagliflozin for corticosteroid-induced hyperglycemia in acute exacerbation of COPD failed to demonstrate an improvement in hyperglycemia (180).

The use of oral antidiabetic agents was not recommended in previous guidelines because of the lack of safety and efficacy studies in the inpatient setting (16). However, increasing evidence indicates that treatment with dipeptidyl peptidase-4 (DPP4) inhibitors, alone or in combination with basal insulin, is safe and effective in general medicine and surgery patients with mild to moderate hyperglycemia. In a pilot study, in general medicine and surgery patients with a blood glucose between 140 and 400 mg/dl (7.8 – 22.2 mmol/l) treated with diet, oral antidiabetic drugs, or low- dose insulin (≤0.4 U/kg/day) who were randomized to sitagliptin once daily, sitagliptin and basal insulin, or basal bolus insulin (181). All groups received correction doses of lispro before meals and bedtime for blood glucose >140 mg/dl (>7.8 mmol/l). In those with mild-moderate hyperglycemia (<180 mg/dl [<10 mmol/l]), the use of sitagliptin plus supplemental (correction doses) or in combination with basal insulin resulted in no significant differences in mean daily blood glucose, frequency of hypoglycemia, or in the number of treatment failures compared to a basal bolus regimen (181). The SITA-HOSPITAL trial, a multicenter, randomized controlled study in 279 general medicine and surgery patients with type 2 diabetes previously treated with oral anti-diabetic agents or low-dose insulin (<0.6 U/kg/d) also reported similar glycemic control, hypoglycemia rate, hospital length-of-stay, treatment failures, or hospital complications (including acute kidney injury or pancreatitis) between the combination of oral sitagliptin plus basal insulin to the more labor-intensive basal-bolus insulin regimen (182).


In 2020 a pooled analysis from three prospective studies using DPP4-i in general medicine and surgery patients with type 2 diabetes reported that treatment with DPP4-i alone or with basal insulin plus correctional doses with rapid-acting insulin for glucose >140mg/dl. reported no differences in mean hospital daily blood glucose, percentage of glucose readings within target of 70-180 mg/dl, length of stay, or complications. Importantly there was less hypoglycemia with DPP4-i compared to basal bolus insulin regimen (183).

Glucose Monitoring in the Hospital

All patients admitted to the hospital with a diagnosis of diabetes and those with newly discovered hyperglycemia should be monitored closely (38). The frequency of monitoring and the schedule of the blood glucose checks will depend on the nutritional intake, patient treatment, and schedule of insulin. There is some controversy regarding the best method to monitor blood glucose. However, considering the convenience and wide availability of the capillary point of care (POC) testing we suggest this as the best approach as long as it is done with a monitoring device that has demonstrated accuracy (184,185). It is important that when using POC blood glucose meters, that several things be kept in mind, in particular overall clinical conditions that might affect the POC value such as hemoglobin level, perfusion, and medications. Table 4 summarizes potential schedules for blood glucose monitoring based on the patient’s nutritional intake and medical regimen.


Several studies have reported on the efficacy of continuous glucose monitoring (CGM) in insulin treated patients in the hospital (88-92). The CGM devices provide estimated glucose values every 5-15 minutes resulting in a better assessment of glycemic control than capillary POC testing (186-188). Recent observational studies have shown increased detection of hypoglycemic events using CGM in the hospital in insulin treated patients (139,189). Additionally, a recent randomized trial by Singh et al. showed the ability of CGM to prevent and reduce hypoglycemia in high-risk hospitalized patients with diabetes through the use of remote CGM alarms (190). There are some concerns including the accuracy of CGM data when acute physiologic disturbances are present (i.e., hypoxemia, vasoconstriction, and rapidly changing glucose levels in diabetic ketoacidosis) or interference with glucose readings (such as salicylic acid, acetaminophen). They should also be removed for certain procedures – with each company having their own list –such as MRIs, CT scans, and diathermy. The use of CGM in the hospital has not been approved by regulatory agencies and remains investigational. Ongoing studies (NCT03832907) with factory-calibrated CGM are testing its accuracy in diverse inpatient populations and the use of a Glucose Telemetry System (GTS) with which glucose values can be wirelessly transmitted from the patient's bedside (CGMS) to a monitor device at the nursing station (NCT03508934, NCT03877068).


Table 4. Glucose Monitoring Schedule Based on Nutritional Intake, Insulin Regimen, and Special Patient Situations

Diet

Regimen

Glucose monitoring

Special caveats

NPO

Intravenous insulin infusion

Every 1-2 hrs


NPO

SC regular insulin every 6 hrs (6 am, noon, 6pm, midnight)

Every 6 hrs (6 am, noon, 6pm, midnight) prior to SC insulin dose


NPO

Basal insulin alone (e.g., glargine or detemir)

Every 6 hrs (6 am, noon, 6pm, midnight)


Eating 3 meals per day

Basal/bolus regimen with long acting (e.g., glargine, detemir) and rapid- acting insulin with meals (aspart, lispro, glulisine)

4 times per day: before breakfast, before lunch, before evening meal, and bedtime.

Consider a 3 am blood glucose check in those at risk of hypoglycemia

Nocturnal tube feeds and daytime oral intake

Regimen varies depending on clinical status. Basal insulin plus corrections or basal bolus with long and rapid-acting insulin.

Basal in AM and low- dose NPH insulin at the start of the nocturnal tube feeds

5 times per day: before breakfast, before lunch, before evening meal, bedtime and 3 am.


Continuous tube feeds

Basal insulin plus correction with regular insulin every 4-6 hours. NPH 2 or 3 times daily or regular insulin every 6 hrs

Every 6 hrs (6 am, noon, 6pm, midnight)


Patients eating small multiple meals per day. (e.g., cystic fibrosis)

Basal/bolus with long-acting insulin and rapid – acting insulin with meals – e.g. (carbohydrate counting)

At least 4 times per day: before breakfast, before lunch, before evening meal, and bedtime

More frequent checks might be warranted in order to include post prandial blood glucose

Those on high dose corticosteroids

Basal/bolus with long-acting insulin and rapid-acting insulin with meals. May add small dose of NPH to basal bolus regimen in those on morning dose of steroids.

AM dose of NPH may be used without basal insulin in persons on intermediate acting steroids (prednisone, methylprednisone) administered once daily

4 times per day: before breakfast, before lunch, before evening meal, and bedtime


NPO or eating 3 meals per day

Those on insulin pumps

4-8 times per day: before breakfast, before lunch, before evening meal, and bedtime. Consider post-prandial checks


NPO – nothing by mouth. NPH – Neutral Protamine Hagedorn, SC - subcutaneous

Medical Nutrition Therapy (MNT) in Hospitalized Patients with Diabetes

Medical nutrition therapy is a key component of the comprehensive management of diabetes and hyperglycemia in the inpatient setting. Maintaining adequate nutrition is important for glycemic control and to meet adequate caloric demands. Caloric demand in acute illness will differ from that in the outpatient setting. Achieving the proper nutritional balance in the inpatient setting is challenging. Anyone admitted to the hospital with diabetes or hyperglycemia should be assessed to determine the need for a modified diet in order to meet caloric demand.


The general approach to address MNT in the inpatient setting is usually based on expert opinions and patient need. There is limited data regarding what is the best approach or method to achieve the ideal caloric supply. To determine the best approach, method, and caloric needs of their patients, providers should work closely with a nutrition professional.


All patients with diabetes or hyperglycemia should receive an individualized assessment. In general, most patients will receive adequate caloric needs with 3 discrete meals per day. Further, the metabolic need for patients with diabetes is usually provided by 25 to 35 calories/kg where some critically ill patients might require less than 15 to 25 calories/kg per day (191). A consistent carbohydrate meal-planning system might help to facilitate glycemic control and insulin dosing in the inpatient setting. Most patients will require 1,500-2000 calories per day with 12-15 grams of carbohydrates per meal (15). Ideally, the carbohydrates should come from low glycemic index foods such as whole grains and vegetables.


Those individuals not able to achieve these goals should be evaluated in order to determine the need for enteral or parenteral nutrition. Enteral nutrition is the second-best option after oral nutrition and should be preferred over parenteral nutrition in hospitalized individuals (192,193). There are several advantages of enteral feeding versus parenteral feeding including: low cost, low risk of complications, physiologic route, less risk for gastric mucosa atrophy, and lower risk of infectious and thrombotic complications compared with the latter form of therapy (192,194). The benefit of parental nutrition has been documented in the critically ill patient. However, some research has shown a detrimental effect on patients with diabetes and hyperglycemia. Parental nutrition should be considered only in patients that are not able to receive enteral nutrition and should be coordinated with the institution parenteral nutrition team.


Enteral and parenteral nutrition can prevent the effects of starvation and malnutrition (192). The preference for use of EN over PN whenever possible is due to a lower risk of infectious and thrombotic complications (194,195). Standard enteral formulas reflect the reference values for macro- and micronutrients for a healthy population and contain 1-2 cal/ml. Most standard formulas contain whole protein, lipid in the form of long-chain triglycerides, and carbohydrates. Standard diabetes-specific formulas provide low amounts of lipids (30% of total calories) combined with a high carbohydrates (HCH) content (55–60% of total calories); however, newer diabetic formulas have replaced part of the carbohydrates with monounsaturated fatty acids (up to 35% of total calories) and also include 10-15 g/l dietary fiber and up to 30% fructose (196,197).


Diabetic enteral formulas containing low-carbohydrate high–monounsaturated fatty acids (LCHM) are preferable to standard high-carbohydrate formulas in hospitalized patients with type 1 and type 2 diabetes (196,198). A meta-analysis of studies comparing relatively newer enteral low-carbohydrate high-monounsaturated fatty acid (LCHM) formulas with older formulations, the postprandial rise in blood glucose was reduced by 18- 29 mg/dl with the newer formulations (198). Table 5 depicts the composition of standard and diabetic specific enteral formulas commonly used in hospitalized patients.


Table 5. Composition of Standard and Diabetic Specific Enteral Formulas Commonly Used in Hospitalized Patients in the USA


Calories (kcal/mL)

Carbohydrate (g/l)

Fat (g/l)

Protein (g/l)

Manufacture

Standard formula


Jevity® 1.0 Cal

1.0

155

35

44

Abbott Nutrition

Nutren® 1.0

1.0

127

38

40

Nestle Nutrition

Osmolite® 1.2 Cal

1.2

158

39

55

Abbott Nutrition

Jevity® 1.2

1.2

169

39

56

Nestle Nutrition

Fibersource® HN

1.2

160

39

53

Nestle Nutrition

Isosource® 1.5 Cal

1.5

170

65

68

Nestle Nutrition

Jevity® 1.5

1.5

216

50

64

Nestle Nutrition

Diabetes specific formula

Glucerna® 1.0 Cal

1.0

96

54

42

Abbott Nutrition

Nutren® Glytrol®

1.0

100

48

45

Nestle Nutrition

Glucerna® 1.2 Cal

1.2

115

60

60

Abbott Nutrition

Diabetisource® AC

1.2

100

59

60

Nestle Nutrition

Glucerna® 1.5 Cal

1.5

133

75

82

Abbott Nutrition


The UK Joint British Diabetes Societies has produced specific guidelines for the management of diabetes in those who are parenterally fed (193).

Corticosteroid Therapy – Impact on Blood Glucose

Steroid use in hospitalized patients is common. A single center cross sectional study showed that 12.8% of all the people in the hospital were on glucocorticoids (199). Steroids may be administered by various regimes and at variable doses. A single daily dose of steroid (e.g., prednisolone/prednisone) in the morning may be the commonest mode of administration (177,199,200). In susceptible individuals, this will often result in a rise in blood glucose by late morning that continues through to the evening. Overnight the blood glucose generally often falls back to baseline levels by the next morning. Thus, treatment should be tailored to treating the hyperglycemia, while avoiding nocturnal and early morning hypoglycemia. Multiple daily doses of steroid, be it intravenous hydrocortisone or oral dexamethasone, can cause a hyperglycemic effect throughout the 24-hour period. It may be, however that a twice daily premixed or basal bolus regimen may need to be started if oral medication, or once daily insulin proves insufficient to control hyperglycemia. Close attention will therefore need to be paid to blood glucose monitoring and early intervention may be necessary.


Glucose levels in most individuals can be predicted to rise approximately 4 to 8 hours following the administration of oral steroids, and sooner following the administration of intravenous steroids. Again, capillary blood glucose monitoring is paramount to guide appropriate therapeutic interventions. Conversely, glucose levels may improve to pre-steroid levels 24 hours after intravenous steroids are discontinued. If oral steroids are weaned down over several weeks, the glucose levels may decline in a dose dependent fashion, but this may not occur, particularly in those with pre-existing undiagnosed diabetes.


At the commencement of steroid therapy, or for those already on a supraphysiological dose of corticosteroid, capillary blood glucose testing should occur before meals and at bedtime, in particular before lunch or evening meal, when the hyperglycemic effects of a morning dose of steroid is likely to be greatest.


It is likely that subcutaneous insulin using a basal, or multiple daily injection regimen will be the most appropriate choice to achieve glycemic control in the event of hyperglycemia for the majority of patients. Morning administration of basal human insulin may closely fit the glucose excursion induced by a single morning dose of oral steroid. Basal analogue insulin may be appropriate if hyperglycemia is present for more prolonged periods. However, care should be taken to identify and protect against hypoglycemia overnight and in the early morning if long-acting insulin analogues are used in this context. Subsequent titration of the insulin dose   may be required to allow maintenance of glucose control in the face of increasing or decreasing steroid dose.


When a patient is discharged from the hospital on steroid therapy, a clear strategy for the management of hyperglycemia or potential hyperglycemia, and the titration of therapy to address the hyperglycemia, should be communicated to the community diabetes team and primary care team. Patients commenced on steroids as an inpatient and discharged after a short stay with the intention of continuing high dose steroids, should receive standard education in regard to diabetes, encompassing the risks associated with hyperglycemia and hypoglycemia.

Closed-Loop Technology 

Recent studies have reported that closed-loop systems, also referred to as artificial pancreas or automated insulin delivery systems have reported good efficacy with improved time in target and lower mean daily blood glucose without an increased rate of hypoglycemia in the ICU (201,202) and in non-ICU settings (203,204). In one non-ICU study, the time in target range between 100-180 mg/dl (5.6-10.0 mmol/l) was reported to be 59.8% in patients using the closed-loop technology compared to 38.1% with standard subcutaneous insulin regimen (204). Similarly, a closed-loop study in patients receiving nutritional support also reported higher time in target glucose range (68% vs 36.4%) and lower mean glucose values (153 vs 205 mg/dl [8.5-11.4 mmol/l]) compared to a standard insulin regimen (205). Same as the use of CGM in the hospital, treatment with artificial pancreas is experimental and larger studies are needed to prove safety and efficacy in ICU and non-ICU settings.

REFERENCES

  1. Federation ID. IDF atlas 9th edition. 2019; https://www.diabetesatlas.org/en/.
  2. Prevention CfDCa. National diabetes statistics report 2020. Estimates of diabetes and its burden in the United States. 2020; https://www.cdc.gov/diabetes/pdfs/data/statistics/national-diabetes-statistics-report.pdf.
  3. Boyle JP, Thompson TJ, Gregg EW, Barker LE, Williamson DF. Projection of the year 2050 burden of diabetes in the US adult population: dynamic modeling of incidence, mortality, and prediabetes prevalence. Population Health Metrics 2010; 8:29
  4. Pournaras DJ, Photi ES, Barnett N, Challand CP, Chatzizacharias NA, Dlamini NP, Doulias T, Foley A, Hernon J, Kumar B, Martin J, Nunney I, Panagiotopoulou I, Sengupta N, Shivakumar O, Sinclair P, Stather P, Than MM, Wells AC, Xanthis A, Dhatariya K. Assessing the quality of primary care referrals to surgery of patients with diabetes in the East of England: A multi-centre cross-sectional cohort study. International Journal of Clinical Practice 2017; 71:e12971
  5. Jiang HJ, Stryer D, Friedman B, Andrews R. Multiple hospitalizations for patients with diabetes. Diabetes Care 2003; 26:1421-1426
  6. Donnan PT, Leese GP, Morris AD. Hospitalizations for people with type 1 and type 2 diabetes compared with the nondiabetic population of Tayside, Scotland: a retrospective cohort study of resource use. Diabetes Care 2000; 23:1774-1779
  7. Harding JL, Benoit SR, Gregg EW, Pavkov ME, Perreault L. Trends in rates of infections requiring hospitalization among adults with versus without diabetes in the U.S., 2000 - 2015. Diabetes Care 2020; 43:106-116
  8. Umpierrez GE, Isaacs SD, Bazargan N, You X, Thaler LM, Kitabchi AE. Hyperglycemia: An independent marker of in-hospital mortality in patients with undiagnosed diabetes. Journal of Clinical Endocrinology Metabolism 2002; 87:978-982
  9. Digital N. National Diabetes Inpatient Audit (NaDIA) - 2018. 2019; https://digital.nhs.uk/data-and-information/publications/statistical/national-diabetes-inpatient-audit/2018.
  10. Sampson MJ, Dozio N, Ferguson B, Dhatariya K. Total and excess bed occupancy by age, speciality and insulin use for nearly one million diabetes patients discharged from all English Acute Hospitals. Diabetes Research & Clinical Practice 2007; 77:92-98
  11. Association AD. Economic costs of diabetes in the U.S. in 2017. Diabetes Care 2018; 41:917-928
  12. Prevention CfDCa. National vital statistics report. Deaths: Final data for 2017. 2019; 9:https://www.cdc.gov/nchs/data/nvsr/nvsr68/nvsr68_09-508.pdf, 68.
  13. Bommer C, Heesemann E, Sagalova V, Manne-Goehler J, Atun R, Barnighausen T, Vollmer S. The global economic burden of diabetes in adults aged 20-79 years: a cost-of-illness study. Lancet Diabetes and Endocrinology 2017; 5:423-430
  14. Bommer C, Sagalova V, Heesemann E, Manne-Goehler J, Atun R, Barnighausen T, Davies J, Vollmer S. Global economic burden of diabetes in adults: Projections from 2015 to 2030. Diabetes Care 2018; 41:963-970
  15. Umpierrez GE, Hellman R, Korytkowski MT, Kosiborod M, Maynard GA, Montori VM, Seley JJ, Van den Berghe G. Management of hyperglycemia in hospitalized patients in non-critical care setting: An Endocrine Society clinical practice guideline. Journal of Clinical Endocrinology Metabolism 2012; 97:16-38
  16. Moghissi ES, Korytkowski MT, Dinardo MM, Hellman R, Hirsch IB, Inzucchi S, Ismail-Beigi F, Kirkman MS, Umpierrez GE. American Association of Clinical Endocrinologists and American Diabetes Association consensus statement on inpatient glycemic control. Diabetes Care 2009; 32:1119-1131
  17. Dhatariya K, Mustafa OG, Rayman G. Safe care for people with diabetes in hospital. Clinical Medicine 2020; 20:21-27
  18. Sampson M. A good inpatient diabetes service. https://abcd.care/sites/abcd.care/files/resources/A_good_Inpatient%20Service_FINAL_Aug_19.pdf 2019; https://abcd.care/sites/abcd.care/files/resources/A_good_Inpatient%20Service_FINAL_Aug_19.pdf.
  19. investigators NSs. Intensive versus conventional glucose control in critically ill patients. New England Journal of Medicine 2009; 360:1283-1297
  20. Hulkower RD, Pollack RM, Zonszein J. Understanding hypoglycemia in hospitalized patients. Diabetes Management (Lond) 2014; 4:165-176
  21. McDonnell ME, Umpierrez GE. Insulin therapy for the management of hyperglycemia in hospitalized patients. Endocrinology & Metabolism Clinics of North America 2012; 41:175-201
  22. Qaseem A, Humphrey LL, Chou R, Snow V, Shekelle P, Physicians ftCGCotACo. Use of intensive insulin therapy for the management of glycemic control in hospitalized patients: A clinical practice guideline from the American College of Physicians. Annals of Internal Medicine 2011; 154:260-267
  23. Cook CB, Kongable GL, Potter DJ, Abad VJ, Leija DE, Anderson M. Inpatient glucose control: a glycemic survey of 126 U.S. hospitals. Journal of Hospital Medicine 2009; 4:E7-E14
  24. investigators NSs. Hypoglycemia and risk of death in critically ill patients. New England Journal of Medicine 2012; 367:1108-1118
  25. Turchin A, Matheny ME, Shubina M, Scanlon JV, Greenwood B, Pendergrass ML. Hypoglycemia and clinical outcomes in patients with diabetes hospitalized in the general ward. Diabetes Care 2009; 32:1153-1157
  26. Yamada T, Shojima N, Noma H, Yamauchi T, Kadowaki T. Glycemic control, mortality, and hypoglycemia in critically ill patients: a systematic review and network meta-analysis of randomized controlled trials. Intensive Care Medicine 2017; 43:1-15
  27. Levy N, Hall GM. National guidance contributes to the high incidence of inpatient hypoglycaemia. Diabetic Medicine 2019; 36:120-121
  28. Digital N. National Diabetes Inpatient Audit - Harms, 2019. 2019; https://digital.nhs.uk/data-and-information/clinical-audits-and-registries/national-diabetes-in-patient-audit-nadia-harms.
  29. Handelsman Y, Bloomgarden ZT, Grunberger G, Umpierrez G, Zimmerman RS, Bailey TS, Blonde L, Bray GA, Cohen AJ, Dagogo-Jack S, Davidson JA, Einhorn D, Ganda AP, Garber AJ, Garvey WT, Henry RR, Hirsch IB, Horton ES, Hurley DL, Jellinger PS, Jovanovic L, Lebovitz HE, LeRoith D, Levy P, McGill JB, Mechanick JI, Mestman JH, Moghissi ES, Orzeck EA, Pessah-Pollack R, Rosenblit PD, Vinik AI, Wyne K, Zangeneh F. American Association of Clinical Endocrinologists and American College of Endocrinology - clinical practice guidelines for developing a diabetes mellitus comprehensive care plan - 2015. Endocrine Practice 2015; 21:1-87
  30. Jacobi J, Bircher N, Krinsley J, Agus M, Braithwaite SS, Duutschman C, Freire AX, Geehan D, Kohl B, Nasraway SA, Rigby M, Sands K, Schallom L, Taylor B, Umpierrez G, Mazuski J, Schunemann H. Guidelines for the use of an insulin infusion for the management of hyperglycemia in critically ill patients. Critical Care Medicine 2012; 40:3251-3276
  31. Association AD. Diabetes care in the hospital: Standards of medical care in diabetes - 2020. Diabetes Care 2020; 43:S193-S202
  32. Kitabchi AE, Umpierrez GE, Miles JM, Fisher JN. Hyperglycemic crises in adult patients with diabetes. Diabetes Care 2009; 32:1335-1343
  33. Swanson C, Potter D, Kongable G, Cook C. Update on inpatient glycemic control in hospitals in the United States. Endocrine Practice 2017; 17:853-861
  34. Schmeltz LR, DeSantis AJ, Thiyagarajan V, Schmidt K, Shea-Mahler E, Johnson D, Henske J, McCarthy PM, Gleason TG, McGee EC, Molitch ME. Reduction of surgical mortality and morbidity in diabetic patients undergoing cardiac surgery with a combined intravenous and subcutaneous insulin glucose management strategy. Diabetes Care 2007; 30:823-828
  35. Carpenter DL, Gregg SR, Xu K, Buchman TG, Coopersmith CM. Prevalence and impact of unknown diabetes in the ICU. Critical Care Medicine 2015; 43:e541-e550
  36. Van Ackerbroeck S, Schepens T, Janssens K, Jorens PG, Verbrugge W, Collet S, Van Hoof V, Van Gaal L, De Block C. Incidence and predisposing factors for the development of disturbed glucose metabolism and DIabetes mellitus AFter Intensive Care admission: the DIAFIC study. Critical Care 2015; 19:355
  37. Kar P, Plummer MP, Ali Abdelhamid Y, Giersch EJ, Summers MJ, Weinel LM, Finnis ME, Phillips LK, Jones KL, Horowitz M, Deane AM. Incident diabetes in survivors of critical illness and mechanisms underlying persistent glucose intolerance: A prospective cohort study. Critical Care Medicine 2019; 47:e103-e111
  38. Dhatariya K, James J, Kong M-F, Berrington R. Diabetes at the front door. A guideline for dealing with glucose related emergencies at the time of acute hospital admission from the Joint British Diabetes Society (JBDS) for Inpatient Care Group. Diabetic Medicine 2020; 37:1578-1589
  39. Pasquel FJ, Gomez-Huelgas R, Anzola I, Oyedokun F, Haw JS, Vellanki P, Peng L, Umpierrez GE. Predictive value of admission hemoglobin A1c on inpatient glycemic control and response to insulin therapy in medicine and surgery patients with type 2 diabetes. Diabetes Care 2015; 38:e202-e203
  40. Greci LS, Kailasam M, Malkani S, Katz DL, Hulinsky I, Ahmadi R, Nawaz H. Utility of HbA1c levels for diabetes case finding in hospitalized patients with hyperglycemia. Diabetes Care 2003; 26:1064-1068
  41. Mazurek JA, Hailpern SM, Goring T, Nordin C. Prevalence of hemoglobin A1c greater than 6.5% and 7.0% among hospitalized patients without known diagnosis of diabetes at an urban inner city hospital. Journal of Clinical Endocrinology & Metabolism 2010; 95:1344-1348
  42. Cryer PE. Hypoglycemia, functional brain failure, and brain death. Journal of Clinical Investigation 2014; 117:868-870
  43. Amiel SA, Aschner P, Childs B, Cryer PE, de Galan BE, Frier BM, Gonder-Frederick L, Heller SR, Jones T, Khunti K, Leiter LA, Luo Y, McCrimmon RJ, Pedersen-bjergaard U, Seaquist ER, Zoungas S. Hypoglycaemia, cardiovascular disease, and mortality in diabetes: epidemiology, pathogenesis, and management. Lancet Diabetes & Endocrinology 2019; 7:385-396
  44. Corssmit EP, Romijn JA, Sauerwein HP. Regulation of glucose production with special attention to nonclassical regulatory mechanisms: A review. Metabolism 2014; 50:742-755
  45. Boden G. Gluconeogenesis and glycogenolysis in health and diabetes. Journal of Investigative Medicine 2004; 52:375-378
  46. van de Werve G, Jeanrenaud B. Liver glycogen metabolism: An overview. Diabetes/Metabolism Reviews 1987; 3:47-78
  47. Gerich JE, Lorenzi M, Bier DM, Tsalikian E, Schneider V, Karam JH, Forsham PH. Effects of physiologic levels of glucagon and growth hormone on human carbohydrate and lipid metabolism. Studies involving administration of exogenous hormone during suppression of endogenous hormone secretion with somatostatin. Journal of Clinical Investigation 1976; 57:875-884
  48. Rizza RA, Mandarino LJ, Gerich JE. Dose-response characteristics for effects of insulin on production and utilization of glucose in man. American Journal of Physiology - Endocrinology & Metabolism 1981; 240:E630-E639
  49. Dungan KM, Braithwaite SS, Preiser J-C. Stress hyperglycaemia. Lancet 2009; 373:1798-1807
  50. McCowen KC, Malhotra A, Bistrian BR. Stress-induced hyperglycemia. Critical Care Clinics 2001; 17:107-124
  51. Stentz FB, Umpierrez GE, Cuervo R, Kitabchi AE. Proinflammatory cytokines, markers of cardiovascular risks, oxidative stress, and lipid peroxidation in patients with hyperglycemic crises. Diabetes 2004; 53:2079-2086
  52. Chaudhuri A, Umpierrez GE. Oxidative stress and inflammation in hyperglycemic crises and resolution with insulin: implications for the acute and chronic complications of hyperglycemia. Journal of Diabetes and its Complications 2012; 26:257-258
  53. Reyes-Umpierrez D, Davis G, Cardona S, Pasquel FJ, Peng L, Jacobs S, Vellanki P, Fayfman M, Haw S, Halkos M, Guyton RA, Thourani VH, Umpierrez GE. Inflammation and oxidative stress in cardiac surgery patients treated to intensive versus conservative glucose targets. Journal of Clinical Endocrinology & Metabolism 2016; 102:309-315
  54. Esposito K, Nappo F, Marfella R, Giugliano G, Giugliano F, Ciotola M, Quagliaro L, Ceriello A, Giugliano D. Inflammatory cytokine concentrations are acutely increased by hyperglycemia in humans: Role of oxidative stress. Circulation 2002; 106:2067-2072
  55. Fan J, Li YH, Wojnar MM, Lang CH. Endotoxin-induced alterations in insulin-stimulated phosphorylation of insulin receptor, IRS-1, and MAP kinase in skeletal muscle. Shock 1996; 6:164-170
  56. Evans NR, Dhatariya KK. Assessing the relationship between admission glucose levels, subsequent length of hospital stay, readmission and mortality. Clinical Medicine, Journal of the Royal College of Physicians 2012; 12:137-139
  57. Haddadin F, Clark A, Evans N, Dhatariya K. Admission blood glucose helps predict 1 year, but not 2 years, mortality in an unselected cohort of acute general medical admissions. International Journal of Clinical Practice 2014; 69:643-648
  58. Frisch A, Chandra P, Smiley D, Peng L, Rizzo M, Gatcliffe C, Hudson M, Mendoza J, Johnson R, Lin E, Umpierrez GE. Prevalence and clinical outcome of hyperglycemia in the perioperative period in noncardiac surgery. Diabetes Care 2010; 33:1783-1788
  59. Kotagal M, Symons RG, Hirsch IB, Umpierrez GE, Dellinger EP, Farrokhi ET, Flum DR. Perioperative hyperglycemia and risk of adverse events among patients with and without diabetes. Annals of Surgery 2016; 261:97-103
  60. Umpierrez G, Cardona S, Pasquel F, Jacobs S, Peng L, Unigwe M, Newton CA, Smiley-Byrd D, Vellanki P, Halkos M, Puskas JD, Guyton RA, Thourani VH. Randomized controlled trial of intensive versus conservative glucose control in patients undergoing coronary artery bypass graft surgery: GLUCO-CABG trial. Diabetes Care 2015; 38:1665-1672
  61. Umpierrez GE, Smiley D, Jacobs S, Peng L, Temponi A, Mulligan P, Umpierrez D, Newton C, Olson D, Rizzo M. Randomized study of basal-bolus insulin therapy in the inpatient management of patients with type 2 diabetes undergoing general surgery (RABBIT 2 Surgery). Diabetes Care 2011; 34:256-261
  62. Krinsley JS. Association between hyperglycemia and increased hospital mortality in a heterogeneous population of critically ill patients. Mayo Clinic Proceedings 2003; 78:1471-1478
  63. Furnary AP, Zerr KJ, Grunkemeier GL, Starr A. Continuous intravenous insulin infusion reduces the incidence of deep sternal wound infection in diabetic patients after cardiac surgical procedures. Annals of Thoracic Surgery 1999; 67:352-362
  64. Montori VM, Bistrian BR, McMahon MM. Hyperglycemia in acutely ill patients. JAMA 2002; 288:2167-2169
  65. Falciglia M, Freyberg RW, Almenoff PL, D'Alessio DA, Render ML. Hyperglycemia-related mortality in critically ill patients varies with admission diagnosis. Critical Care Medicine 2009; 37:3001-3009
  66. Bruno A, Gregori D, Caropreso A, Lazzarato F, Petrinco M, Pagano E. Normal glucose values are associated with a lower risk of mortality in hospitalized patients. Diabetes Care 2008; 31:2209-2210
  67. Blaha J, Mraz M, Kopecky P, Stritesky M, Lips M, Matias M, Kunstyr J, Porizka M, Kotulak T, Kolnikova I, Simanovska B, Zakharchenko M, Rulisek J, Sachl R, Anyz J, Novak D, Linder J, Hovorka R, Svacina S, Haluzik M. Perioperative tight glucose control reduces postoperative adverse events in nondiabetic cardiac surgery patients. Journal of Clinical Endocrinology & Metabolism 2015; 100:3081-3089
  68. McAlister FA, Majumdar SR, Blitz S, Rowe BH, Romney J, Marrie TJ. The relation between hyperglycemia and outcomes in 2,471 patients admitted to the hospital with community-acquired pneumonia. Diabetes Care 2005; 28:810-815
  69. Rains JL, Jain SK. Oxidative stress, insulin signaling, and diabetes. Free Radical Biology and Medicine 2011; 50:567-575
  70. Furnary AP, Gao G, Grunkemeier GL, Wu Y, Zerr KJ, Bookin SO, Floten HS, Starr A. Continuous insulin infusion reduces mortality in patients with diabetes undergoing coronary artery bypass grafting. Journal of Thoracic & Cardiovascular Surgery 2003; 125:1007-1021
  71. Krinsley JS, Maurer P, Holewinski S, Hayes R, McComsey D, Umpierrez GE, Nasraway SA. Glucose control, diabetes status, and mortality in critically ill patients. Mayo Clinic Proceedings 2017; 92:1019-1029
  72. van Vught LA, Holman R, de Jong E, de Keizer NF, van der Poll T. Diabetes is not associated with increased 90-day mortality risk in critically ill patients with sepsis. Critical Care Medicine 2017; 45:e1026-e1035
  73. Vanhorebeek I, Gunst J, Van den Berghe G. Critical care management of stress-induced hyperglycemia. Current Diabetes Reports 2018; 18:17
  74. Baker EH, Janaway CH, Philips BJ, Brennan AL, Baines DL, Wood DM, Jones PW. Hyperglycaemia is associated with poor outcomes in patients admitted to hospital with acute exacerbations of chronic obstructive pulmonary disease. Thorax 2006; 61:284-289
  75. Martin ET, Kaye KS, Knott C, Nguyen H, Santarossa M, Evans R, Bertran E, Jaber L. Diabetes and risk of surgical site infection: A systematic review and meta-analysis. Infection Control & Hospital Epidemiology 2016; 37:88-99
  76. Noordzij PG, Boersma E, Schreiner F, Kertai MD, Feringa HH, Dunkelgrun M, Bax JJ, Klein J, Poldermans D. Increased preoperative glucose levels are associated with perioperative mortality in patients undergoing noncardiac, nonvascular surgery. European Journal of Endocrinology 2007; 156:137-142
  77. Pomposelli JJ, Baxter JK, Babineau TJ, Pomfret EA, Driscoll DF, Forse RA, Bistrian BR. Early postoperative glucose control predicts nosocomial infection rate in diabetic patients. Journal of Parenteral and Enteral Nutrition 1998; 22:77-81
  78. Ramos M, Khalpey Z, Lipsitz S, Steinberg J, Panizales MT, Zinner M, Rogers SO. Relationship of perioperative hyperglycemia and postoperative infections in patients who undergo general and vascular surgery. Annals of Surgery 2015; 248:585-591
  79. Sadoskas D, Suder NC, Wukich DK. Perioperative glycemic control and the effect on surgical site infections in diabetic patients undergoing foot and ankle surgery. Foot and Ankle Specialist 2016; 9:24-30
  80. Wallia A, Schmidt K, Oakes DJ, Pollack T, Welsh N, Kling-Colson S, Gupta S, Fulkerson C, Aleppo G, Parikh N, Levitsky J, Norvell JP, Rademaker A, Molitch ME. Glycemic control reduces infections in post-liver transplant patients: Results of a prospective, randomized study. Journal of Clinical Endocrinology & Metabolism 2017; 102:451-459
  81. Kyi M, Colman PG, Wraight PR, Reid J, Gorelik A, Galligan A, Kumar S, Rowan LM, Marley KA, Nankervis AJ, Russell DM, Fourlanos S. Early intervention for diabetes in medical and surgical inpatients decreases hyperglycemia and hospital-acquired infections: A cluster randomized trial. Diabetes Care 2019; 42:832-840
  82. Sheen YJ, Huang CC, Huang SC, Hung MD, Lin CH, Lee IT, Lin SY, Sheu WH. Implimentation of an electronic dashboard with a remote management system to improve glycemic management among hospitalized adults. Endocrine Practice 2020; 26:179-191
  83. Garg R, Schuman B, Bader A, Hurwitz S, Turchin A, Underwood P, Metzger C, Rein R, Lortie M. Effect of preoperative diabetes management on glycemic control and clinical outcomes after elective surgery. Annals of Surgery 2018; 267:858-862
  84. Gregory NS, Seley JJ, Ukena J, Shah S, Fred MR, Dargar SK, Mauer E, Kim RJ. Decreased rates of inpatient hypoglycemia following implementation of an automated tool in the electronic medical record for identifying root causes. Journal of Diabetes Science and Technology 2018; 12:63-68
  85. Wang YY, Hu SF, Ying HM, Chen L, Li HL, Tian F, Zhou ZF. Postoperative tight glycemic control significantly reduces postoperative infection rates in patients undergoing surgery: A meta-analysis. BMC Endocrine Disorders 2018; 18:42
  86. Yamamoto JM, Murphy HR. Inpatient hypoglycaemia; should we should we focus on the guidelines, the targets or our tools? Diabetic Medicine 2019; 36:122-123
  87. Dashora U, George S, Sampson M, Walden E. National guidelines have contributed to safer care for inpatients with diabetes. Diabetic Medicine 2019; 36:124-126
  88. Wernerman J, Desaive T, Finfer S, Foubert L, Furnary A, Holzinger U, Hovorka R, Joseph J, Kosiborod M, Krinsley J, Mesotten D, Nasraway S, Rooyackers O, Schultz M, Van Herpe T, Vigersky R, Preiser JC. Continuous glucose control in the ICU: report of a 2013 round table meeting. Critical Care 2014; 18:226
  89. Amrein K, Ellmerer M, Hovorka R, Kachel N, Fries H, von Lewinski D, Smolle K, Pieber TR, Plank J. Efficacy and safety of glucose control with space GlucoseControl in the medical intensive care unit - An open clinical investigation. Diabetes Technology & Therapeutics 2012; 14:690-695
  90. Leelarathna L, English SW, Thabit H, Caldwell K, Allen JM, Kumareswaran K, Wilinska ME, Nodale M, Mangat J, Evans ML, Burnstein R, Hovorka R. Feasibility of fully automated closed-loop glucose control using continuous subcutaneous glucose measurements in critical illness: a randomized controlled trial. Critical Care 2013; 17:R159
  91. Evans K, Green E, Hudson B, Stewart M, Evans M, Gregory R, Wilmot E, Soloman A, Karamat M, Narendran P. Clinical Guideline: Guidelines for managing continuous subcutaneous insulin infusion (CSII, or 'insulin pump') therapy in hospitalised patients. 2019; https://abcd.care/sites/abcd.care/files/CSII_DTN_FINAL%20210218.pdf.
  92. Wang M, Singh LG, Spanakis EK. Advancing the use of CGM devices in a non-ICU setting. Journal of Diabetes Science and Technology 2019; 13:674-681
  93. Lazar HL, McDonnell M, Chipkin SR, Furnary AP, Engelman RM, Sadhu AR, Bridges CR, Haan CK, Svedjeholm R, Taegtmeyer H, Shemin RJ. The Society of Thoracic Surgeons Practice Guideline Series: Blood glucose management during adult cardiac surgery. Annals of Thoracic Surgery 2009; 87:663-669
  94. Group JBDSIC. Guidelines for the management of inpatient diabetes. 2019; https://abcd.care/joint-british-diabetes-societies-jbds-inpatient-care-group.
  95. UK D. End of life diabetes care. 2018; https://www.diabetes.org.uk/resources-s3/2018-03/EoL_Guidance_2018_Final.pdf.
  96. Van den Berghe G, Wouters P, Weekers F, Verwaest C, Bruyninckx F, Schetz M, Vlasselaers D, Ferdinande P, Bouillon R, Lauwers P. Intensive insulin therapy in critically ill patients. New England Journal of Medicine 2001; 345:1359-1367
  97. Van den Berghe G, Wilmer A, Hermans G, Meersseman W, Wouters PJ, Milants I, Van Wijngaerden E, Bobbaers H, Bouillon R. Intensive insulin therapy in the medical ICU. New England Journal of Medicine 2006; 354:449-461
  98. Brunkhorst FM, Engel C, Bloos F, Meier-Hellmann A, Ragaller M, Weiler N, Moerer O, Gruendling M, Oppert M, Grond S, Olthoff D, Jaschinski U, John S, Rossaint R, Welte T, Schaefer M, Kern P, Kuhnt E, Kiehntopf M, Hartog C, Natanson C, Loeffler M, Reinhart K. Intensive insulin therapy and pentastarch resuscitation in severe sepsis. New England Journal of Medicine 2008; 358:125-139
  99. De La Rosa G, Donado JH, Restrepo AH, Quintero AM, Gonzalez LG, Saldarriaga NE, Bedoya M, Toro JM, Velasquez JB, Valencia JC, Arango CM, Aleman PH, VAsquez EM, Chavarriaga JC, Yepes A, Pulido W, Cadavid CA. Strict glycaemic control in patients hospitalised in a mixed medical and surgical intensive care unit: a randomised clinical trial. Critical Care 2008; 12:R120
  100. Preiser J-C, Brunkhorst F. Tight glucose control and hypoglycemia. Critical Care Medicine 2008; 36:1391-1392
  101. Hall L, Fisher M. Aspirin for primary prevention in diabetes? Practical Diabetes International 2009; 26:6-8
  102. Marik PE. Tight glycemic control in acutely ill patients: low evidence of benefit, high evidence of harm! Intensive Care Medicine 2016; 42:1475-1477
  103. Preiser J-C, Devos P, Ruiz-Santana S, Melot C, Annane D, Groeneveld J, Iapichino G, Leverve XM, Nitenberg G, Singer P, Wernerman J, Joannidis M, Stecher A, Chiolero R. A prospective randomised multi-centre controlled trial on tight glucose control by intensive insulin therapy in adult intensive care units: the Glucontrol study. Intensive Care Medicine 2009; 35:1738-1748
  104. Malmberg KA, Efendic S, Ryden LE. Feasibility of insulin-glucose infusion in diabetic patients with acute myocardial infarction: A report from the multicenter trial: DIGAMI. Diabetes Care 1994; 17:1007-1014
  105. Lazar HL, Chipkin SR, Fitzgerald CA, Bao Y, Cabral H, Apstein CS. Tight glycemic control in diabetic coronary artery bypass graft patients improves perioperative outcomes and decreases recurrent ischemic events. Circulation 2004; 109:1497-1502
  106. Gandhi GY, Nuttall GA, Abel MD, Mullany CJ, Schaff HV, O'Brien PC, Johnson MG, Williams AR, Cutshall SM, Mundy LM, Rizza RA, McMahon MM. Intensive intraoperative insulin therapy versus conventional glucose management during cardiac surgery: A randomized trial. Annals of Internal Medicine 2007; 146:233-243
  107. Agus MS, Steil GM, Wypij D, Costello JM, Laussen PC, Langer M, Alexander JL, Scoppettuolo LA, Pigula FA, Charpie JR, Ohye RG, Gaies MG. Tight glycemic control versus standard care after pediatric cardiac surgery. New England Journal of Medicine 2012; 367:1208-1219
  108. Agus MS, Wypij D, Hirshberg EL, Srinivasan V, Faustino EV, Luckett PM, Alexander JL, Asaro LA, Curley MA, Steil GM, Nadkarni VM. Tight glycemic control in critically ill children. New England Journal of Medicine 2017; 376:729-741
  109. Macrae D, Grieve R, Allen E, Sadique Z, Morris K, Pappachan J, Parslow R, Tasker RC, Elbourne D. A randomized trial of hyperglycemic control in pediatric intensive care. New England Journal of Medicine 2014; 370:107-118
  110. Kalfon P, Giraudeau B, Ichai C, Guerrini A, Brechot N, Cinotti R, Dequin P-F, Riu-Poulenc B, Montravers P, Annane D, Dupont H, Sorine M, Riou B. Tight computerized versus conventional glucose control in the ICU: a randomized controlled trial. Intensive Care Medicine 2014; 40:171-181
  111. Cinotti R, Ichai C, Orban JC, Kalfon P, Feuillet F, Roquilly A, Riou B, Blanloeil Y, Asehnoune K, Rozec B. Effects of tight computerized glucose control on neurological outcome in severely brain injured patients: A multicenter sub-group analysis of the randomized-controlled open-label CGAO-REA study. Critical Care 2014; 18:498
  112. Okabayashi T, Shima Y, Sumiyoshi T, Kozuki A, Tokumaru T, Iiyama T, Sugimoto T, Kobayashi M, Yokoyama M, Hanazaki K. Intensive versus intermediate glucose control in surgical intensive care unit patients. Diabetes Care 2014; 37:1516
  113. Cardona S, Pasquel FJ, Fayfman M, Peng L, Jacobs S, Vellanki P, Weaver J, Halkos M, Guyton RA, Thourani VH, Umpierrez GE. Hospitalization costs and clinical outcomes in CABG patients treated with intensive insulin therapy. Journal of Diabetes and its Complications 2017; 31:742-747
  114. Dhatariya K. Should inpatient hyperglycaemia be treated? British Medical Journal 2013; 346:f134
  115. Phillips VL, Byrd AL, Adeel S, Peng L, Smiley DD, Umpierrez GE. A comparison of inpatient cost per day in general surgery patients with type 2 diabetes treated with basal-bolus versus sliding scale insulin regimens. PharmacoEconomics - Open 2017; 1:109-115
  116. Cryer PE, Axelrod L, Grossman AB, Heller SR, Montori VM, Seaquist ER, Service FJ. Evaluation and management of adult hypoglycemic disorders: An Endocrine Society clinical practice guideline. Journal of Clinical Endocrinology & Metabolism 2009; 94:709-728
  117. Seaquist ER, Anderson J, Childs B, Cryer P, Dagogo-Jack S, Fish L, Heller SR, Rodriguez H, Rosenzweig J, Vigersky R. Hypoglycemia and diabetes: A report of a workgroup of the American Diabetes Association and The Endocrine Society. Diabetes Care 2013; 36:1384-1395
  118. Krikorian A, Ismail-Beigi F, Moghissi ES. Comparisons of different insulin infusion protocols: a review of recent literature. Current Opinion in Clinical Nutrition & Metabolic Care 2010; 13:198-204
  119. Umpierrez GE, Smiley D, Zisman A, Prieto LM, Palacio A, Ceron M, Puig A, Mejia R. Randomized study of basal-bolus insulin therapy in the inpatient management of patients with type 2 diabetes (RABBIT 2 trial). Diabetes Care 2007; 30:2181-2186
  120. Rajendran R, Kerry C, Rayman G, group obotMs. Temporal patterns of hypoglycaemia and burden of sulfonylurea-related hypoglycaemia in UK hospitals: a retrospective multicentre audit of hospitalised patients with diabetes. BMJ Open 2014; 4
  121. Digital N. National Diabetes Inpatient Audit (NaDIA) - 2017. 2018; https://digital.nhs.uk/data-and-information/publications/statistical/national-diabetes-inpatient-audit/national-diabetes-inpatient-audit-nadia-2017.
  122. Krinsley JS, Grover A. Severe hypoglycemia in critically ill patients: Risk factors and outcomes. Critical Care Medicine 2007; 35:2262-2267
  123. Kagansky N, Levy S, Rimon E. Hypoglycemia as a predictor of mortality in hospitalized elderly patients. Archives of Internal Medicine 2003; 163:1825-1829
  124. Stanisstreet D, Walden E, Jones C, Graveling A, Amiel SA, Crowley C, Dhatariya K, Frier B, Malik R. The hospital management of hypoglycaemia in adults with diabetes mellitus. 2020. https://abcd.care/resource/hospital-management-hypoglycaemia-adults-diabetes.
  125. Smith WD, Winterstein AG, Johns T, Rosenberg E, Sauer BC. Causes of hyperglycemia and hypoglycemia in adult inpatients. American Journal of Health-System Pharmacy 2005; 62:714-719
  126. Maynard G, Lee J, Phillips G, Fink E, Renvall M. Improved inpatient use of basal insulin, reduced hypoglycemia, and improved glycemic control: Effect of structured subcutaneous insulin orders and an insulin management algorithm. Journal of Hospital Medicine 2009; 4:3-15
  127. Agency NPS. Insulin safety. Reducing harm associated with the unsafe use of insulin products. 2010; http://www.patientsafetyfirst.nhs.uk/Content.aspx?path=/interventions/relatedprogrammes/medicationsafety/insulin/
  128. Dendy J, Chockalingam V, Tirumalasetty N, Dornelles A, Blonde L, Bolton P, Meadows R, Andrews S. Identifying risk factors for severe hypoglycemia in hospitalized patients with diabetes. Endocrine Practice 2014; 20:1051-1056
  129. Lake A, Arthur A, Byrne C, Davenport K, Yamamoto JM, Murphy HR. The effect of hypoglycaemia during hospital admission on health-related outcomes for people with diabetes: a systematic review and meta-analysis. Diabetic Medicine 2019; 36:1349-1359
  130. Griesdale DE, de Souza RJ, van Dam RM, Heyland DK, Cook DJ, Malhotra A, Dhaliwal R, Henderson WR, Chittock DR, Finfer S, Talmor D. Intensive insulin therapy and mortality among critically ill patients: a meta-analysis including NICE-SUGAR study data. Canadian Medical Association Journal 2009; 180:821-827
  131. Zoungas S, Patel A, Chalmers J, de Galan BE, Li Q, Billot L, Woodward M, Ninomiya T, Neal B, MacMahon S, Grobbee DE, Kengne AP, Marre M, Heller S. Severe hypoglycemia and risks of vascular events and death. New England Journal of Medicine 2010; 363:1410-1418
  132. Wiener RS, Wiener DC, Larson RJ. Benefits and risks of tight glucose control in critically ill adults: A meta-analysis. JAMA 2008; 300:933-944
  133. Kosiborod M, Inzucchi S, Goyal A, Krumholz HM, Masoudi FA, Xiao L, Spertus JA. Relationship between spontaneous and iatrogenic hypoglycemia and mortality in patients hospitalized with acute myocardial infarction. JAMA 2009; 301:1556-1564
  134. Arabi YM, Tamin HM, Rishu AH. Hypoglycemia with intensive insulin therapy in critically ill patients: Predisposing factors and association with mortality. Critical Care Medicine 2009; 37:2536-2544
  135. Vriesendorp TM, DeVries JH, van Santen S, Moeniralam HS, de Jong E, Roos YB, Schultz MJ, Rosendaal FR, Hoekstra JB. Evaluation of short-term consequences of hypoglycemia in an intensive care unit. Critical Care Medicine 2006; 34:2714-2718
  136. Krinsley JS, Schultz MJ, Spronk PE, Harmsen RE, van Braam Houckgeest F, van der Sluijs JP, Melot C, Preiser JC. Mild hypoglycemia is independently associated with increased mortality in the critically ill. Critical Care 2011; 15:R173
  137. Digital N. National Diabetes Inpatient Audit (NaDIA) - 2016. 2017; http://www.content.digital.nhs.uk/catalogue/PUB23539.
  138. Dashora U, Sampson M, Castro E, Stanisstreet D, Hillson R. The best hypoglycaemia avoidance initiative in the UK. British Journal of Diabetes 2017; 17:74-77
  139. Gomez AM, Umpierrez GE. Continuous glucose monitoring in insulin-treated patients in non-ICU settings. Journal of Diabetes Science and Technology 2014; 8:930-936
  140. Cardona S, Gomez PC, Vellanki P, Anzola I, Ramos C, Urrutia MA, Haw JS, Fayfman M, Wang H, Galindo RJ, Pasquel FJ, Umpierrez GE. Clinical characteristics and outcomes of symptomatic and asymptomatic hypoglycemia in hospitalized patients with diabetes. BMJ Open Diabetes Research & Care 2018; 6:e000607
  141. Gill GV, Woodward A, Casson IF, Weston PJ. Cardiac arrhythmia and nocturnal hypoglycaemia in type 1 diabetes—the 'dead in bed' syndrome revisited. Diabetologia 2009; 52:42-45
  142. Desouza C, Salazar H, Cheong B, Murgo J, Fonseca V. Association of hypoglycemia and cardiac ischemia. Diabetes Care 2003; 26:1485-1489
  143. Petersen KG, Schluter KJ, Kerp L. Regulation of serum potassium during insulin-induced hypoglycemia. Diabetes 1982; 31:615-617
  144. Razavi Nematollahi L, Kitabchi AE, Stentz FB, Wan JY, Larijani BA, Tehrani MM, Gozashti MH, Omidfar K, Taheri E. Proinflammatory cytokines in response to insulin-induced hypoglycemic stress in healthy subjects. Metabolism - Clinical and Experimental 2009; 58:443-448
  145. Desouza CV, Bolli GB, Fonseca V. Hypoglycemia, diabetes, and cardiovascular events. Diabetes Care 2010; 33:1389-1394
  146. Wright RJ, Newby DE, Stirling D, Ludlam CA, Macdonald IA, Frier BM. Effects of acute insulin-induced hypoglycemia on indices of inflammation. Diabetes Care 2010; 33:1591-1597
  147. Rana OA, Byrne CD, Greaves K. Intensive glucose control and hypoglycaemia: a new cardiovascular risk factor? Heart 2014; 100:21-27
  148. Boucai L, Southern WN, Zonszein J. Hypoglycemia-associated mortality is not drug-associated but linked to comorbidities. American Journal of Medicine 2011; 124:1028-1035
  149. George JT, Warriner D, McGrane DJ, Rozario KS, Price HC, Wilmot EG, Kar P, Stratton IM, Jude EB, McKay GA, Team obotTDS. Lack of confidence among trainee doctors in the management of diabetes: the Trainees Own Perception of Delivery of Care (TOPDOC) Diabetes Study. QJM 2011; 104:761-766
  150. Horton WB, Law S, Darji M, Conaway MR, Akbashev MY, Kubiak NT, Kirby JL, Thigpen SC. A multicenter study evaluating perceptions and knowledge of inpatient glycemic control among resident physicians: analyzing themes to inform and improve care. Endocrine Practice 2019; 25:1295-1303
  151. Brown G, Dodek P. Intravenous insulin nomogram improves blood glucose control in the critically ill. Critical Care Medicine 2001; 29:1714-1719
  152. Rea RS, Donihi AC, Bobeck M, Herout P, McKaveney TP, Kane-Gill SL, Korytkowski MT. Implementing an intravenous insulin infusion protocol in the intensive care unit. American Journal of Health-System Pharmacy 2007; 64:385-395
  153. Umpierrez GE, Kelly JP, Navarrete JE, Casals MM, Kitabchi AE. Hyperglycemic crises in urban blacks. Archives of Internal Medicine 1997; 157:669-675
  154. George S, Dale J, Stanisstreet D. A guideline for the use of variable rate intravenous insulin infusion in medical inpatients. Diabetic Medicine 2015; 32:706-713
  155. Miller EE, Lalla M, Zaidi A, Elgash M, Zhao H, Rubin DJ. Eating and glycemic control among critically ill patients receiving continuous intravenous insulin. Endocrine Practice 2020; 26:43-50
  156. Salinas PD, Mendez CE. Glucose management technologies for the critically ill. Journal of Diabetes Science and Technology 2019; 13:682-690
  157. Newton CA, Smiley D, Bode BW, Kitabchi AE, Davidson PC, Jacobs S, Steed RD, Stentz F, Peng L, Mulligan P, Freire AX, Temponi A, Umpierrez GE. A comparison study of continuous insulin infusion protocols in the medical intensive care unit: Computer-guided vs. standard column-based algorithms. Journal of Hospital Medicine 2010; 5:432-437
  158. Ullal J, Aloi JA. Subcutaneous insulin dosing calculators for inpatient glucose control. Current Diabetes Reports 2019; 19:120
  159. Bouw JW, Campbell N, Hull MA, Juneja R, Guzman O, Overholser BR. A retrospective cohort study of a nurse-driven computerized insulin infusion program versus a paper-based protocol in critically ill patients. Diabetes Technology & Therapeutics 2012; 14:125-130
  160. Juneja R, Roudebush C, Kumar N, Macy A, Golas A, Wall D, Wolverton C, Nelson D, Carroll J, Flanders SJ. Utilization of a computerized intravenous insulin infusion program to control blood glucose in the intensive care unit. Diabetes Technology & Therapeutics 2007; 9:232-240
  161. Marvin MR, Inzucchi SE, Besterman BJ. Computerization of the Yale insulin infusion protocol and potential insights into causes of hypoglycemia with intravenous insulin. Diabetes Technology & Therapeutics 2013; 15:246-252
  162. Goldberg PA, Siegel MD, Sherwin RS, Halickman JI, Lee M, Bailey VA, Lee SL, Dziura JD, Inzucchi SE. Implementation of a safe and effective insulin infusion protocol in a medical intensive care unit. Diabetes Care 2004; 27:461-467
  163. Boutin JM, Gauthier L. Insulin infusion therapy in critically ill patients. Canadian Journal of Diabetes 2014; 38:144-150
  164. DeSantis AJ, Schmeltz LR, Schmidt K, O'Shea-Mahler E, Rhee C, Wells A, Brandt S, Peterson S, Molitch ME. Inpatient management of hyperglycemia: The Northwestern experience. Endocrine Practice 2006; 12:491-505
  165. Davidson PC, Steed RD, Bode BW. Glucommander. A computer-directed intravenous insulin system shown to be safe, simple, and effective in 120,618 h of operation. Diabetes Care 2005; 28:2418-2423
  166. Hirsch IB. Sliding scale insulin--time to stop sliding. JAMA 2009; 301:213-214
  167. Umpierrez GE, Maynard G. Glycemic chaos (not glycemic control) still the rule for inpatient care. How do we stop the insanity? Journal of Hospital Medicine 2006; 1:141-144
  168. Swan E, Dhatariya K. Differential effects of intravenous and subcutaneous sliding scale insulin regimes used to improve blood glucose levels in a tertiary care setting. Practical Diabetes International 2009; 26:2i
  169. King AB, Armstrong DU. Basal bolus dosing: A clinical experience. Current Diabetes Reviews 2005; 1:215-220
  170. Umpierrez GE, Hor T, Smiley D, Temponi A, Umpierrez D, Ceron M, Munoz C, Newton C, Peng L, Baldwin D. Comparison of inpatient insulin regimens with detemir plus aspart versus neutral protamine hagedorn plus regular in medical patients with type 2 diabetes. Journal of Clinical Endocrinology Metabolism 2009; 94:564-569
  171. Umpierrez GE, Smiley D, Hermayer K, Khan A, Olson DE, Newton C, Jacobs S, Rizzo M, Peng L, Reyes D, Pinzon I, Fereira ME, Hunt V, Gore A, Toyoshima MT, Fonseca VA. Randomized study comparing a basal-bolus with a basal plus correction insulin regimen for the hospital management of medical and surgical patients with type 2 diabetes: Basal plus trial. Diabetes Care 2013; 36:2169-2174
  172. Pietras S, Hanrahan P, Arnold L, Sternthal E, McDonnell M. State-of-the-art inpatient diabetes care: The evolution of an academic hospital. Endocrine Practice 2010; 16:512-521
  173. Clement S, Bowen-Wright H. Twenty-four hour action of insulin glargine (Lantus) may be too short for once-daily dosing: A case report. Diabetes Care 2002; 25:1479-1147a
  174. Rubin DJ, Rybin D, Doros G, McDonnell ME. Weight-based, insulin dose-related hypoglycemia in hospitalized patients with diabetes. Diabetes Care 2011; 34:1723-1728
  175. Nesto RW, Bell D, Bonow RO, Fonseca V, Grundy SM, Horton ES, Le Winter M, Porte D, Semenkovich CF, Smith S, Young LH, Kahn R. Thiazolidinedione use, fluid retention, and congestive heart failure. Diabetes Care 2004; 27:256-263
  176. Willi SM, Kennedy A, Brant BP, Wallace P, Rogers NL, Garvey WT. Effective use of thiazolidinediones for the treatment of glucocorticoid-induced diabetes. Diabetes Research & Clinical Practice 2002; 58:87-96
  177. Roberts A, James J, Dhatariya K, Care oBotJBDSJfI. Management of hyperglycaemia and steroid (glucocorticoid) therapy: a guideline from the Joint British Diabetes Societies (JBDS) for Inpatient Care group. Diabetic Medicine 2018; 35:1011-1017
  178. Nirantharakumar K, Marshall T, Kennedy A, Hemming K, Coleman JJ. Hypoglycaemia is associated with increased length of stay and mortality in people with diabetes who are hospitalized. Diabetic Medicine 2012; 29:e445-e448
  179. Roumie CL, Greevy RA, Grijalva CG, Hung AM, Liu X, Murff HJ, Elasy TA, Griffin MR. Association between intensification of metformin treatment with insulin vs sulfonylureas and cardiovascular events and all-cause mortality among patients with diabetes. JAMA 2014; 311:2288-2296
  180. Gerards MC, Venema GE, Patberg KW, Kross M, Potter van Loon BJ, Hageman IM, Snijders D, Brandjes DP, Hoekstra JB, Vriesendorp TM, Gerdes VE. Dapagliflozin for prednisone-induced hyperglycemia in acute exacerbation of chronic obstructive pulmonary disease. Diabetes, Obesity and Metabolism 2018; 20:1306-1310
  181. Umpierrez GE, Gianchandani R, Smiley D, Wesorick DH, Newton C, Farrokhi F, Peng L, Lathkar-Pradhan S, Pasquel F. Safety and efficacy of sitagliptin therapy for the inpatient management of general medicine and surgery patients with type 2 diabetes: A pilot, randomized, controlled study. Diabetes Care 2013; 36:3430-3435
  182. Pasquel FJ, Gianchandani R, Rubin DJ, Dungan KM, Anzola I, Gomez PC, Peng L, Hodish I, Bodnar T, Wesorick D, Balakrishnan V, Osei K, Umpierrez GE. Efficacy of sitagliptin for the hospital management of general medicine and surgery patients with type 2 diabetes (Sita-Hospital): a multicentre, prospective, open-label, non-inferiority randomised trial. Lancet Diabetes and Endocrinology 2017; 5:125-133
  183. Lorenzo-Gonzalez C, Atienza-Sanchez E, Reyes-Umpierrez D, Vellanki P, Davis GM, Pasquel FJ, Cardona S, Fayman M, Peng L, Umpierrez GE. Safety and efficacy of DDP-4 inhibitors for management of hospitalized general medicine and surgery patients with type 2 diabetes. Endocrine Practice 2020; 26:722-728
  184. Rice MJ, Smith JL, Coursin DB. Glucose measurement in the ICU: Regulatory intersects reality. Critical Care Medicine 2017; 45:741-743
  185. Pilackas K, El-Oshar S, Carter C. Clinical reliability of point-of-care glucose testing in critically ill patients. Journal of Diabetes Science and Technology 2020; 14:65-69
  186. Gomez AM, Umpierrez GE, Munoz OM, Herrera F, Rubio C, Aschner P, Buendia R. Continuous glucose monitoring versus capillary point-of-care testing for inpatient glycemic control in type 2 diabetes patients hospitalized in the general ward and treated with a basal bolus insulin regimen. Journal of Diabetes Science and Technology 2016; 10:325-329
  187. Schaupp L, Donsa K, Neubauer KM, Mader JK, Aberer F, Holl B, Spat S, Augustin T, Beck P, Pieber TR, Plank J. Taking a closer look: Continuous glucose monitoring in non-critically ill hospitalized patients with type 2 diabetes mellitus under basal-bolus insulin therapy. Diabetes Technology & Therapeutics 2015; 17:611-618
  188. Davis GM, Galindo RJ, Migdal AL, Umpierrez GE. Diabetes technology in the inpatient setting for management of hyperglycemia. Endocrinology and Metabolism Clinics 2020; 49:79-93
  189. Galindo RJ, Migdal AL, Davis GM, Urrutia MA, Albury B, Zambrano C, Vellanki P, Pasquel FJ, Fayfman M, Peng L, Umpierrez GE. Comparison of the FreeStyle Libre Pro flash continuous glucose monitoring (CGM) system and point-of-care capillary glucose testing (POC) in hospitalized patients with type 2 diabetes (T2D) treated with basal-bolus insulin regimen. Diabetes Care 2020; 43:2730-2735
  190. Singh LG, Satyarengga M, Marcano I, Scott WH, Pinault LF, Feng Z, Sorkin JD, Umpierrez GE, Spanakis EK. Reducing inpatient hypoglycemia in the general wards using real-time continuous glucose monitoring: The glucose telemetry system, a randomized clinical trial. Diabetes Care 2020; 43:2736-2743
  191. Gosmanov AR, Umpierrez GE. Medical nutrition therapy in hospitalized patients with diabetes. Current Diabetes Reports 2012; 12:93-100
  192. McMahon MM, Nystrom E, Braunschweig C, Miles J, Compher C, Nutrition ASfPaE. A.S.P.E.N. clinical guidelines: Nutrition support of adult patients with hyperglycemia. Journal of Parenteral and Enteral Nutrition 2013; 37:23-36
  193. Roberts AW, Penfold S, Care obotJBDSJfI. Glycaemic management during the inpatient enteral feeding of people with stroke and diabetes. Diabetic Medicine 2018; 35:1027-1036
  194. Schafer RG, Bohannon B, Franz M, Freeman J, Holmes A, McLaughlin S, Haas LB, Kruger DF, Lorenz RA, McMahon MM. Translation of the diabetes nutrition recommendations for health care institutions. Diabetes Care 1997; 20:96-105
  195. McMahon MM, Rizza RA. Nutrition support in hospitalized patients with diabetes mellitus. Mayo Clinic Proceedings 1996; 71:587-594
  196. Singer P, Blaser AR, Berger MM, Alhazzani W, Calder PC, Casaer MP, Hiesmayr M, Mayer K, Montejo JC, Pichard C, Preiser J-C, van Zanten AR, Oczkowski S, Szczeklik W, Bischoff SC. ESPEN guideline on clinical nutrition in the intensive care unit. Clinical Nutrition 2019; 38:48-79
  197. Via MA, Mechanick JI. Inpatient enteral and parental nutrition for patients with diabetes. Current Diabetes Reports 2011; 11:99-105
  198. Elia M, Ceriello A, Laube H, Sinclair AJ, Engfer M, Stratton RJ. Enteral nutritional support and use of diabetes-specific formulas for patients with diabetes: A systematic review and meta-analysis. Diabetes Care 2005; 28:2267-2279
  199. Narwani V, Swafe L, Stavraka C, Dhatariya K. How frequently are bedside glucose levels measured in hospital inpatients on glucocorticoids? Clinical Medicine 2014; 14:327-328
  200. Sudlow A, O'Connor HM, Narwani V, Swafe L, Dhatariya K. Assessing the prevalence of dexamethasone use in patients undergoing surgery, and subsequent glucose measurements: a retrospective cohort study. Practical Diabetes 2017; 34:117-121
  201. Yatabe T, Yamazaki R, Kitagawa H, Okabayashi T, Yamashita K, Hanazaki K, Yokoama M. The evaluation of the ability of closed-loop glycemic control device to maintain the blood glucose concentration in intensive care unit patients. Critical Care Medicine 2011; 39:575-578
  202. Levitt DL, Spanakis EK, Ryan KA, Silver KD. Insulin pump and continuous glucose monitor initiation in hospitalized patients with type 2 diabetes mellitus. Diabetes Technology & Therapeutics 2018; 20:32-38
  203. Bally L, Thabit H, Hartnell S, Andereggen E, Ruan Y, Wilinska ME, Evans ML, Wertli MM, Coll AP, Stettler C, Hovorka R. Closed-loop insulin delivery for glycemic control in noncritical care. New England Journal of Medicine 2018; 379:547-556
  204. Thabit H, Hartnell S, Allen JM, Lake A, Wilinska ME, Ruan Y, Evans ML, Coll AP, Hovorka R. Closed-loop insulin delivery in inpatients with type 2 diabetes: a randomised, parallel-group trial. Lancet Diabetes & Endocrinology 2020; 5:117-124
  205. Boughton CK, Bally L, Martignoni F, Hartnell S, Herzig D, Vogt A, Wertli MM, Wilinska ME, Evans ML, Coll AP, Stettler C, Hovorka R. Fully closed-loop insulin delivery in inpatients receiving nutritional support: a two-centre, open-label, randomised controlled trial. Lancet Diabetes & Endocrinology 2019; 7:368-377

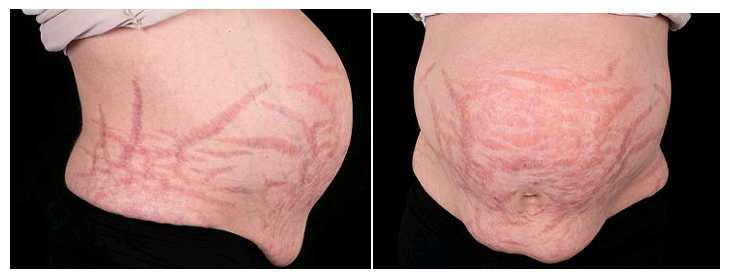
 

Cushing’s Syndrome

ABSTRACT


Cushing’s syndrome results from chronic exposure to excessive circulating levels of glucocorticoids. Cushing’s disease is the most common cause of endogenous hypercortisolism. The recommended screening tests include the 1mg overnight dexamethasone suppression test, late-night salivary cortisol, and 24-hour urinary free cortisol (at least two 24-hour collections). If the initial test is positive on 2 occasions the patient should be evaluated by an endocrinologist for further assessment. An elevated midnight serum cortisol and no suppression of cortisol during a low-dose dexamethasone suppression test will confirm endogenous hypercortisolemia. Plasma 09:00h ACTH measurement guides imaging and further investigations. If ACTH is elevated/inappropriately normal, MRI scanning of the pituitary should be performed, but if ACTH is suppressed imaging of the adrenals should follow.  The corticotrophin releasing hormone (CRH) test helps distinguishing pituitary from ectopic ACTH-dependent Cushing's syndrome, while bilateral petrosal sinus sampling remains the gold standard test and should be considered, if available, with the exception of the presence of a macroadenoma. Transsphenoidal surgery is the first line treatment for Cushing’s disease, followed by radiotherapy as a second-line option. Adrenalectomy is the first-choice treatment for adrenal ACTH-independent Cushing’s syndrome and resection of the ACTH source should be performed for the ectopic ACTH-dependent Cushing’s syndrome, where possible. Steroidogenesis inhibitors remain the most effective medical agents and are useful when surgery or the effects of radiotherapy are awaited or are unsuccessful.


INTRODUCTION


Cushing’s syndrome results from chronic exposure to excessive circulating levels of glucocorticoids. It is now more than one hundred years since Harvey Cushing reported the classical clinical syndrome that bears his name. Even now, its investigation and management can vex the most experienced endocrinologist. It may be difficult to miss the diagnosis in its most florid form but, given the high prevalence of many of its non-specific symptoms such as obesity, muscle weakness, and depression, clinicians are now required to consider the diagnosis in its earlier manifestations. The plethora of investigations often needed for the diagnosis and differential diagnosis has grown over the intervening century, and require careful interpretation. In its severe form and when untreated, the metabolic upset of Cushing's syndrome is associated with a high mortality. However, more subtle excesses of cortisol may also have significant effects on glycemic control and blood pressure, and may therefore be an important cause of morbidity. Treatment is often complex and may require all the modalities of surgery, radiotherapy and medical management.


PATHOPHYSIOLOGY, ETIOLOGY, AND EPIDEMIOLOGY OF CUSHING’S SYNDROME


In normal physiology the final product of the hypothalamo-pituitary-adrenal (HPA) axis is the glucocorticoid cortisol, secreted from the zona fasciculata of the adrenal gland under the stimulus of adrenocorticotropin (ACTH) from the pituitary gland. ACTH is secreted in response to corticotrophin releasing hormone (CRH) and vasopressin from the hypothalamus. Cortisol exerts negative feedback control on both CRH and vasopressin in the hypothalamus, and ACTH in the pituitary. In normal individuals, cortisol is secreted in a circadian rhythm; levels fall during the day from a peak at 07.00h-08.00h to a nadir at around midnight: they then begin to rise again at 02.00h.


It is the loss of this circadian rhythm, together with loss of the normal feedback mechanism of the hypothalamo-pituitary-adrenal (HPA) axis, which results in chronic exposure to excessive circulating cortisol levels and that gives rise to the clinical state of endogenous Cushing's syndrome (1, 2). Any of the numerous synthetic steroids that have glucocorticoid activity, if administered in excessive quantities, can give rise to exogenous Cushing's syndrome. This is the commonest cause of Cushing's syndrome seen in general clinical practice, usually due to treatment for chronic conditions such as asthma or rheumatological disease.


The etiology of Cushing's syndrome can broadly be divided into two categories, ACTH-dependent and ACTH-independent (Table 1).


ACTH-dependent forms are characterized by excessive ACTH production, which stimulates all three layers of adrenal cortex and results in bilateral adrenocortical hyperplasia and hypertrophy of adrenal gland. This results in increased weight of the adrenals, which often show micronodular or sometimes macronodular changes. Circulating glucocorticoids are increased and often, to a lesser extent, are accompanied by a rise in serum androgens.


ACTH-independent forms constitute a heterogeneous group characterized by low levels of plasma ACTH, either because of adrenal glucocorticoid hypersecretion or secondary to the exogenous administration of glucocorticoids. Except for adrenal adenomas, which usually secrete only glucocorticoids, among the other endogenous adrenal entities there is usually also a rise in androgens and sometimes steroid precursors. The microscopic and macroscopic appearance of non-affected adrenal tissue mainly depends on the etiology of the disorder.


Table 1. Etiology of Cushing's Syndrome

ACTH-dependent

Pituitary-dependent Cushing's syndrome (Cushing's disease)

Ectopic ACTH syndrome

Ectopic CRH syndrome (very rare)

Exogenous ACTH administration

ACTH-independent

Adrenal adenoma

Adrenal carcinoma

ACTH-independent bilateral macronodular adrenal hyperplasia (AIMAH) – now known as bilateral macronodular hyperplasia (BMAH)

AIMAH secondary to abnormal hormone receptor expression/function

Primary pigmented nodular adrenocortical disease (PPNAD), associated with Carney complex or sporadic

McCune-Albright syndrome

Exogenous glucocorticoid administration


ACTH-Dependent Cushing's Syndrome


CUSHING’S DISEASE


Pituitary-dependent Cushing's syndrome, better known as Cushing's disease, is the most common cause of endogenous Cushing’s syndrome, accounting for 60-80% of all cases. Epidemiologic studies from Europe suggest an incidence of between 0.7 and 2.4 per million per year (3, 4). It presents much more commonly in women, usually between 25 and 40 years of age.


It is almost always due to a corticotroph adenoma (5, 6). Although apparent nodular corticotroph hyperplasia (in the absence of an CRH-producing tumor) has been described, it is rare in large surgical series (7, 8), and its existence is still debated. The majority of tumors are intrasellar microadenomas (<1 cm in diameter), although macroadenomas account for approximately 5-10% of tumors, and extrasellar extension or invasion may occur. True pituitary corticotroph carcinomas with extra-pituitary metastases causing Cushing's syndrome have also rarely been described (9, 10).


Despite much research, the molecular pathogenesis of corticotroph adenomas remains unknown, but the evidence supports the concept of primary pituitary rather than a hypothalamic disorder (11). However, recent data suggest that around one-third are due to a mutation causing constitutive activation of USP8, a deubiquitinase which leads to increased expression of the EGF receptor on corticotrophs (12). Corticotroph adenomas could rarely be associated with familial syndromes such as MEN1, MEN2, Carney Complex, or familial isolated pituitary adenoma syndrome. Those are secondary to mutations in the menin gene (MEN1), the RET oncogene, and PRKR1A respectively.


Up to 40 percent of older patients with long-existing Cushing’s disease develop ACTH-dependent macronodular adrenocortical hyperplasia. The adrenals tend to be enlarged, with occasional prominent nodules, but invariably with internodular hyperplasia (13, 14); the level of ACTH may be lower than anticipated.


ECTOPIC ACTH SYNDROME AND ECTOPIC CRH TUMORS


Most other cases of endogenous ACTH-dependent Cushing’s syndrome, after excluding Cushing’ disease, are associated with non-pituitary tumors secreting ACTH, referred to as the ectopic ACTH syndrome. Ectopic sources of ACTH derive from a diverse group of tumor types, which can broadly be divided into the group of highly malignant carcinomas and the more indolent group of neuroendocrine tumors, although this may be thought of as a continuum rather than as a binary separation. The most frequent cause is probably small-cell lung carcinoma, where it is estimated up to 12% of cases will have Cushing's syndrome (15-17). However, this may not be evident from series at endocrine centers where often more occult tumors are investigated (Table 2), and bronchial carcinoid (neuroendocrine) tumors tend to predominate. The ectopic ACTH syndrome is more common in men, and usually presents after the age of 40 years, but should always be considered, even in children.


Table 2. Etiology of the Ectopic ACTH Syndrome in Patients (15-17).

Tumor type

Percentage of total Ectopic Cushing's syndrome cases reported in selected literature (n=398)

Lung carcinoma

18.8

Bronchial neuroendocrine tumor

25.4

Thymic neuroendocrine tumor

7.3

Medullary cell carcinoma

4.5

Pancreatic or gastrointestinal NET

11.8

Phaeochromocytoma/paraganglioma

3.8

NET of unknown primary

6.0

Occult tumor

16.1

Miscellaneous malignant tumors

6.3

NET - neuroendocrine tumor


The ACTH precursor molecule, pro-opiomelanocortin (POMC) is expressed not only in normal pituitary but also in several normal extra-pituitary tissues, as well as in some tumors (lung, testis) (18). The mechanism by which these non-corticotroph tumors express the POMC gene is not fully understood, but may be related to hypomethylation of the POMC promoter (19, 20). In general, such tumors tend to produce higher amounts of POMC compared to ACTH, in contrast to the situation in Cushing’s disease. As well as producing ACTH and POMC, these tumors may also produce other pre-ACTH precursor peptides, so-called "big" ACTH (21, 22), which may potentially be helpful in the differential diagnosis of these tumors (23). However, assays for these are not routinely available in clinical practice. Isolated ectopic CRH production is difficult to diagnose and exceedingly rare, with few confirmed cases described in the literature (24). In general, patients secreting CRH ectopically usually also secrete ACTH, rendering the distinction of little practical value.


ACTH-Independent Cushing’s Syndrome


ACTH-independent causes of Cushing’s syndrome, apart from exogenous glucocorticoids, encompass a heterogeneous group of diseases. The most common pathology is an adrenal adenoma or carcinoma. The latter may lack some of the classic histological features of malignancy, but can usually be differentiated on the basis of weight (more than 100g), nuclear pleomorphism, necrosis, mitotic figures, and vascular or lymphatic invasion. These features are incorporated in the Weiss score for the distinction between adenomas and carcinomas.


Adrenal adenomas occur most often around 35 years of age and are significantly more common in women, with an incidence of approximately 0.6 per million per year (4). The incidence of adrenal cancer is approximately 0.2 per million per year (4). It is one and a half times more common in women, and has a bimodal age distribution, with peaks in childhood and adolescence, and late in life (1, 25).


ACTH-independent bilateral macronodular adrenal hyperplasia (AIMAH) is a rare form of Cushing’s syndrome with sometimes huge nodular adrenal glands on imaging. Most cases are sporadic, but a few familial cases have been reported (26). As ACTH has been found within these tumors, a better term is bilateral macronodular hyperplasia (BMAH). In most the etiology is unknown, but in a few cases the nodules have been shown to express increased numbers of receptors normally found on the adrenal gland, or ectopic receptors that then can stimulate cortisol production. The best described example is food-dependent Cushing’s syndrome, in which ectopic gastric inhibitory peptide (GIP) receptors on the adrenal glands respond to GIP released after a meal causing hypercortisolemia (27). Treatment with octreotide may ameliorate the syndrome (28); however, the effect decreases after few months due to down-regulation of somatostatin receptors in the intestine (29). Abnormal expression of vasopressin, b-adrenergic, luteinizing hormone/human chorionic gonadotropin, serotonin, angiotensin, leptin, glucagon, IL-1, and TSH have also been described and functionally linked to cortisol production (29). BMAH tissue may express more than one of these aberrant receptors (30).  Around one-third of patients with BMAH have been found to show inactivating germline mutations of the tumor suppressor gene ARMC5 (armadillo repeat containing protein 5), with each of the nodules demonstrating second independent hits in the same gene: familial forms of BMAH have been described (31).


Cushing’s syndrome due to bilateral nodular adrenal disease can also be a feature of McCune-Albright syndrome (32, 33). The characteristic features are fibrous dysplasia of bone, café-au-lait skin pigmentation, and endocrine dysfunction: pituitary, thyroid, adrenal, or most commonly gonadal hyperfunction (precocious puberty). This condition is caused by an activating mutation at codon 201 of the a-subunit of the G protein stimulating cyclic adenosine monophosphate (cAMP) formation. This occurs in a mosaic pattern in early embryogenesis (34). However, if this affects some adrenal cells the constitutive activation of adenylate cyclase leads to nodule formation and glucocorticoid excess. The normal adrenal cortex, where the mutation is not present, becomes atrophic (35).


Primary pigmented nodular adrenal disease (PPNAD), otherwise known as micronodular adrenal disease, is another rare form of Cushing’s syndrome. It is characterized by small or normal-size adrenal glands with cortical micronodules (average 2–3 mm) that may be dark or black in color. The internodular cortex is usually atrophic, unlike in ACTH-dependent macronodular hyperplasia (36). Cases of PPNAD have been reported without Cushing’s syndrome. Bilateral adrenalectomy is curative. Most cases of PPNAD occur as part of the Carney complex in association with a variety of other abnormalities, including myxomas of the heart, skin or breast, hyperpigmentation of the skin, and other endocrine disorders (sexual precocity; Sertoli cell, Leydig cell, or adrenal rest tumors; and acromegaly) (37). Cushing’s syndrome occurs in approximately 30% of cases of Carney complex. The tumor suppressor gene PRKAR1A (type 1A regulatory subunit of protein kinase A) has been shown to be mutated in over 70% of patients with Carney complex. Recently, two cases of pituitary corticotrophinoma have been identified in patients with Carney complex, one of them having both adrenal and pituitary Cushing (38, 39). In isolated PPNAD, mutations in PRKAR1Aand also the phosphodiesterase 11A (PDE11A) gene have been demonstrated (40).


A missense mutation of the ACTH receptor resulting in its constitutive activation and ACTH-independent Cushing’s syndrome has also been reported (41).


Other very rare causes of Cushing's syndrome have been reported: adrenal rest tissue in the liver, in the adrenal beds, or in association with the gonads which may produce hypercortisolemia, usually in the context of ACTH-dependent disease after adrenalectomy (42, 43). Ectopic cortisol production by an ovarian carcinoma has been noted (44).


Exogenous Cushing’s Syndrome (45)


The basis for iatrogenic Cushing’s syndrome was discussed earlier. The development of the features of Cushing’s syndrome depends on the dose, duration, and potency of the corticosteroids used in clinical practice (45). ACTH is rarely prescribed nowadays, but it will also result in Cushingoid features if administered long-term. Some features, such as an increase in intraocular pressure, cataracts, benign intracranial hypertension, aseptic necrosis of the femoral head, osteoporosis, and pancreatitis, are reported as more common in iatrogenic than endogenous Cushing’s syndrome, whereas other features, notably hypertension, hirsutism, and oligomenorrhoea/amenorrhea, are less prevalent. However, it is unclear as to whether these are true differences.


Pseudo-Cushing's Syndrome


Pseudo-Cushing's states are conditions in which a patient presents with clinical features suggestive of true Cushing's syndrome and with some biochemical evidence of hypercortisolemia. Both resolve after resolution of the predisposing condition. The pathophysiology has not clearly been established. Depression and alcohol abuse are the two most common such states (1).


CLINICAL MANIFESTATIONS OF CUSHING’S SYNDROME


The clinical manifestations in Cushing’s syndrome result from a chronic exposure to excess glucocorticoids and show a wide spectrum of abnormalities, from mild, subclinical disease to florid manifestations.


The classical impression of the disease in its most obvious form, as the association of gross obesity of the trunk with wasting of the limbs, facial rounding and plethora, hirsutism with frontal balding, muscle weakness, spontaneous bruising, vertebral fractures, hypertension and diabetes mellitus, is less commonly seen nowadays (Table 3) (46-48). More frequently, the clinical diagnosis may be equivocal because many symptoms common in Cushing's syndrome, including lethargy, depression, obesity, hypertension, hirsutism, and menstrual irregularity, are also very common in the general population. Therefore, it is useful to have an investigation strategy exploring the more specific features considering the diagnosis, most helpfully relating to the catabolic features of glucocorticoid excess. It is very helpful to notice presence of several signs and symptoms, accompanied by a progressive course. Sequential photographs of the patient over many years can be extremely helpful in demonstrating progression to a Cushingoid state.


The clinical manifestations are usually determined by the duration and amplitude of glucocorticoid exposure, but in some aggressive courses of ectopic ACTH secretion, such as small cell carcinoma, symptoms of hypercortisolism are hard to detect because of the predominant malignant signs and symptoms such as weight loss and anorexia.


The type of steroid excess is determined by the underlying condition. Adrenal adenomas generally secrete glucocorticoids, but in case of an ACTH-dependent disease or a carcinoma additional hyperandrogenism is common.


Table 3. Presenting Features of Patients with Cushing’s Syndrome (43-45)

Presenting features

Prevalence (% of patients)

Weight gain/obesity

81-97

Muscle weakness/tiredness

46-67

Round face

88-92

Skin thinning

84

Easy bruising

21-62

Oedema

48-50

Purple wide striae

35-84

Hirsutism

56-81

Acne

19-64

Female balding

13-51

Dysmenorrhea

35-84

Reduced libido

33-100 (higher in men)

Hypertension

68-90

Mental health disorders

26-62

Recurrent infections

14-25

Diabetes/impaired glucose tolerance

43-50

Fractures

21-56


It is important to observe that combinations of Cushingoid features very much depend on the natural course of its underlying cause.


Patients with the ectopic ACTH syndrome usually present with severe and rapidly developing metabolic signs, most prominently anorexia, myopathy and glucose intolerance. Because of severe hypercortisolemia and additional mineralocorticoid effect, hypokalemic alkalosis is found with peripheral oedema on clinical examination. The combination of rapid clinical deterioration, hyperpigmentation, hypokalemic alkalosis and clinical signs of mineralocorticoid excess should be indicative for suspicion of a small cell lung carcinoma secreting ACTH. In contrast, patients with ACTH-producing bronchial carcinoids, because of the long duration of hypercortisolemia before clinical presentation, tend to develop all of the typical Cushingoid features, complicating its differentiation from Cushing’s disease.


Patients with adrenal carcinomas have a rapid onset of symptoms, and may complain of abdominal pain accompanied with a palpable tumor mass. In addition to hypercortisolism, they often secrete mineralocorticoids and androgens, therefore distinguishing them from benign adenomas which usually secrete cortisol alone (49).


In 10 percent of patients with adrenal incidentalomas, “subclinical” Cushing’s syndrome (better called ‘autonomous cortisol secretion’) can be found; this is characterized by mild hypercortisolism without very obvious clinical manifestations of Cushing’s syndrome (50).


Unlike men, where the main source of androgens is the testes, in women a substantial proportion of circulating androgens are adrenal in origin, such that the signs and symptoms of adrenal hyperandrogenism are readily diagnosed by symptoms of hirsutism and acne, and signs of virilization.


Obesity and weight gain are among the most common signs in Cushing’s syndrome. The distribution of fat can be useful, as typically in Cushing's syndrome there is increased visceral adiposity giving rise to truncal obesity, fat deposition in the cheeks and temporal fossae ("moon face"), dorsocervical area ("buffalo hump"), and supraclavicular fat pads (46, 51). Rarely, fat deposition in the epidural space can be manifest as a neurological deficit (52), while retrorbital deposition is noticeable as exophthalmos (53). In children, more generalized weight gain associated with growth retardation should highlight the possibility of the diagnosis (2). Other signs that are more discriminatory are proximal myopathy, wide purple striae, osteoporosis, thin skin and easy bruising. Based on the study of 369 individuals with obesity, or weight in the overweight range, there were no reported cases of Cushing’s syndrome (54). Therefore, screening patients with generalized obesity and no specific features of Cushing’s syndrome is generally not recommended.


Myopathy of the proximal muscles of the lower limb and shoulder results from a catabolic glucocorticoid effect. When assessing for myopathy it is useful to ask questions about function typically affected by proximal muscle weakness, such as climbing stairs or getting up from a chair. Formal testing can be of leg extension whilst sitting, or rising unaided from a squatting position. Muscle weakness can be exacerbated by hypokalemia, as a result of concomitant mineralocorticoid activity; it is uncommon in pseudo-Cushing’s states (1).


Osteoporosis occurs in approximately 50% of adult patients (55, 56) and can be assessed by formal bone densitometry, or from a history of fractures, typically vertebral due to the preferential loss of trabecular bone induced by glucocorticoids. Glucocorticoids inhibit osteoblast function (57). Vertebral compression fractures lead to height loss. Rib fractures are often painless, with typical radiographic appearance of exuberant callus. Also, osteonecrosis (aseptic necrosis) of the femoral head has been described, usually in relation to iatrogenic Cushing’s syndrome following chronic high dose glucocorticoid therapy (58). After successful treatment of the cause, bone density improves to a large extent (59, 60).


There are many changes in the skin and subcutaneous tissue, which are rarely seen in the general population, suggesting the possibility of Cushing’s syndrome (1, 46). The result of hypercortisolemia is thinning of the skin, which is best tested over the dorsum of the hand, visible as “cigarette paper” (Liddle’s sign), but it is helpful to consider the age and gender of the patient as natural atrophy increases with age and female gender. In addition, skin thickness may be preserved in women with hyperandrogenemia related to Cushing's syndrome. The classic plethora (facial redness) is not only a consequence of skin thinning but also of a loss of a facial subcutaneous fat. Because subcutaneous fat and elastic tissue is also diminished, patients suffer easy bruising, which often can be misinterpreted as senile purpura or even a coagulation disorder. Purple-colored "violaceous" striae greater than 1 cm in diameter are almost pathognomonic of Cushing's syndrome (Figure 1). Typically seen on the abdomen, they can also occur in other areas, such as the thighs, breasts and arms. Narrow and colored striae are more commonly present, and should be differentiated from the typical healed pearl striae seen most commonly post-partum.

Figure 1. The wide purple striae on the abdominal wall due to Cushing’s syndrome (permission of the patient obtained).

Increased fine non-pigmented vellus hair on the upper cheeks or forehead may be seen in Cushing’s syndrome, as well as more typical terminal hair hirsutism on the face and body, reflecting increased androgens. Cutaneous fungal infections as truncal tinea versicolor and onychomycosis are often found.


Skin hyperpigmentation is much more common in ectopic Cushing’s syndrome (most often from small cell lung carcinoma) than Cushing’s disease. It is also associated with the rapid onset of profound weakness, often with little or no weight gain, and an absence of a gross Cushingoid appearance. However, as noted above, other forms of the ectopic ACTH syndrome, particularly associated with neuroendocrine tumors, may be clinically indistinguishable from patients with other forms of hypercortisolism (61).


Severe hirsutism and virilization strongly suggest an adrenal carcinoma (62).


Hypercortisolism may suppress other pituitary hormones. In both men and women, hypogonadotrophic hypogonadism is common and correlates with the degree of hypercortisolemia (63). Glucocorticoids inhibit gonadotrophin–releasing hormone pulsatility and the release of luteinizing (LH) and follicle-stimulating hormone (FSH). Women experience menstrual irregularity, while both sexes have decreased libido. Gonadal dysfunction is reversible after correction of the hypercortisolemia (64). In addition, the coexistence of polycystic ovarian syndrome in Cushing’s syndrome is common (65). There is reduced GH secretion during sleep and blunted GH responses to dynamic stimulation tests (66). Thyrotropin-releasing hormone and thyroid-stimulating hormone release has been shown to be disturbed, and in particular the nocturnal surge of thyroid-stimulating hormone is lost (67). This may not have a significant effect on free thyroid hormone levels during active hypercortisolemia, but there is a significantly increased prevalence of autoimmune thyroid disease in patients successfully treated for Cushing’s syndrome, and it is therefore important to follow them with serial thyroid function tests (68, 69).


Hypokalemic metabolic alkalosis is related to the degree of hypercortisolemia and represents a mineralocorticoid action of cortisol at the renal tubule due to saturation of the enzyme 11b-hydroxysteroid dehydrogenase type 2, which inactivates cortisol to cortisone and allows selective binding of aldosterone to the mineralocorticoid receptor (70). In terms of hypersaturation, cortisol can now access the mineralocorticoid receptor and act as a mineralocorticoid. It occurs when urine free cortisol excretion is greater than about 4100 nmol per day (71). Therefore, although a more common feature of ectopic ACTH secretion, it may also occur in approximately 10% of patients with Cushing’s disease.


Cushing’s syndrome is characterized by insulin resistance and hyperinsulinemia. Glucose intolerance is evident in 20%-30%, and overt diabetes mellitus in 30%-40% of patients (72-75). Glucocorticoids stimulate glycogen deposition, promote gluconeogenesis, inhibit glucose uptake in peripheral tissues, activate lipolysis and have a permissive effect on the counter-regulatory hormones, glucagon and catecholamines. It has been suggested that 2-3% of overweight, poorly-controlled patients with diabetes may have occult Cushing’s syndrome (76, 77). However, in the absence of clinical suspicion the percentage is lower (78, 79), and therefore it is probably not justified to screen for Cushing’s in poorly-controlled diabetic patients unless other suggestive features are present (80). Hyperglycemia becomes easier to control after treatment (81).


There is an increase in total cholesterol and triglyceride levels, and a variable effect on high-density lipoprotein (HDL) (82). These changes are multifactorial, including cortisol effects on increased hepatic synthesis of very low density lipoprotein (VLDL), lipolysis, and free fatty acid metabolism (83).


The major cause of mortality in Cushing’s disease are cardiovascular events, and patients exhibit direct markers of accelerated cardiovascular disease, including increased carotid artery intima-media thickness and atherosclerotic plaques (84) as well as hypertension, glucose intolerance, overt diabetes mellitus, dyslipidemia and visceral obesity. Overall, hypertension is common in patients with Cushing’s syndrome (74). Severe hypertension with additional hypokalemia is more prevalent in ectopic Cushing’s syndrome, usually best controlled with spironolactone or related drug (85). Cardiovascular risk markers continue to be present long after cure of the hypercortisolemia (86) and the cardiovascular risk remains increased (87, 88). Sympathetic autonomic function is also abnormal in patients with Cushing's syndrome (89), and the ECG abnormalities of a prolonged QTc dispersion and left ventricular hypertrophy have been identified as characteristic features in patients with Cushing's disease (90).


Hypercortisolemia increases clotting factors including factor VIII, fibrinogen, and von Willebrand factor, and reduces fibrinolytic activity. This along with other risk factors such as obesity, surgery and invasive investigative procedures, results in a significantly increased risk of thrombotic events in patients with Cushing's syndrome (91). Rates of thromboembolic events, either postoperatively or unrelated to surgery, are higher in patients with Cushing’s syndrome than the estimated incidence in an age and sex matched control population (92). Venous thromboembolism (VTE) has been reported in 20% of patients with Cushing’s syndrome who did not receive thromboprophylaxis at a mean follow-up of 6-9 years (93). In contrast, VTE occurred in only 6% of patients who received a therapeutic dose of unfractionated heparin at least for 2 weeks after any surgery. The hypercoagulable state may persist even up to12 months of Cushing’s syndrome remission and some experts recommend thromboprophylaxis from 24 hours following surgery; however, there is no clear evidence substantiating the duration of prophylaxis (94).


Ophthalmic complications include glaucoma and exophthalmos due to retroorbital fat deposition (95). Cataract is rare, mostly a complication of diabetes.


Psychiatric symptoms such as insomnia, depression, anxiety, easy irritability, paranoid episodes, and attempted suicide or panic attacks are present in more than half of patients having any cause of Cushing’s syndrome (96, 97). Cognitive defects as learning, cognition and impairment of short-term memory may be prominent (98, 99). These changes are not always reversible with treatment.


In patients with Cushing's syndrome there is a greater frequency of infections because of inhibition of immune function by glucocorticoids by decreasing the number of CD4 cells, NK cells and inhibition in cytokine synthesis (100), with predominant effects on cell-mediated immunity (Th1 responses). The most common are bacterial infections, and special attention should be pointed to the possibility of opportunistic pathogens, especially in cases of severe hypercortisolism (101).


Some cases of ACTH-dependent Cushing's syndrome occur in a periodic or cyclical form, with intermittent and variable cortisol secretion, the symptoms and signs waxing and waning according to the active periods of the disease. These patients can cause particular diagnostic difficulty, as it is imperative that the diagnostic tests are performed in the presence of hypercortisolemia to allow accurate interpretation. Patients may 'cycle in' or 'cycle out' over periods of months or years; if at presentation they are eucortisolemic, they will need regular re-evaluation usually with urinary free cortisol or late-night salivary cortisol to allow full investigation at the appropriate time. Cyclicity can in fact occur with all causes of Cushing’s syndrome (102).


BIOCHEMICAL CONFIRMATION OF CUSHING’S SYNDROME


As stated above, there are many clinical features in various combinations in Cushing’s syndrome, but a small number of pathognomonic ones, such as myopathy, skin thinning and bruising, usually suggest the need for biochemical investigation. The basis for establishing the diagnosis of Cushing’s syndrome is biochemical confirmation of hypercortisolism, prior to any test of the differential diagnosis in terms of a specific cause.


Hypercortisolemia together with the loss of the normal circadian rhythm of cortisol secretion, and disturbed feedback of the HPA axis, are the cardinal biochemical features of Cushing's syndrome. Almost all tests to confirm the diagnosis are based upon these principles. Furthermore, to screen for Cushing's syndrome, tests of high sensitivity should be used initially so as to avoid missing milder cases. Tests of high specificity can then be employed to exclude false positives.


It is important to realize that the validation of the published test criteria employed have been on specific assays, and thus test responses should ideally be validated on the local assay used before the results can be interpreted in particular patients. This is aided by supra-regional and nationwide inter-assay quality control assurance (1).


Cortisol is normally secreted in a circadian rhythm, with the highest levels early in the morning and reaching their nadir levels at about midnight (<50 nmol/L or 1.8 μg/dL). In patients with Cushing’s syndrome the circadian rhythm is lost. However, most of the patients still maintain their morning values within the normal range, but have raised nocturnal levels, rendering midnight levels most useful diagnostically. The measurement of free serum cortisol is very challenging, so either levels of salivary cortisol or total serum cortisol are being used. However, exogenous estrogens and some medical conditions (see below) will increase cortisol-binding globulin and therefore total cortisol levels. Hence, in all investigations relying on a serum cortisol assay that measures total cortisol, hormone replacement therapy or the oral contraceptive pill should be stopped 4-6 weeks prior to investigation, although it is likely that a shorter time off treatment may still be effective.


Late Night Salivary Cortisol


Late-night salivary cortisol measurement accurately reflects the plasma free cortisol concentration, because cortisol-binding globulin (CBG) is absent from saliva. Loss of the circadian rhythm of cortisol secretion by measuring night-time salivary cortisol can be utilized as a sensitive screening test for Cushing’s syndrome. Due to the simple non-invasive collection procedure which can conveniently be performed at home, and the fact that salivary cortisol is stable for days at room temperature, it offers a number of attractive advantages over blood collection, particularly in children or in cyclical Cushing’s syndrome. Assays using a modification of the plasma cortisol radioimmunoassay, enzyme-linked immunosorbent assay, or liquid chromatography tandem mass spectrometry are now widely available.


Over the past decade there has been considerable increasing interest in this test and it was used in 28% of patients with Cushing’s syndrome from a European registry of 1341 patients diagnosed in 2000-2016 in the ERCUSYN study (103). It has been evaluated at a large number of centers worldwide. In a meta-analysis of these studies, in adult patients the sensitivity and specificity of this test appears to be relatively consistent at different centers, and overall is 92% and 96% respectively (104). However, it should be noted that the diagnostic value cut-off varies between studies because of different assays and the comparison groups studied. Late-night salivary cortisol used as a screening test had a somewhat lower sensitivity of 88-89% in subjects from the ERCUSYN study. Normal values also differ between adults and pediatric populations, and may be affected by other comorbidities such as diabetes (105), and the method by which the saliva is collected (106). Not surprisingly, this test performs less well in patients with subclinical Cushing's syndrome (107). Salivary cortisol has also been evaluated as the endpoint for the overnight dexamethasone suppression test. This has the potential benefit in terms of convenience but requires further evaluation (108). Salivary cortisol has also been advocated as a sensitive tool to detect recurrence or treatment failure in patient’s post-pituitary surgery for Cushing's disease (109, 110).


In summary, late-night salivary cortisol appears to be a useful and convenient screening test for Cushing's syndrome, particularly in the outpatient setting. However, local normal ranges need to be validated based on the assay used and population studied.


Urinary Free Cortisol


Measurement of urinary free cortisol (UFC) is a non-invasive test that is most commonly used in the screening of Cushing's syndrome (performed in 78% of individuals in the ERCUSYN study) (103). Under normal conditions, 5-10% of plasma cortisol is 'free' or unbound and physiologically active. Unbound cortisol is filtered by the kidney, with the majority being reabsorbed in the tubules, and the remainder excreted unchanged. As serum cortisol increases in Cushing’s syndrome, the binding capacity of CBG is exceeded and a disproportionate rise in UFC is seen. Thus, 24-hour UFC collection produces an integrated measure of serum cortisol, smoothing out the variations in cortisol during the day and night. In a series of 146 patients with Cushing's syndrome, UFC measurement was shown to have a sensitivity of 95% for the diagnosis (111). However, within this series 11% had at least one of four UFC collections within the normal range, which confirmed the need for multiple collections. Furthermore, this sensitivity figure is based on the more florid cases, and is likely to be much less for the more common subtle cases now being seen (112). In the ERCUSYN study UFC was reported to show 86% sensitivity in adrenal and ectopic Cushing's syndrome and 95% in Cushing’s disease (103).


The major drawback of the test is the potential for an inadequate 24-hour urine collection, and written instructions must be given to the patient. Also, multiple collections reduce the possibility of overlooking episodic cortisol secretion, sometimes seen in adrenal adenomas. In addition, simultaneous creatinine excretion in the collection should be measured to assess completeness, and should equal approximately 1g/24 hours in a 70kg patient (variations depend on muscle mass). This should not vary by more than 10% between collections in the same individual (62). The cortisol to creatinine ratio in the first urine specimen can be used as a screening test, especially when cyclic secretion is suspected (113), with a cortisol to creatinine ratio over 25 nmol/mmol being suggestive of Cushing’s syndrome.


The 24 hour UFC is of little value in the differentiation from pseudo-Cushing's states (114, 115), although obesity per se does not appear to confound the results (116).


High-performance liquid chromatography or tandem mass spectrometry are now used to measure UFC, which overcomes the previous problem with conventional radioimmunoassays of cross-reactivity of some exogenous glucocorticoids and other structurally similar steroids (117). Drugs such as carbamazepine, digoxin and fenofibrate may co-elute with cortisol during high-performance liquid chromatography and cause falsely elevated results (118).


In summary, UFC measurements have a high sensitivity if collected correctly, and several completely normal collections make the diagnosis of Cushing's syndrome very unlikely. Values greater than four-fold normal are rare except in Cushing's syndrome. For intermediate values the specificity is somewhat lower, and thus patients with marginally elevated levels require further investigation (1, 112). It is our opinion that the test is of little use for screening, and in general we rarely utilize it nowadays.


Low-Dose Dexamethasone Suppression Test (LDDST)


This test works on the principle that in normal individual’s administration of an exogenous glucocorticoid results in suppression of the HPA axis, whilst patients with Cushing's syndrome are resistant, at least partially, to negative feedback. Dexamethasone is a synthetic glucocorticoid that is 30 times more potent than cortisol, and with a long duration of action. It does not cross-react with most cortisol assays. The original low-dose dexamethasone test  (LDDST) described by Liddle in 1960 measured urinary 17-hydroxy-corticosteroid after 48 hours of dexamethasone 0.5mg 6 hourly (119). However, the simpler measurement of a single plasma or serum cortisol at 09.00h has been validated in various series, and gives the test a sensitivity of between 95% and 100% (112, 120).


The overnight LDDST was first proposed by Nugent et al. in 1965; this measures a 09.00h plasma cortisol after a single dose of 1mg dexamethasone taken at midnight (121), and is thus considerably easier to perform. Since then, various doses have been suggested for the overnight test, between 0.5 and 2mg, and various diagnostic cut-offs have been used (122, 123). There appears to be no advantage in discrimination between 1mg and 1.5mg or 2mg (124). Although higher doses have been tried, the increased suppression in some patients with Cushing's syndrome significantly decreases the sensitivity of the test (125). The 1mg overnight LDDST was used in 60% of the subjects in the European registry of Cushing's syndrome (n=1341) and had the best performance among screening tests, with a sensitivity of 98-99% (103).


In a comprehensive review of the LDDST, both the original 2-day test and the overnight protocol appear to have comparable sensitivities (98%-100%) using the criteria of a post-dexamethasone serum cortisol of <50nmol/L (1.8μg/dl) (126). However, the specificity is greater for the 2-day test (95%-100%) compared to the overnight test (88%) (126).


If the overnight test is used, we suggest that a dose of dexamethasone 1mg at midnight and a threshold of <50nmol/L (1.8 μg/dl) at 09.00h will rarely lead to the diagnosis being missed, but false positives remain significant. In general, the overnight test is an excellent screening test, and we use the 48 hours LDDST as confirmation.


It should be noted that patients with PPNAD may show a paradoxical rise in cortisol levels to dexamethasone (127).


Second Line Tests


In some patients with equivocal results other tests may be needed. The most useful of these are a midnight serum cortisol, and the dexamethasone-CRH test. Less reliable tests such as the insulin tolerance test, the loperamide test (128), and the desmopressin test are not in widespread use.


MIDNIGHT SERUM CORTISOL       


Before the introduction of salivary cortisol, measurement of a midnight serum cortisol was the only reliable method used to determine loss of the circadian rhythm of cortisol secretion. It is still useful as a second-line test in cases of diagnostic difficulty, and we are content to use it as a major test to exclude Cushing’s syndrome in problematic cases.

However, it is a burdensome test that requires that the patient should have been an in-patient for at least 48 hours to allow acclimatization to the hospital environment. The patient should not be forewarned of the test, and should be asleep prior to venipuncture, which must be performed within 5-10 minutes of waking the patient. A single sleeping midnight plasma cortisol <50nmol/L (1.8 μg/dL) effectively excludes Cushing's syndrome (129), but false positive results do occur, particularly in the critically ill, in acute infection, heart failure, and in the pseudo-Cushing's state associated with depression (130).


An awake midnight cortisol of greater than 207 nmol/L (7.5 mg/dL) was reported to show 94% sensitivity and 100% specificity for the differentiation of Cushing's syndrome from pseudo-Cushing's states (131). In the ERCUSYN cohort, 62% individuals with Cushing's syndrome had this test performed with a reported sensitivity of 96-99% (103).


DEXAMETHASONE-CRH TEST


In 1993 the combined dexamethasone-CRH (Dex-CRH) test was introduced for the difficult scenario of the differentiation of pseudo-Cushing’s states from true Cushing’s syndrome in patients with only mild hypercortisolemia and equivocal physical findings (114). The theory is that a small number of patients with Cushing's disease as well as normal individuals will show suppression to dexamethasone, but those with Cushing's disease should still respond to CRH with a rise in ACTH and cortisol. In the original description of the test, dexamethasone 0.5 mg every 6 hours was given for eight doses, ending 2 hours before administration of ovine CRH (1 µg/kg intravenously) to 58 adults with UFC less than 1000 nmol/day (360 µg/day). Subsequent evaluation proved 39 to have Cushing’s syndrome and 19 to have a pseudo-Cushing’s state. The plasma cortisol value 15 minutes after CRH was less than 38 nmol/L (<1.4 µg/dL) in all patients with pseudo-Cushing’s states and greater in all patients with Cushing’s syndrome. A prospective follow-up study by the same group in 98 patients continued to show the test to have an impressive sensitivity and specificity of 99% and 96%, respectively (114). Importantly, in these two studies although eight of 59 patients with proven Cushing's disease showed suppression to dexamethasone, all were correctly characterized after CRH. However, the results from a number of other smaller studies have challenged the diagnostic utility of this test over the standard LDDST. Overall, in these reports the specificity of the LDDST in 92 patients without Cushing's syndrome was 79%, versus 70% for the Dex-CRH. The sensitivity in 59 patients with Cushing's syndrome was 96% for the LDDST versus 98% for the Dex-CRH (132). It is perhaps not surprising that the diagnostic utility of the Dex-CRH has altered with further studies at more centers. There are a number of reasons why there might be the case: variable dexamethasone metabolism in individuals; different definitions of patients with pseudo-Cushing's; different protocols and assays; and variable diagnostic thresholds. It is recommended that if this test is used, a dexamethasone level is measured at the time of CRH administration and the serum cortisol assay is accurate down to these low levels (80).


DIFFERENTIAL DIAGNOSIS OF CUSHING’S SYNDROME


Once Cushing's syndrome has been diagnosed, the next step is to differentiate between ACTH-dependent and ACTH-independent causes by measurement of plasma ACTH. Modern two-site immunoradiometric assays are more sensitive than the older radioimmunoassays and therefore provide the best discrimination. Rapid collection and processing of the sample is essential as ACTH is susceptible to degradation by peptidases so that the sample must be kept in an ice water bath and centrifuged, aliquoted, and frozen within 2 hours to avoid a spuriously low result.  Measurements are usually taken on two different days to avoid misinterpretation because of the episodic secretion of ACTH. The circadian rhythm of ACTH in patients having Cushing’s syndrome is lost, as it is for cortisol measurement, and the optimal sample should be taken at 08.00-09.00h (133).

It is useful to duplicate this test because patients with ACTH-dependent Cushing’s disease have been shown to have on occasion ACTH levels less than 10 ng/L (2 pmol/L) on conventional radioimmunoassay (134). The ACTH immunoassays can interfere with heterophilic antibodies or ACTH fragments and cases of falsely elevated ACTH have been reported using Immuline ACTH assay (135). Therefore, if results are inconsistent or not fitting with clinical features, ACTH should be remeasured using an alternative immunoassay.


Consistent ACTH measurements of <10 ng/L (2 pmol/L) essentially confirm ACTH-independent Cushing's syndrome and radiologic evaluation of adrenals is the next step in diagnosis. Conversely, if levels are consistently greater than 20-30 ng/L (4-6 pmol/L), Cushing's syndrome is ACTH-dependent, due to pituitary disease or ectopic ACTH/CRH secretion.


Intermediate levels are less discriminatory, but a lack of ACTH response to the CRH test (see below) may be particularly helpful in these intermediate cases.


Investigating ACTH-Independent Cushing's Syndrome


Imaging of the adrenal glands is the mainstay in differentiating between the various types of ACTH-independent Cushing's syndrome. High-resolution computed tomography (CT) scanning of the adrenal glands is the investigation of choice, is accurate for masses greater than 1 cm, and allows evaluation of the contralateral gland (136). MRI may be useful for the differential diagnosis of adrenal masses; the T2-weighted signal is progressively less intense in phaeochromocytoma, carcinoma, adenoma, and finally normal tissue (137).


Adrenal tumors typically appear as a unilateral mass with an atrophic contralateral gland (138). If the lesion is greater than 5 cm in diameter it should be considered to be malignant until proven otherwise, and discussed in the local adrenal Multidisciplinary Team meeting (MDT). In comparison to carcinomas, adrenal adenomas are usually smaller and have a lower unenhanced CT attenuation value (usually <10HU). Adrenal adenomas are homogeneous and hypointense on MRI T1-weighted images and iso- or hyperintense comparing to the liver on T2 images. Adrenal adenomas also demonstrate signal drop on out-of-phase imaging consistent with lipid-rich tissue. Signs of necrosis, hemorrhage and calcification are characteristics of carcinoma and phaeochromocytoma which can also co-secrete ACTH (139). Additional laboratory diagnostics reveal solely raised cortisol levels in adenomas, unlike additionally raised androgen levels in adrenocortical carcinomas. Bilateral adenomas can be present (140).


In PPNAD the adrenal glands appear normal or slightly lumpy from multiple small nodules, but are not generally enlarged (137, 141).


Exogenous administration of glucocorticoids results in adrenal atrophy and very small glands may be a clue as to this entity.


BMAH is characterized by bilaterally large (>5 cm) adrenals with a nodular configuration (13, 142).


Confusion can arise as the CT appearance of the adrenals in BMAH may be similar to the appearance seen in ACTH-dependent forms of Cushing's syndrome, where adrenal enlargement is present in 70% of cases (143), but the two can usually be distinguished by the ACTH level and the degree of adrenal enlargement. Some patients with Cushing's disease can also develop a degree of adrenal autonomy which can cause biochemical confusion (14).


Identifying the Source in ACTH-Dependent Cushing's Syndrome


This has been one of the most significant challenges in the investigation of Cushing's syndrome in the past, although advances over the last 15 years have greatly improved our diagnostic capability. Cushing's disease accounts for by far the majority of cases of ACTH-dependent Cushing's syndrome, between 85% and 90% in most series. In the European registry of Cushing’s syndrome (n=1341), 67% of cases were due to pituitary disease and of ACTH-dependent Cushing's syndrome , 92% were of pituitary origin (48).This depends on gender, and in our series of 115 patients with ACTH-dependent Cushing's syndrome, of the 85 women, 92% had Cushing's disease; this percentage was 77% in the 30 men (144). Therefore, even before one starts investigation, the pretest probability that the patient with ACTH-dependent Cushing’s syndrome has Cushing's disease is very high, and any investigation must improve on this pretest likelihood. However, as transsphenoidal pituitary surgery is widely accepted as the primary treatment of Cushing's disease, testing should be designed to avoid inappropriate pituitary surgery in patients with ectopic ACTH production. Thus, any test should ideally be set with 100% specificity for the diagnosis of Cushing's disease.


Levels of serum cortisol and ACTH tend to be higher in the ectopic ACTH syndrome, but there is considerable overlap of values, producing poor discrimination (144, 145). Hypokalemia is more common in ectopic ACTH-dependent Cushing's syndrome than in patients with Cushing’s disease.


INVASIVE TESTING


Bilateral Inferior Petrosal Sinus Sampling


This is the "gold standard" test for distinguishing between Cushing's disease and an ectopic source of ACTH. The procedure involves placement of sampling catheters in the inferior petrosal sinuses that drain the pituitary. Blood for measurement of ACTH is obtained simultaneously from each sinus and a peripheral vein at two time points before and at 3-5 minutes and possibly also 10 minutes after the administration of ovine or human CRH (IV 1 μg/kg or 100μg respectively). A central (inferior petrosal) to peripheral plasma ACTH gradient of 2:1 or greater pre-CRH, or a gradient of 3:1 post-CRH, is consistent with Cushing's disease. The results from early series show these criteria to be 100% sensitive and specific for Cushing’s disease (146, 147). However, it is now clear that false negative tests and to a smaller degree false positive test results do occur (148-150). A recent meta-analysis including 23 studies and 1642 patients with ACTH-dependent Cushing's syndrome reported that IPSS had sensitivity of 94% and specificity of 89% with area under the ROC curve of 97% to diagnose Cushing’s disease (151).


In order to minimize these inaccuracies it is important to ensure the patient is actively hypercortisolemic (as above) at the time of the study (152), and that catheter position is confirmed as bilateral and any anomalous venous drainage noted by venography before sampling (153). There appears to be no discriminatory difference between ovine or human sequence CRH. Recent data suggest that where CRH is unavailable, desmopressin 10 μg may be used instead (154).


It should be noted that the procedure is technically difficult, and should only be performed by radiologists experienced in the technique. The most common complications are transient ear discomfort or pain, and local groin hematomas. More serious transient and permanent neurological sequelae have been reported, including brainstem infarction, although these are rare (<1%), and most have been related to a particular type of catheter used (155, 156); if there are any early warning signs of such events the procedure should be immediately halted. Patients should be given heparin during sampling to prevent thrombotic events (74). CRH itself is generally tolerated well, although patients may experience brief facial flushing and a metallic taste in the mouth. One case of CRH inducing pituitary apoplexy in a patient with Cushing’s disease has been reported (157). There appears to be no advantage in trying to sample the cavernous sinus. Sampling of the internal jugular veins is a simpler procedure but is not as sensitive as BIPSS (158).


A baseline IPS to peripheral prolactin ratio of >1.8 was suggested as a confirmation of a successful catheterization (159), but more recent studies have cast doubt on the utility of prolactin for this purpose.


BIPSS has also been suggested to help to lateralize microadenomas within the pituitary using the inferior petrosal sinus ACTH gradient  (IPSG), with a basal or post-CRH inter-sinus ratio of at least 1.4 being the criteria for lateralization used in all large studies (147, 148, 160, 161). In these studies, the diagnostic accuracy of localization as assessed by operative outcome varied between 59% and 83%. This is improved if venous drainage is assessed to be symmetric (162). A study of 501 cases of Cushing’s disease showed that an interpetrosal ACTH ratio of ≥1.4 was achieved in 98% of patients but lateralized the lesion correctly in only 69% of subjects. A pituitary lesion was identified on the pre-operative MRI in 42% of patients in that study and, if seen, had a positive predictive value of 86% (163). Hence, the interpetrosal ratio should guide pituitary exploration mainly in cases of a normal pre-surgery MRI scan. In this study MRI was falsely positive in 12% of individuals.


An enhanced dynamic MRI has a better detection rate of pituitary microadenomas than conventional MRI and was reported to identify a pituitary lesion in 81% (83 out of 102) patients with Cushing’s disease and lateralized correctly the pituitary adenoma in 62 out of 71 patients with histologically-proven Cushing's disease (164).


The accuracy of lateralization appears to be higher in children (90%), a situation where imaging is often negative (165). There is some discrepancy between studies as to whether CRH improves the predictive value of the test (166). If a reversal of lateralization is seen pre- and post-CRH, the test cannot be relied upon (167).


NON-INVASIVE TESTS


High Dose Dexamethasone Suppression Test


As with the LDDST, the high dose dexamethasone suppression test (HDDST) was originally proposed by Liddle to differentiate between cortisol-secreting adrenal tumors and Cushing's disease (119). The HDDST’s role in the differential diagnosis of ACTH-dependent Cushing’s syndrome is based on the same premise: that most pituitary corticotroph tumors retain some albeit reduced responsiveness to negative glucocorticoid feedback, whereas ectopic ACTH-secreting tumors, like adrenal tumors, typically do not, with the exception of some neuroendocrine tumors, mainly bronchial (168, 169).


The test is performed according to the same protocol as the LDDST either as 2mg 6 hourly for 2 days, or as an overnight using a single dose of 8mg of dexamethasone at 23.00h. The latter is more convenient for a patient because a single blood specimen is being tested on the next day at 08.00h. In most patients with pituitary-dependent Cushing’s syndrome, the final serum cortisol level is less than 5 mcg/dL (140 nmol/L). In normal subjects the level is usually undetectable (170).


Overall, only about 80% of patients with Cushing's disease will show a positive response to the test, defined by suppression of cortisol to less than 50% of the basal value. There are a high number of false positive tests (~10-30%) seen in ectopic Cushing’s syndrome (170-173). Shifting the criteria can only increase sensitivity with a loss of specificity, and vice-versa. Therefore, the test achieves worse discrimination than the pretest probability of Cushing's disease. In addition, one study has shown that suppression to HDDST can be inferred by a >30% suppression of serum cortisol to the 2-day LDDST (174). Therefore, we no longer recommend the routine use of the HDDST except when bilateral inferior petrosal sinus sampling is not available, and then only as part of a combined testing strategy with the CRH test (see below).


The HDDST was performed in 30% of subjects (n=402) from the European registry of patients with Cushing's syndrome , with a cortisol reduction supporting the diagnosis of pituitary Cushing's syndrome  in 92% and ectopic Cushing's syndrome  in 93% of patients (specificity not given) (103). When used in individuals with negative IPSS, HDDST supported the diagnosis of pituitary disease in 100% and ectopic Cushing's syndrome in 82%.


The combined use of the HDDST and enhanced dynamic MRI of the pituitary was compared to BIPSS in 71 patients with histologically-proven Cushing's disease (164). The combination had 98.6% positive predictive value (PPV) for Cushing's disease but sensitivity of only 69.6%. In that study BIPSS alone had a similar PPV of 97%.


The CRH Test


The use of the CRH (corticotrophin-releasing hormone) test for the differential diagnosis of ACTH-dependent Cushing's syndrome is based on the premise that pituitary corticotroph adenomas retain responsivity to CRH, while ectopic ACTH tumors lack CRH receptors and therefore do not respond to the agent. CRH either 1 µg/kg or 100 µg synthetic ovine (oCRH) or human sequence CRH (hCRH) is given as a bolus injection and the change in ACTH and cortisol measured. Human-sequence CRH has qualitatively similar properties to oCRH, although it is shorter-acting with a slightly smaller rise in plasma cortisol and ACTH in obese patients, and in those with Cushing's disease (175). This may be related to the more rapid clearance of the human sequence by endogenous CRH-binding protein (176). The availability differs worldwide with oCRH predominant in North America but hCRH elsewhere.


Different centers have used differing protocols, including type of CRH and sampling time-points, and thus there is little consensus on a universal criterion for interpreting the test. In one of the largest published series of the use of oCRH, an increase in ACTH by at least 35% from a mean basal (-5 and -1 minutes) to a mean of 15 and 30 minutes after oCRH in 100 patients with Cushing's disease and 16 patients with the ectopic ACTH syndrome gave the test a sensitivity of 93% for diagnosing Cushing’s disease, and was 100% specific (177). Conversely, in the large series of the use of hCRH in 101 patients with Cushing's disease and 14 with the ectopic ACTH syndrome, the best criterion to differentiate Cushing's disease from ectopic ACTH syndrome was a rise in cortisol of at least 14% from a mean basal (-15 and 0 minutes) to a mean of 15 and 30 minutes, giving a sensitivity of 85% with 100% specificity. The best ACTH response was a maximal rise of at least 105%, giving 70% sensitivity and 100% specificity (144).


In a multicenter analysis from Italy, both hCRH and oCRH were used in 148 patients with Cushing's disease and 12 with the ectopic ACTH syndrome. A maximal 50% increase in ACTH and cortisol levels were considered as consistent with Cushing's disease, excluding all patients with the ectopic ACTH syndrome and thus giving 100% specificity. The sensitivity and specificity for the ACTH response were comparable for the two types of CRH (sensitivity: 85% vs 87% for oCRH and hCRH respectively).


A CRH test was performed in 351 patients with ACTH-dependent Cushing's syndrome from the European registry of Cushing's syndrome, with a peak ACTH supporting the diagnosis of Cushing's disease in 90% of cases and ectopic Cushing's syndrome in 84% of patients (103). However, the sensitivity for the cortisol response was significantly greater with oCRH than with hCRH (sensitivity: 67% vs 50% for oCRH and hCRH respectively) (178). The authors do not report in this paper or an associated publication (25) whether time-point combinations other than the maximal were analyzed for the rise in cortisol. Indeed, our data showed that if the maximal rise in cortisol is used the sensitivity falls to 71% (144). These results again demonstrate that specific criteria need to be developed for each test, and cannot readily be extrapolated from other similar but non-identical agents.


In summary, the CRH test is a useful discriminator between causes of ACTH-dependent Cushing's syndrome, particularly in a combined testing strategy with the HDDST or LDDST when diagnostic accuracy is greater than that of either test alone, yielding 98% to 100% sensitivity, and an 88% to 100% specificity (171, 174, 179). Which cut-off to use should be evaluated at individual centers, and caution should be exercised as there will undoubtedly be patients with the ectopic ACTH syndrome who respond outside these cut-offs. However, it should be remembered that responses to both CRH and high-dose dexamethasone are more frequently discordant in Cushing's disease due to a macroadenoma (180). Nevertheless, where BIPSS is unavailable, a response to both CRH (a rise) and the LDDST (a fall) renders an ectopic source extremely unlikely.


Testing with Other Peptides


Both vasopressin and desmopressin (a synthetic long-acting vasopressin analogue without the V1-mediated pressor effects) stimulate ACTH release in Cushing’s disease, probably through the corticotroph-specific V3 (or V1b) receptor.


Hexarelin (a growth hormone secretagogue) stimulates ACTH release probably occurs through stimulation of vasopressin release in normal subjects (181), and by stimulation of aberrant growth hormone secretagogue receptors in corticotroph tumors (182).

These peptides have been utilized in a similar manner to CRH to try and improve the differentiation of ACTH-dependent Cushing’s syndrome, but have unfortunately proved inferior (183-185). However, in centers with no availability of CRH, the desmopressin test may be an alternative.


A combined desmopressin and hCRH stimulation test initially looked promising (186), but further study of this combined test showed significant overlap in the responses (187). The inferior discriminatory value of these stimulants is most likely due to the expression of both vasopressin and growth hormone secretagogue receptors by some ectopic ACTH-secreting tumors (74, 188).


IMAGING


Pituitary (189)


Imaging of the pituitary is an important part of the investigation of ACTH-dependent Cushing's syndrome to identify a possible pituitary lesion and to aid the surgeon during exploration (189). However, the results must be used in conjunction with the biochemical assessment as approximately 10% of normal subjects may have pituitary incidentalomas on MRI (190). Modern MRI techniques using T1-weighted spin echo and/or spoiled gradient recalled acquisition (SPGR) techniques will identify an adenoma in up to 80% of patients with Cushing’s disease (191). They provide greater sensitivity than conventional MRI but with more false positive results (191, 192). On MRI, 95% of microadenomas exhibit a hypointense signal with no post-gadolinium enhancement (Figure 2); however, as the remaining 5% have an isointense signal post-gadolinium, pre-gadolinium images are essential (193). The delayed pituitary microadenoma contrast washout was detected on FLAIR MRI as hyperintensity in 80% of patients with Cushing's disease and negative dynamic MRI (n=5) (194).


CT has a sensitivity of only approximately 40-50% for identifying microadenomas, and is thus significantly inferior to MRI (sensitivity 50-60%) (25, 195), and it should therefore be reserved for patients in whom MRI is contraindicated or unavailable. Computerized tomography (CT) imaging typically shows a hypodense lesion that fails to enhance post-contrast.


Preoperative localization to one side of the pituitary gland by MRI had been advocated as better than BIPSS with a positive predictive value of 93% (149, 196). Other groups have found MRI less effective (148, 197). In addition, as noted above, we have found MRI often to be unhelpful in the pediatric age group, and BIPSS to be of significant value in these patients (165).

Figure 2. Magnetic resonance scan of the head with gadolinium showing left-sided pituitary hypointense microadenoma (white arrows) in 2 different patients (T1 image post-contrast).

Ectopic Tumors


Visualizing an ectopic ACTH source can be a challenge, but in general patients should begin with imaging of the chest and abdomen with CT and/or MRI, bearing in mind likely sites (Table 2). The most common site of the secretory lesion is the chest, and although small cell lung carcinomas are generally easily visualized, small bronchial carcinoid tumors that can be less than 1cm in diameter often prove more difficult. Fine-cut high-resolution CT scanning with both supine and prone images can help differentiate between tumors and vascular shadows (1). MRI can identify chest lesions that are not evident on CT scanning, and characteristically show a high signal on T2-weighted and short-inversion-time inversion-recovery images (STIR) (198). 


The majority of ectopic ACTH secreting tumors are of neuroendocrine origin and therefore may express somatostatin receptor subtypes. Therefore, the radiolabeled somatostatin analogue  (111In-pentetreotide) scintigraphy may be useful to show either functionality of identified tumors, or to try and localize radiologically unidentified tumors (199). Undoubtedly this is a useful technique, but to date there are only sporadic reports that it identifies lesions not apparent using conventional imaging (200, 201). However, a lesion of uncertain pathology is more likely to represent a neuroendocrine tumor, and hence an ectopic source of ACTH, if somatostatin scintigraphy is positive.


Unless the tumors are metabolically active, which is not usually the case, 18F-deoxyglucose positron-emission tomography (PET) does not generally offer any advantage over conventional CT or MRI (202, 203). However, 68Ga-DOTA-conjugated peptides (octreotide, lanreotide or octreotate)  PET scanning, targeting SST receptors 1-5, is more sensitive than conventional octreotide scintigraphy and is indicated in the detection of primary occult neuroendocrine tumors (NETs) when conventional imaging modalities have failed (204). In a systematic review of small studies including a total of 77 patients with ectopic Cushing's syndrome, the detection rate of the tumor was 70% for 68Ga-labelled peptide PET and 61% for 18F-FDG PET (205). 68Ga-somatostatin receptor analogues had better sensitivity in the diagnosis of bronchial carcinoids causing Cushing’s syndrome while18F-FDG PET appeared superior for small-cell lung cancers and other aggressive tumors (206).


STRATEGY FOR THE DIAGNOSIS AND DIFFERENTIAL DIAGNOSIS OF CUSHING’S SYNDROME


There have been a number of international consensus statements published for the diagnosis and differential diagnosis of Cushing's syndrome, the latest on the diagnosis in 2008 (74, 80). It is recommended that UFC (at least two measurements), the LDDST, or late-night salivary cortisol (two measurements) are used as the first line screening test. One other of these tests should confirm abnormal results (Figure 3). In patients with discordant results second-line tests should be used as necessary for confirmation. Once the diagnosis of Cushing’s syndrome is unequivocal, ACTH levels, the CRH test (combined with the LDDST or HDDST), together with appropriate imaging, are the most useful non-invasive investigations to determine the etiology. BIPSS is recommended in cases of ACTH-dependent Cushing’s syndrome where the clinical, biochemical, or radiological results are discordant or equivocal. However, in many centers where BIPSS is available and validated, the practice is to use this test in almost all cases of ACTH-dependent Cushing’s syndrome with the exception of corticotroph macroadenomas.

Figure 3. Investigations algorithm for suspected Cushing’s syndrome; CS – Cushing’s syndrome, ONDST – overnight dexamethasone suppression test, UFC – urinary free cortisol, LDDST – low dose dexamethasone suppression test, HDDST – high dose dexamethasone suppression test, BIPSS – bilateral inferior petrosal sinus sampling, PPNAD – primary pigmented nodular adrenocortical disease, AIMAH – ACTH-independent multinodular adrenal hyperplasia.

TREATMENT OF CUSHING’S SYNDROME


Treatment should be directed toward resolving the primary cause of Cushing’s syndrome, presuming accurate differential diagnosis. Hypercortisolism, accompanied with fatal consequences if left untreated, should be controlled by all means. Whenever possible, surgery, regardless of etiology, presents a first-line treatment option aiming for a permanent cure and resolving the hypercortisolism together with its clinical consequences. However, the approach to the patient with Cushing’s syndrome is individual, so radiation therapy or even medical therapy as first-line treatment could be appropriate depending on etiology, clinical state and the personal choice of a patient.


Following treatment, all of the signs and symptoms of adrenal deficiency should be promptly corrected with steroid replacement therapy. Associated medical disorders of Cushing’s syndrome such as diabetes mellitus, osteoporosis and hypertension should be treated, aiming to avoid permanent dependence on therapy after resolving the primary cause of Cushing’s syndrome.


It should also be emphasized that in severely-unwell patients the metabolic complications should be vigorously treated as a matter of priority, including hypokalemia, hypertension and hyperglycemia. Any infections should be sought and treated. Most importantly, most centers would now advise immediate anti-coagulation with prophylactic low molecular weight heparin in all but the mildest cases or where there are contraindications (207).


Treatment of Cushing’s Disease


The first-line therapy almost always consists of transsphenoidal surgery (Figure 4). Patients with persistent Cushing’s post-operatively can be re-operated upon with a lower success rate than primary surgery and with higher rates of other pituitary hormonal deficiencies. Prior to repeated surgery it is wise to repeat diagnostic testing, especially if corticotrophinoma has not been found on pathologic examination, to exclude the possibility of a hyperglycemia missed ectopic ACTH syndrome. Besides re-operation, patients can be treated either by radiotherapy, medical therapy, or as a definitive solution to the hypercortisolism, bilateral adrenalectomy.


TRANSSPHENOIDAL SURGERY (208)


According to the relevant 2008 consensus statement on the treatment of ACTH-dependent Cushing's syndrome (209, 210), transsphenoidal surgery is widely regarded as the treatment of choice for Cushing’s disease (210). Besides the traditional microscopic approach there is an endoscopic approach which appears useful in patients with persistent or recurrent disease (211, 212) and is associated with a shorter hospital stay (213). The remission rate of Cushing’s disease due to pituitary microadenoma is similar for both techniques (around 80%, total n=6695) with better results in pituitary macroadenomas when using endoscopic approach (59.9% vs 76.3%) (214).


The procedure is not without risks, and in the European Cushing’s disease survey group of 668 patients, the perioperative mortality was 1.9%, with other major complications occurring in 14.5% (215). The frequency of reported adverse events varies widely: diabetes insipidus (either temporary or permanent) (3-46%); hypogonadism (14-53%); hypothyroidism (14-40%); cerebrospinal fluid rhinorrhea (4.6-27.9%); severe growth hormone deficiency (13%); bleeding (1.3-5%); and meningitis (0-2.8%) (215-217).


Where an adenoma is apparent at transsphenoidal exploration, a selective microadenomectomy of tumor tissue is performed, and the surgeon may be guided by pre-operative imaging. However, where no tumor is obvious, and there is no concern regarding fertility, subtotal resection of 85-90% of the anterior pituitary gland is done, leaving a small part near the pituitary stalk. However, there is still a substantial and unpredictable risk of panhypopituitarism.


Figure 4. Management algorithm of Cushing’s disease; TSA, Transsphenoidal adenomectomy; CD, Cushing’s disease.

The overall remission rate combined for microadenomas and macroadenomas in various large series is in the order of 70-79%, although higher rates of approximately 90% can be achieved with microadenomas (7, 214-216, 218-220). Remission rates are estimated upon post-operative pathologic and biochemical results, although both can be equivocal. Half of all tumors cannot be pre-operatively visualized (221), and therefore parts of the tumor can be overlooked intra-operatively and left behind affecting the surgical success rate (222). Adenomas can rise near or within pituitary stalk, rarely in ectopic locations (223, 224), and may show signs of microscopic invasion (225).


Prognostic markers of long-term remission are patient age over 25 years, a microadenoma detected by MRI, lack of invasion of the dura or cavernous sinus, histological confirmation of an ACTH-secreting tumor, low post-operative cortisol levels and long-lasting adrenal insufficiency (209).


Of patients achieving remission, about 10% of these will have a recurrence by 10 years  and 20% by 20 years (226), and this emphasizes the need for long-term annual follow-up based on the same diagnostic criteria as with initial diagnostics; salivary midnight cortisol, 24-hour urinary cortisol, and an overnight 1 mg dexamethasone suppression test results. Special attention should be paid to patients with intermittent hypercortisolism (227). Transsphenoidal surgery is also a useful procedure in patients with Nelson’s syndrome to reduce tumor size, and ameliorate hyperpigmentation (228).


Thromboprophylaxis with low molecular weight heparin should be considered peri-operatively in all surgical procedures for Cushing's syndrome (91, 92).


POST-OPERATIVE EVALUATION AND MANAGEMENT


Many use glucocorticoid coverage for transsphenoidal surgery, tapering off within 1 to 3 days. Morning (09.00h) serum cortisol measurements are then obtained on day 4 or 5 post-operatively  starting 20 hours after the last glucocorticoid administration, during which time the patient should be closely observed for the development of signs of adrenal insufficiency (229). However, where there is close post-operative supervision, it may be possible to assess early cortisol results in the absence of corticosteroid cover.


In the immediate post-operative period, there is a wide range of possible biochemical results, but elevated cortisol in 24-hour urine unequivocally favors operation failure with persistent disease. Post-operative hypocortisolemia (<50 nmol/L [1.8 µg/dL] at 09.00h) is probably the best indicator of the likelihood of long-term remission (230-232). However, detectable cortisol levels of less than 140 nmol/L (<5µg/dL) are also compatible with sustained remission (233-235). In cases of a mild or cyclic Cushing’s disease the normal corticotrophs may not be suppressed and sustain a normal cortisol level with a normal diurnal rhythm.


Higher post-operative cortisol levels are more likely to be associated with failed surgery; however, cortisol levels may sometimes gradually decline over 1-2 months reflecting gradual infarction of remnant tumor or a gradual loss of autonomy of the adrenal (233, 236). Regardless of the possibility of this late remission, the approach should be individualized and additional testing done prior to 3 months if there is reason to believe in residual disease. Persistent cortisol levels greater than 140 nmol/L (>5 µg/dL) 3 months after surgery require further investigation. Persistent hypercortisolemia after transsphenoidal exploration should prompt reevaluation of the diagnosis of Cushing’s disease, especially if previous diagnostic test results were indeterminate or conflicting, or if no tumor was found on pathological examination.


The treatment options for patients with persistent Cushing’s disease include: repeat surgery, radiation therapy, and bilateral adrenalectomy. If immediate surgical remission is not achieved at the first exploration, early repeat transsphenoidal surgery including the endoscopic technique may be worthwhile in a significant proportion of patients, at the expense of an increased likelihood of hypopituitarism (212, 237, 238). Repeat sellar exploration is less likely to be helpful in patients with empty sella syndrome or very little pituitary tissue on MRI scans. Patients with cavernous sinus or dural invasion identified at the initial procedure are not candidates for repeat surgery to treat hypercortisolism and should receive alternative therapy.


Patients who are hypocortisolemic should be started on glucocorticoid replacement. Hydrocortisone 15-20 mg total daily dose in three divided doses is the preferred choice by most. The largest dose (10 mg) should be taken before getting out of bed, and the last 5mg dose should be taken in early afternoon and no later than 18.00h because later administration of glucocorticoids may result in disordered sleep. This low dose of hydrocortisone should be used to avoid long-term suppression of the HPA axis. All patients receiving chronic glucocorticoid replacement therapy should be instructed that they are “dependent” on taking glucocorticoids as prescribed, and that failure to take or absorb the medication could lead to adrenal crisis and possibly death. They should be prescribed a 100mg hydrocortisone (or other high-dose glucocorticoid) intramuscular injection pack for emergency use. They should also obtain a medical information bracelet or necklace that identifies this requirement (Medic-Alert Foundation or similar). Education should stress the need for compliance with the daily dose of glucocorticoid; the need to double the oral dose for nausea, diarrhea, and fever; and the need for parenteral administration and medical evaluation during emesis, trauma, or severe medical stress.


The patient should be told to expect desquamation of the skin, and flu-like symptoms (malaise, joint aching, anorexia, and nausea) during the early post-operative months, and that these are signs that indicate remission. Symptoms can be especially prominent in patients with long-standing, severe Cushing’s syndrome. Some of these symptoms have been related to high levels of circulating interleukin-6 (239). Most patients tolerate these symptoms of glucocorticoid withdrawal much better if they are forewarned and alerted to their ‘positive’ nature. The glucocorticoid dose should not be increased in the absence of intercurrent illness based on these symptoms alone, because it constitutes iatrogenic hypercortisolism, but signs of adrenal insufficiency, such as vomiting, electrolyte abnormalities, and postural hypotension, should be excluded(240).


Recovery of the HPA axis can be monitored by measurement of 09.00h serum cortisol after omission of hydrocortisone replacement for 20 hours. Because recovery after transsphenoidal surgery rarely occurs before 3-6 months and is common at 1 year, initial testing at 3-4 to 9 months is reasonable (111). If the cortisol is undetectable on 2 consecutive days, then recovery of the axis has not occurred and glucocorticoid replacement can be restarted. If the cortisol is measurable, adequate reserve of the HPA axis can be assessed using the insulin tolerance test (231), with a peak cortisol value of greater than 500 nmol/L (>18 µg/dL), indicating adequate reserve on modern assays (241). Many centers use the cortisol response to 250 µg synthetic (1-24) ACTH (SST) as an alternative means of assessing HPA reserve (242, 243), but there is some controversy as to its reliability in this situation (243, 244). If it is used instead of the insulin tolerance test, a 30-minute cortisol of greater than 500 nmol/L  is probably more reliable (241), but the cut-off value for passed SST can vary between laboratories and assays (430-550nmol/L).  Glucocorticoid replacement can be discontinued abruptly if the cortisol response is shown to be normal. Where recovery of the HPA axis is only partial on dynamic testing, but the 09.00h cortisol levels are above the lower limit of the normal range (200 nmol/L [7 µg/dL]), it is reasonable to taper and stop the hydrocortisone unless symptoms of adrenal insufficiency occur. Patients need to continue to be aware of the continuing need for additional glucocorticoids at times of stress or illness and should be given a supply of oral hydrocortisone and an intramuscular injection pack. For patients with detectable but low 09.00h cortisol levels, the hydrocortisone replacement dose should be adjusted down, and a slightly lower dose may be given. Assessment of adequate replacement of hydrocortisone dosing by measuring serum cortisol at various points throughout the day, ensuring that levels are always sufficient (>100 nmol/L [>3.6 µg/dL]) before each dose, can occasionally be useful. This may mean that the peak levels after each dose appear to be unphysiological, but there is a trade-off between mirroring a normal physiologic rhythm as far as possible and the inconvenience of multiple dosing. Modified release hydrocortisone may provide more physiological replacement (245).


Two late conundrums may arise: the questions of recurrence and permanent lack of recovery of the axis. Patients who articulate that the Cushing’s syndrome has returned are often correct, even before physical and biochemical evidence are unequivocal. Investigation is warranted in a patient with these complaints or with recurrent physical signs characteristic of hypercortisolemia. UFC can be measured initially on dexamethasone 0.5 mg/day, if not yet weaned from glucocorticoids. Measurement of late-night salivary cortisol having omitted the afternoon dose of hydrocortisone may also be useful. However, ideally assessment of a cortisol circadian rhythm can be done as an inpatient having stopped the hydrocortisone completely.


If recurrent Cushing’s disease is diagnosed, the therapeutic options are the same as for persistent disease. It should be remembered when investigating recurrence that long-standing ACTH stimulation by a pituitary adenoma causing macronodular adrenal hyperplasia may subsequently involve semi-autonomous cortisol production (246).


If the UFC result is subnormal or low, the patient should be questioned about the actual dose of glucocorticoid that has been taken. Often, patients take additional hydrocortisone, either because they discover that this decreases the symptoms of glucocorticoid withdrawal or because they have increased the dose “for stress,” often without following strict guidelines. These patients have a suppressed axis and very slow regression of Cushingoid features because of exogenous hypercortisolism. They require education and support along with reduction in the daily dose of hydrocortisone to recommended levels. The patient who has a subnormal cortisol response to ACTH 3 years after transsphenoidal surgery (in the absence of over-replacement) is likely to proceed to life-long ACTH deficiency, but this is also highly indicative of a lack of recurrence long-term.


Post-operatively, assessment for deficiencies of other pituitary hormones should also be sought, and the appropriate replacement regimen initiated as necessary, especially growth hormone deficiency in children.


Diuresis is common after transsphenoidal surgery and may result from intraoperative or glucocorticoid-induced fluid overload or may be due to diabetes insipidus. For these reasons, assessment of paired serum and urine osmolality and the serum sodium concentration is essential. It is advisable to withhold specific therapy unless the serum osmolality is greater than 295 mOsm/kg, the serum sodium is greater than 145 mmol/L, and the urine output is greater than 200 mL/hour with an inappropriately low urine osmolality. Desmopressin (DDAVP, Ferring) 0.5-1 µg given subcutaneously will provide adequate vasopressin replacement for 12 hours or more. Hyponatremia may occur in as many as 20% of patients within 10 days of surgery. This may be due to injudicious fluid replacement or the syndrome of inappropriate antidiuretic hormone secretion (SIADH) as is frequently seen after extensive gland exploration, and fluid intake should be restricted (247). While transient central diabetes insipidus is common, in about 20% of operations (248), a small minority of patients proceed to permanent diabetes insipidus, requiring long-term treatment with a vasopressin analogue.


The state of permanent diabetes insipidus is usually accompanied by other anterior pituitary hormone deficiencies (249).


Many glucocorticoid-induced abnormalities, including hypokalemia, hypertension, and glucose intolerance, may be normalized during the post-operative period so that preoperative treatments for these need to be reassessed.


BILATERAL ADRENALECTOMY  


Bilateral adrenalectomy is also an important therapeutic option in patients with ACTH-dependent Cushing’s syndrome not cured by other techniques, particularly in young patients desiring fertility where there are concerns over radiotherapy-induced hypopituitarism. However, it has the disadvantages of life-long glucocorticoid and mineralocorticoid replacement therapy, and increased peri-operative morbidity and mortality. The incidence of adrenal crisis following bilateral adrenalectomy throughout life is reported higher than in patients with Addison’s disease or ACTH deficiency (9.3 events per 100 patients versus 3-6 events/100 patients) (250). In the post-operative period after bilateral adrenalectomy, the hydrocortisone dose should be maintained at 50-100mg of hydrocortisone four times a day by intravenous/intramuscular injection or 200mg per 24 hours in continuous intravenous infusion (251). When no complications are seen after 48 hours post-operatively, the dose of hydrocortisone is reduced to the double replacement dose (40 mg total/day). At this stage, fludrocortisone 100-200mcg daily orally should be introduced.


In addition, the development of Nelson’s syndrome in patients with ACTH-secreting pituitary adenomas occurs in between 8% and 38% of cases (252-254). The chance of developing Nelson’s syndrome appears to be greater if adrenalectomy is performed at a younger age, and if a pituitary adenoma is confirmed at previous pituitary surgery (252, 255). Prophylactic pituitary radiotherapy probably reduces the risk of developing Nelson’s syndrome (252). However, it may be best to hold radiotherapy in reserve and undertake regular MRI scanning of the pituitary, especially when imaging has originally not shown any clear tumor (256). Others have advocated unilateral adrenalectomy plus pituitary irradiation as an alternative to bilateral adrenalectomy, as it gives similar remission rates to primary transsphenoidal surgery (257), but this should be reserved for selected cases.


PITUITARY RADIOTHERAPY (258)


For patients in whom fertility does not represent an important issue and with uncertain preoperative localization, radiotherapy may be used as primary treatment, while in patients showing no signs of remission after transsphenoidal resection of a tumor, pituitary irradiation is one of the next treatment options. It may also be considered as primary therapy for children under age 18 years, because results are comparable to surgery (259, 260). Pituitary irradiation may also decrease the occurrence of Nelson's syndrome (large, locally invasive corticotrophinomas with hyperpigmentation) after medical or surgical adrenalectomy, but this has not been tested in a prospective randomized trial (261).


Primary pituitary radiotherapy for the treatment of Cushing’s disease in adults has been shown to produce rather poor long-term remission rates of around 50% (226, 262). In contrast, as a second-line therapy to failed pituitary surgery, better results are achieved with around 80% showing long-term remission as defined by the normalization of the clinical state and biochemical parameters (263, 264). In children, however, not only primary therapy shows better results with cure rate of 80%, but also they respond more rapidly, usually within 12 months (260), while remission in adults usually occurs by two years although it can take considerably longer. Medical therapy to control hypercortisolemia is usually utilized in the interim, and patients should be reassessed at least yearly (265). In order to evaluate results of pituitary irradiation, urinary free cortisol or several serum cortisol levels throughout the day are measured and medical therapy should be stopped for several consecutive days, followed upon patient education of early recognition signs and symptoms of adrenal insufficiency in outpatient conditions.


Conventional pituitary radiotherapy using a linear accelerator is delivered at a total dose of 4500 to 5000 cGy in 25 fractional doses over 35 days using a 3-or 5-field (opposed lateral fields and vertex field) technique. Side effects when given as primary therapy are rare, but there is significant risk of growth hormone deficiency occurring early in 36-68% of treated adults, while other anterior pituitary deficiencies may develop over time (87, 263). There is some evidence of an increased risk of cerebrovascular complications, which is of concern particularly in younger patients (266), but not all studies agree and further studies are required (267).The risk of optic neuropathy is low and probably less than 1% as long as low-dose fractions are used. Although meningiomas and gliomas have been reported after pituitary radiotherapy, it is not clear whether the incidence is significantly greater than the background risk of developing such tumors (265, 268). However, the very rare and aggressive sarcomas which are sometimes seen are very likely radiation-induced.


Stereotactic radiotherapy using a gamma-knife or Cyber-knife (‘radiosurgery’) is used to optimize the tumor dose and minimize radiation to other areas by delivering a single high dose to a small tumor. This approach seeks to avoid the complications of optic neuritis and cortical necrosis associated with larger total and fractional doses (269), not to mention convenience for the patient receiving therapy in one treatment. It has been less well investigated so far, but has a number of theoretical advantages, including a possible reduction in risk of cerebrovascular disease. It is hard to make a direct comparison in effectiveness between methods because of the difference in size of the treated tumors (269, 270). Most patients still develop endocrine deficiency in the years after treatment (271-273). Because of the high dose of delivered radiation, it is not suitable for large lesions because of the large volume of exposed tissue or for lesions near to the radiosensitive tissues, such as the optic chiasm or optic nerves, because of the potential for visual damage. Otherwise, if adenoma is not close to the optic pathway, it may be superior to conventional fractionated therapy. Gamma knife radiosurgery is probably the most widely used of these techniques. As adjunctive therapy after failed transsphenoidal surgery it achieves biochemical remission in about 55%, although follow-up times have not been as long as for conventional radiotherapy (273, 274). It can also be used as salvage therapy in difficult tumors (274). Radiosurgery of the pituitary gland using proton beams has similar efficacy as second-line therapy (275), and while possibly more precise is not widely available. Cyber-knife radiotherapy for Cushing’s disease is less well described, but there are reports of some success in small numbers of patients (276). As with other forms of radiotherapy, new hormone deficiencies are the major side-effect. It should be emphasized again that stereotactic radiotherapy cannot be used when the tumor is close to the optic chiasm. There is a difference in tolerance of radiation between cranial nerves, with optic nerves most sensitive. A dose above 8Gy should be avoided and a clearance of 5mm from the optic nerves is required, while in case of other cranial nerves doses of 19-23Gy are acceptable (277).


MEDICAL THERAPY OF CUSHING’S DISEASE 


Although the primary therapy of hypercortisolism in Cushing’s disease is surgical, medical therapy can be required in cases when surgery is delayed, contraindicated, or unsuccessful. The most commonly used therapy is adrenal enzyme inhibitors, but there are other possibilities (please see below “Medical therapy in Cushing’s syndrome).


Treatment for the Ectopic ACTH Syndrome


If the ectopic ACTH-secreting tumor is benign and amenable to surgical excision, such as in a lobectomy for a bronchial carcinoid tumor, the chance of cure of Cushing’s syndrome is high.


Local radiotherapy following surgical resection of an ectopic ACTH-secreting source, may also be beneficial, particularly in non-metastatic thoracic carcinoid tumors (278, 279).

The course of the disease is mainly determined by the type of tumor, the presence of metastases and degree of hypercortisolism. The lowest survival rate comes with small cell lung cancer, medullary thyroid cancer and gastrinomas (15, 16).


In patients with metastases solely in the liver, cryoablation, resection or even liver transplantation can be curable. Prognosis is the best in patients younger than 50 years of age, with primary bowel or lung carcinoids (17, 280, 281). However, if significant metastatic disease is present, surgery is not curative, although it may still be of benefit in selected cases.


Regardless of the prognosis, control over hypercortisolism should be established medically either by inhibiting steroidogenesis, or performing mitotane-induced medical adrenalectomy. If medical management fails, surgical bilateral adrenalectomy may be an option. Patients in whom control over hypercortisolism is established can develop thymic hyperplasia (282), which should be distinguished from tumor metastases or a primary thymic tumor. In cases where primary tumor origin remains unknown, adrenal inhibitor therapy can be maintained as long as the patient undergoes to periodic re-examination for tumor localization (15, 16).


Ectopic CRH syndrome is rare and usually is associated with pulmonary carcinoid tumors, following the same therapeutic principles as ACTH-secreting tumors (283).


Treatment of ACTH-Independent Cushing’s Syndrome


Adrenalectomy is the treatment of choice for all cases of ACTH-independent Cushing’s syndrome. This is either unilateral in the case of an adrenal adenoma or carcinoma, or bilateral in cases of bilateral hyperplasia, either micronodular or macronodular. The only exception can be the case of milder hypercortisolism in macronodular hyperplasia, when unilateral adrenalectomy may provide hormonal control, at least temporarily (284, 285). Pre-operatively, adrenal enzyme inhibitor therapy can be used such that the clinical state of the patient is improved thus reducing the risk of complications. In cases where macronodular hyperplasia comes as a consequence of aberrant hormonal receptor, eucortisolemia can be achieved by using the appropriate receptor blockade (286, 287). 


In adrenal adenomas, cure following surgery in skilled hands approaches 100% (288), and is associated with low morbidity and mortality (289).


Laparoscopic adrenalectomy, both unilateral and bilateral, has been shown in experienced hands to be a safe procedure and in most centers has become the approach of choice for non-malignant disease. Its complication rate is lower than with the open approach, and the in-patient stay is significantly reduced (290, 291). A study comparing three surgical techniques (anterior laparoscopic, posterior laparoscopic and robotic surgery) for bilateral adrenalectomy for Cushing’s syndrome showed similar morbidity in all approaches (292).


When adrenal lesion is more than 6cm and suggestive of malignancy, open adrenalectomy remains a gold standard (293). In adrenal cancer, more aggressive surgical approaches probably account for the increase in life span reported in this disease (294). This approach may require multiple operations to resect primary lesions, local recurrences, and hepatic, thoracic, and, occasionally, intracranial metastases, and is usually accompanied by adjuvant mitotane, as discussed below. Overall, there is no significant evidence that radiotherapy improves survival in adrenocortical carcinoma, although in the literature there are sporadic reports that it may be helpful adjuvant treatment to radical surgery in selected cases and may decrease local recurrence (295-297).


Medical Therapy of Cushing’s Syndrome


The role of medical treatment of Cushing’s syndrome is an important one. It is the routine practice of many groups to pre-treat Cushing's syndrome patients prior to surgical treatment to reverse the hypercortisolemia and its metabolic sequelae, and to hopefully reduce the complications of the definitive procedure. Similarly, medical treatment is desirable in patients with Cushing's disease whilst awaiting for pituitary radiotherapy to take effect. In patients where surgery and/or radiotherapy have failed, medical management is often essential prior to (or long-term as an alternative to) bilateral adrenalectomy. Sometimes, in the occult ectopic ACTH syndrome, it may not always be possible to identify the source of secretion, and therefore medical management is desirable pending re-investigation. Finally, medical therapy is helpful as a palliative modality in patients with metastatic disease-causing Cushing's syndrome.


The most commonly used agents are adrenal enzyme inhibitors, but adrenolytic agents, pituitary-targeted therapies or glucocorticoid-receptor antagonists are also used (Table 4). Drugs can be used in combinations in lower doses, aiming for side effect reduction with synergistic effects.


When determining the approach to treatment, the first step is to determine whether the final goal is reducing the level of serum cortisol within normal values or complete cortisol secretion blockade. The latter approach is convenient for patients with more variable secretion, while patients showing less variability can benefit more from lowering the values to the normal range and therefore avoiding the necessity of steroid replacement therapy, as well as a possibility of side effects connected to the higher dosages required with that strategy. A meta-analysis of 35 studies including 1520 patients reported pooled effectiveness of most commonly used medical agents in treatment of Cushing's syndrome with mitotane being most effective in normalizing cortisol levels in 81.8% of patients and cabergoline being least effective  and normalizing cortisol in 35.7% (298). However, as noted below, mitotane is not a simple drug to use or monitor. The use of multiple agents achieved normalization of cortisol in 65.7% of patients.


ADRENAL ENZYME INHIBITORS  


These agents are primarily used as inhibitors of steroid biosynthesis in the adrenal cortex (Figure 5), and thus can be utilized in all cases of hypercortisolemia regardless of cause, but most commonly in ACTH-dependent forms, often with rapid improvement in the clinical features of Cushing's syndrome. The most commonly used agents are metyrapone, ketoconazole, and in certain circumstances etomidate. In the UK ketoconazole and metyrapone are licensed for the treatment of Cushing's syndrome, while mitotane is licensed for the treatment of hypercortisolemia due to adrenocortical carcinoma. The use of etomidate or mifepristone in Cushing's syndrome is off-licence. However, the regulations are very nation-specific. When used in combinations, they have a synergistic therapeutic effect, lowering the rate of side effects.

Figure 5. Steroidogenesis with main adrenal enzyme inhibitors point of action marked; SCCE – side-chain cleavage enzyme, HSD – hydroxysteroid dehydrogenase, OH – hydroxylase, DHEA – dehydroepiandrosteron.

Metyrapone


Metyrapone acts primarily to inhibit the enzyme 11β-hydroxylase, thus blocking the production of cortisol from 11-deoxycortisol in the adrenal gland (299) (Figure 5). As a consequence to blockade of cortisol synthesis, levels of adrenal androgens and deoxycorticosterone rise. The subsequent elevation of 11-deoxycortisol can be monitored in the serum of patients treated with metyrapone. It should be noted that there may be cross-reactivity from 11-deoxycortisol with some cortisol radioimmunoassays: this may result in an unnecessary increase in the metyrapone dose and subsequent clinical hypoadrenalism (300). It is preferable to measure the serum cortisol via liquid chromatography-tandem mass spectrometry in patients treated with metyrapone (301). The fall in cortisol is rapid, with trough levels at 2 hours post-dose, and sometimes administration of  a test dose of 750 mg with hourly cortisol estimation for 4 hours is performed, although not strictly necessary in our opinion (302). Maintenance therapy is usually in the range 500-6000 mg/day in 3-4 divided doses daily. Metyrapone has been used to good effect to reduce the hypercortisolemia in patients with Cushing's syndrome from adrenal tumors, the ectopic ACTH syndrome and Cushing's disease. In the former, patients can be very sensitive to low doses of this agent, whilst in Cushing’s disease higher doses are often required. In Cushing's disease this can be due to the compensatory rise in ACTH in patients not having received pituitary radiotherapy. During short-term follow-up (1-16 weeks) of 54 patients with Cushing’s disease, cortisol normalized on the metyrapone treatment in 75% of participants and in 81% of 16 patients with adrenocortical carcinoma or adenoma (302).


There have not been serious maternal or perinatal complications connected with the use of metyrapone in pregnant women, but the question of safety remains open (303-305).


The principal side effects with metyrapone are hirsutism and acne (as predicted by the rise in adrenal androgens) and reported by 70-83% of women, dizziness and gastrointestinal upset occurring in 5% and 15% respectively. Because of the androgen effect the drug is not considered appropriate for the first-line therapy of long-term treatment in women (306, 307). However, it is hypoadrenalism that remains the most important potential problem, and careful monitoring of treatment and education of the patient is required. If there is uncertainty as to whether the measured cortisol is valid, and not over-estimated by cross-reactivity, it may be appropriate to consider a ‘block-and-replace’ regimen.


Hypokalemia, oedema and hypertension due to salt retention because of mineralocorticoid activity of raised levels of 11-deoxycorticosterone are infrequent (302), but may require cessation of therapy (308).


Ketoconazole


Ketoconazole is an imidazole derivative originally developed as an oral anti-fungal agent. It is a potent inhibitor of sex steroids (androstendione and testosterone) production by its action on C17-20 lyase, and cortisol secretion by 11β-hydroxylase inhibition (309-311). It also inhibits 17-hydroxylase and 18-hydroxylase activity, amongst other enzymes (312). It has also been reported to have a direct effect on ectopic ACTH secretion from a thymic carcinoid tumor (313), and possibly corticotroph ACTH release.


The treatment for Cushing's syndrome is usually started at a dose of 200 mg twice daily, with an onset of action that is probably slower than metyrapone. The usual maximum dose is 400 mg three times a day.


It has been used successfully to lower cortisol levels in patients with Cushing's syndrome of various etiologies including adrenal carcinoma, the ectopic ACTH syndrome, and invasive ACTH-producing pituitary carcinoma, with doses required between 200-1200 mg/day in up to 4 divided daily doses (314, 315), although 2-3 times daily is more usual. Although there have not been consequences on human fetuses, considering animal teratogenity and toxicity the drug is not recommend for use during pregnancy (305, 316, 317).

The normalization of cortisol levels was achieved in 71.1% of patients in pooled meta-analysis of all causes of Cushing's syndrome including 220 individuals and in 49% of patients with Cushing’s disease (298).


The principal side effect of ketoconazole is hepatotoxicity (318, 319). A reversible elevation of hepatic serum transaminases occurs in approximately 5-10% of patients, with the incidence of serious hepatic injury at around 1 in 15,000 patients (320).  The hepatotoxicity appears to be idiosyncratic, but has been reported within 7 days of the initiation of treatment in a patient with Cushing's syndrome (321). Prior to the start of therapy liver function tests should be performed. The alanine aminotransferase (ALT) level should be monitored weekly within the first month of therapy, then once a month in the following trimester and afterwards sporadically or when the dose is changed. If levels reach 3-times above the upper normal range, therapy should be discontinued. Other adverse reactions of ketoconazole include skin rashes and gastrointestinal upset, and one must always be wary of causing adrenal insufficiency (321-323).


Ketoconazole is a CYP3A4 inhibitor and increases the availability of medications metabolized by that enzyme. Hence, the reduction of the dose of affected medications maybe required. Ketoconazole is a mixture of levo- and dextro- enantiomeric forms. Currently, the levo-enantiomer of ketoconazole is under clinical trial as it may be less likely to be hepatotoxic than the racemic mixture (see below).


Due to its C17-20 lyase inhibition and consequent anti-androgenic properties, ketoconazole is particularly useful in female patients where hirsutism is an issue, which may be worsened with metyrapone. Conversely, gynecomastia and reduced libido in male patients may be unacceptable as a first-line long-term treatment and require alternative agents. However, replacement therapy is an option. On the other hand, women having lower levels of estradiol and testosterone do not experience clinically manifest disorder because of the usually present menstrual irregularity. Ketoconazole requires gastric acid for absorption, so should not be given with proton-pump inhibitors. One further advantage of ketoconazole is its inhibition of cholesterol synthesis, particularly LDL cholesterol (324), and in 34 patients with Cushing's syndrome the mean total cholesterol was reduced from 6.1 to 5.0 mmol/l on ketoconazole (322).


The triazole antifungal, fluconazole can also be effective in treatment of Cushing’s syndrome, but experience is limited to single case reports. They described an effective control of hypercortisolism on 200-1200mg daily dose of fluconazole (325, 326). Fluconazole was reported in vitro to be 40% less effective in inhibition of 11-hydroxylase and 17-hydrohylase than ketoconazole (327). The side effects of fluconazole are similar to those of ketoconazole.


Etomidate


Etomidate is an imidazole-derived anesthetic agent which was reported to have an adverse effect on adrenocortical function in 1983 (328). Compared to the other imidazole derivative ketoconazole, etomidate more potently inhibits adrenocortical 11β-hydroxylase, has a similar inhibition of 17-hydroxylase, but has less of an effect on C17-20 lyase (329). At higher concentrations it also appears to have an effect on cholesterol side-chain cleavage (330, 331).


Following their initial report in 1983, Allolio and colleagues showed that intravenous non-hypnotic etomidate dose (2.5 mg/hour) normalized cortisol levels in 5 patients with Cushing's syndrome of various etiologies (332). Since then, there have been a number of case reports on the use of etomidate in successfully reducing hypercortisolemia in seriously-ill patients with either Cushing's disease or the ectopic ACTH syndrome (333-336).


It is usually given at a dose of 2.5-3.0 mg/hour, which is adjusted based on the serum cortisol levels. It usually takes several hours for cortisol to be lowered to within the normal range (337). Etomidate is an effective agent that acts rapidly, but is limited in its use by the fact it has to be given parenterally and requires intensive care settings to safely manage and monitor cortisol and potassium levels 4-6 hourly to adjust the infusion rate (338). A simultaneous infusion of hydrocortisone of 0.5-2 mg/h may be required to maintain normal cortisol levels. However, in this situation it may be lifesaving. The preparation available in the USA contains the vehicle propylene glycol with the potential for nephrotoxicity, as opposed to the preparation available in Europe which contains alcohol.


Mitotane


Mitotane (o’p'DDD), an isomer of DDD (belonging to the same family of chemicals as the insecticide DDT), was developed following the observation of adrenal atrophy in dogs administered DDD. Mitotane inhibits steroidogenesis by reducing cortisol and aldosterone production by blocking cholesterol side-chain cleavage and 11β-hydroxylase in the adrenal gland (339). It also acts as an adrenolytic drug, causing medical adrenalectomy, after being metabolized into an acyl chloride that binds in mitochondria and causes necrosis of adrenocortical cells (340).


Mitotane is used as a treatment for adrenal carcinoma and causes tumor regression and improved survival in some patients (341, 342), and has a beneficial effect on endocrine hypersecretion in approximately 75% of patients (343). It is also utilized in Cushing's syndrome of non-malignant origin, and in this regard lower doses can be utilized (up to 4 g/day), thus reducing the incidence of side effects, particularly gastrointestinal (344). At these lower doses the onset of the cortisol-lowering effect takes longer (6-8 weeks) than with higher doses. Mitotane should not be used in pregnant women, and reproductively active women must use reliable contraception while on therapy (345).

The pooled meta-analysis of all causes Cushing's syndrome including 173 patients reported the normalization of cortisol levels on mitotane treatment in 79.8% of all patients and in 81.8% of participants with Cushing’s disease (298).


The main side effect of mitotane treatment include nausea, vomiting and lethargy. One problem even with low-dose mitotane is the hypercholesterolemia (principally an increase in LDL-cholesterol), which appears to be due to the impairment of hepatic production of oxysteroids, normally a brake on the enzyme HMG CoA reductase (346). However, simvastatin, an HMG CoA reductase inhibitor, can reverse the hypercholesterolemia, and it or a similar agent should be used if necessary in patients treated with mitotane. Other side effects of mitotane include neurological disturbance; elevation of hepatic enzymes; hypouricemia; gynecomastia in men; and a prolonged bleeding time (343, 347). Most importantly, it elevates cortisol-binding globulin, such that levels of total serum cortisol are misleading. Control should be titrated on urinary free cortisol or salivary cortisol. A monitoring of serum levels of mitotane should be undertaken due to its narrow therapeutic window and the risk of toxicity. In the long-term, measurement of blood levels can allow dose titration and reduction as appropriate. A therapeutic level of 14-20 mg/L has been recommended for adrenocortical carcinoma, but lower levels can be sought for simple control of elevated cortisol levels. Mitotane is taken up by fatty tissues, sometimes being released gradually several months after discontinuing therapy, therefore requiring adjustments in glucocorticoid therapy dosage (348). Mitotane shows cytotoxic activity on both normal and tumorous tissue causing primary adrenal insufficiency and therefore requiring glucocorticoid replacement therapy. It tends to spare the zona glomerulosa, but in a long-term use mineralocorticoid replacement is also needed (349). In general, despite effective in other forms of Cushing syndrome, its use has been limited outside of adrenal carcinoma, in which cases it has recently been shown to prolong life (342).


Table 4. Currently Available Medical Therapy for Cushing’s Syndrome (CS)

Medication

Action

Dosage

Side effects

Contra-indications

Comments

Steroidogenosis inhibitors

Metyrapone

11b-hydroxylase inhibitor

250-1000mg 

tds-qds, max 6g/day po

Nausea, vomiting, acne, hirsutism, hypo- or hypertension, oedema, hypokalemia

Pregnancy, breast-feeding, porphyria, severe liver impairment

1st line treatment when available, avoid long-term use in young women

Ketoconazole

11b-hydroxylase and 17,20-lyase inhibitor,

200-400mg

tds po

Gynecomastia, alopecia, hypogonadism in men, hepatotoxicity, Gastrointestinal symptoms, rash

Liver impairment, pregnancy/

breast-feeding,

porphyria

Slow in onset of action, 1stline in children, stop PPI/H2-antagonist as gastric acid needed for absorption


Mitotane

Adrenolytic

500-1000mg tds-qds, gradually increased from 500-1000mg/day to max 6g/day po

Gastrointestinal symptoms, deranged LFTs and TFTs, hyper-cholesterolemia, ataxia, orthostatic hypotension

Pregnancy/

breast-feeding,

stage 4-5 renal failure, severe liver impairment

Slow in action, hyperglycemia, mitotane level monitoring required, accumulates, now rarely used for CD, high rate of withdrawal due to intolerance

Etomidate

11b-hydroxylase inhibitor

0.01-0.5mg/kg/h iv

Sedation, nausea and vomiting, temporary uncontrolled muscle movements,

rash, angioedema

Pregnancy, breast-feeding, porphyria

Parenteral, rapid onset of action, anesthetic agent so ITU settings required, frequent monitoring of cortisol and K+

Modulators of ACTH release

Cabergoline


Dopamine agonist

1-7mg/week po

postural hypotension, nausea, increased tendency of gambling, hallucinations, oedema, depression, possibility of heart valve sclerosis (only very high doses)

Porphyria, pregnancy, hyper-sensitivity to ergot derivates,

valvulopathy

Effective in <40% of patients, which wears off with time, cheap

Pasireotide

Somatostatin analogue

600-900mg 

twice daily sc

Hyperglycemia, cholelithiasis, diarrhea, headache

Severe liver impairment,

Avoid in poorly controlled diabetes

Effective only in mild CD, treatment of hyperglycemia frequently required


Glucocorticoid receptor antagonist

Mifepristone

Glucocorticoid receptor antagonist

300-1200mg daily po

nausea, vomiting, dizziness, headache, arthralgia, increased TSH, decreased HDL, endometrial thickening, rash, oedema

Severe asthma, porphyria, renal failure, severe liver impairment, breast-feeding

Cortisol and ACTH levels remain high so hypokalemia may persist, also anti-progesterone, monitoring difficult

CBG – cortisol binding globulin, CD – Cushing’s disease, tds – 3 times a day; qds – 4 times a day, LFTs – liver function tests, TFTs – thyroid function tests, PPI – proton pump inhibitor, K+ - potassium, ACTH – adrenocorticotrophin hormone, po – orally, iv- intravenous, sc – subcutaneous, ITU – intensive care unit.


MODULATORS OF ACTH RELEASE   


Pasireotide


Somatostatin receptors have been demonstrated on both corticotroph adenomas, and some ectopic ACTH-secreting tumors. However, although octreotide has been helpful in reducing ACTH and cortisol levels in selected case reports of ectopic ACTH-secreting tumors there has been much more limited success in patients with Cushing's syndrome probably through down-regulation of receptor sub-type 2 in these tumors by hypercortisolemia (350).


Recently, there has been renewed interest with the introduction of pasireotide, a somatostatin analogue with a broader spectrum of activity for somatostatin receptor subtypes, including type 5, which is not down-regulated during hypercortisolemia.  Ever since this agent was shown in vitro to reduce human corticotroph proliferation and ACTH secretion (351, 352), there have now been a number of clinical trials published. In an initial phase II trial, pasireotide 600µg injected twice daily for 15 days reduced UFC levels in 76% of 29 patients and normalized levels in 17% (353). A multicenter phase III dose-randomized trial in 162 patients with either new, persistent, or recurrent Cushing's disease has presented 12-month results. At six months there was a reduction in UFC levels in 91 of 103 evaluable patients, with a median UFC reduction of 48%. Normalization of UFC levels were achieved in 14.6% of patients on the 600µg dose twice daily, and 26% of patients on the 900µg twice-daily dose. Patients who showed <50% reduction in UFC levels from baseline by month two were unlikely to show improvement by month 6 or 12. The most clinically relevant adverse events were hyperglycemia (73%), with 46% developing frank diabetes mellitus related to decreases in both insulin and incretin secretion, and hypocortisolemia (8%) (353, 354). Other side effects included elevated liver enzymes, cholelithiasis, nausea and diarrhea in the rate expected from experience with other somatostatin analogues (354). There is now also experience with pasireotide long-acting repeatable (pasireotide LAR), a monthly injection of 10 or 30mg, reporting around 41% of patients achieving normal UFC levels at 7 months of treatment and similar safety profile to the subcutaneous form (355). More than a 20% reduction in size of the pituitary adenoma was described in 45% of patients and an increase by more than 20% in 10% of individuals (355). Pasireotide is not recommended as a first-line treatment but can be considered as add-on therapy or second-line treatment if other medications are not tolerated. In cases where there is no clinical response, it should be discontinued.


Pasireotide at a lower dose of 250 µg three times daily has also been used in stepwise combination therapy with the dopamine agonist cabergoline (previously been demonstrated to have modest but variable efficacy as monotherapy in Cushing's disease (356), and ketoconazole. Pasireotide monotherapy induced normalization of UFC levels in 5 of 17 patients (29%). The addition of cabergoline normalized UFC levels in an additional 4 patients (24%). The further addition of ketoconazole in the remaining 8 patients induced normalization of UFC levels in 6 of these. Thus, in total, remission was achieved in 88% of patients using combination therapy out to 80 days treatment (356).

Therefore, pasireotide represents a potential new treatment for mild Cushing's disease or in combination therapy for individuals with higher hypercortisolemia, although the frequency of hyperglycemia is of major concern.


Corticotroph adenomas with USP8 mutations had been reported to have higher SST5 receptors expression which may suggest higher response rate to pasireotide treatment in this subgroup (357).


Cabergoline


The presence of dopamine receptors (D2) on around 80% of corticotroph adenomas supported use of cabergoline in patients with Cushing’s disease (358). Cabergoline at the dose of 1-7mg weekly was reported to control hypercortisolemia due to Cushing’s disease in 25-40% of patients in small case series (359). It is usually well tolerated and the most common side effects include nausea and dizziness. At the doses used for the treatment of pituitary tumors, the incidence of cardiac valve sclerosis and subsequent regurgitation was not increased in one large study, and therefore echocardiograms are not routinely needed unless high, long-term dose is required (360). However, escape is seen in some patients, so the precentage of patients with long-term control is low. 


Temozolomide


Temozolomide is an oral alkylating prodrug that is converted in vivo to the DNA repair inhibitor, dacarbazine. Traditionally, this chemotherapy agent has been used in the treatment of malignant gliomas, but recent evidence suggests it is also useful in selected aggressive pituitary tumors including corticotroph pituitary carcinomas (361, 362). Although, some reports suggested that the response to temozolomide in pituitary tumors can be predicted by low expression of the DNA repair enzyme O6-methylguanine-DNA-methyltransferase (MGMT), possibly related to MGMT gene promotor methylation (363, 364), not all studies have confirmed this (365, 366). However, the therapeutic response can usually be determined after 3 cycles of chemotherapy.


OTHER AGENTS


Retinoic Acid


Retinoic acid has been found to inhibit ACTH-secretion and cell proliferation both in vitro in ACTH-producing tumor cell lines, and cultured human corticotroph adenomas, and in vivo in nude mice (367). However, clinical trials in man are limited, and it is unlikely to be a major contributor to control.


Rosiglitazone


The thiazolidinedione rosiglitazone, a PPAR-γ agonist, was shown in supra-pharmacological doses to suppress ACTH secretion in human and murine corticotroph tumor cells. In addition, the development of murine corticotroph tumors, generated by subcutaneous injection of ACTH-secreting AtT20 cells, were prevented (368). It appears this is not specific to corticotroph adenomas, but also applies to other forms of pituitary tumor (369). However, the results in human subjects with Cushing's disease have been disappointing (370-372). This may be because doses used in the animal studies were much higher than the equivalent licensed dose in humans. Its use cannot be recommended, and indeed for other reasons it has now been withdrawn from the market.


In the rare causes of Cushing’s syndrome due to bilateral macronodular adrenal hyperplasia (BMAH) and aberrant receptor expression of GIP, β-adrenergic and LH/hCG receptors, specific receptor antagonists may prove to be useful (373). Although octreotide has been shown to have cause a therapeutic response in GIP-related AIMAH as mentioned above (28), others have found neither this somatostatin analogue nor pasireotide to be helpful in inducing a sustained response (374).


Osilodrostat (LCI699)


Osilodrostat is a novel steroidogenesis inhibitor. It is a selective inhibitor of 11β-hydroxylase, an aldosterone synthase and a non-steroidal aromatase. It causes a decrease in cortisol and aldosterone levels and an increase of 11-deoxycorticosterone and 11-deoxycortisol. LCI699 was evaluated in phase II trial as a potential anti-hypertensive agent in patients with primary hyperaldosteronism and essential hypertension (375). In 10-week study in patients with Cushing's disease (n=12) who were not cured by previous surgery, osilodrostat normalized UFC in 92% of subjects with more than 50% decrease in UFC in all participants (376). In 22-week phase II trial in patients with Cushing’s disease (n=19) and UFC >1.5 of the upper normal limit, osilodrostat (10-60mg/day) normalized UFC in 79% of patients. It also produced no significant change in blood pressure and an increase of ACTH 3-4-fold. Adrenal insufficiency was seen in 32% of subjects leading to the reduction of the LCI699 dose, while an increase of testosterone and hirsutism was reported in around 30% of women (376).  The phase III study was a double-blind randomized trial with a withdrawal phase after 24 weeks of treatment followed by continuation of osilodrostat mean dose of 5mg twice a day from 40 to 48 weeks (377). Fifty three percent of participants in the osilodrostat arm (n=36) maintained UFC in the normal range without increasing the dose at 24 weeks, compared to 29% in the placebo group (n=35). Sixty-six patients were not randomized to withdrawal of treatment and continued osilodrostat due to higher cortisol levels. Of 137 individuals with Cushing's disease, 66% maintained UFC in the normal range after 48 weeks (6 months) (377). Most frequent side effects included nausea (42%), headache (34%), fatigue (28%) and adrenal insufficiency (28%). FDA approved osilodrostat for treatment of Cushing's disease in March 2020 and it may prove to be a useful and more convenient alternative to metyrapone.


Levoketoconazole


Levoketoconazole is a stereoisomer of ketoconazole and its efficacy and safety has been assessed in the phase III open-label trial of 94 individuals with Cushing's syndrome (85% with Cushing’s disease) and mean UFC 4.9 times upper normal range (378).The starting dose was 150mg twice a day and titrated up to a total daily dose of 1200mg aiming for normal UFC. Eighty one percent of participants achieved UFC in the normal range by the end of titration phase and 31% maintained it by 6 months of treatment. Most common adverse effects were nausea (32%), headache (28%) and deranged liver function in 11% of participants. However, it remains to be seen whether it proves in practice to be less hepatotoxic than the racemic mixture.


Glucocorticoid Receptor Antagonist(s)


Mifepristone (RU 486), as a potent antagonist of glucocorticoid and progesterone receptors, blocks the peripheral actions of glucocorticoids and progestogens (379, 380). As a consequence it also blocks glucocorticoid-induced negative feedback at the hypothalamo-pituitary level, inducing a rise in ACTH, arginine-vasopressin (AVP) and hence cortisol (381). It has occasionally been given to patients with all forms of Cushing's syndrome (382, 383), showing effectiveness in rapidly reducing symptoms of cortisol-induced psychosis (384, 385), and the metabolic benefit of glycemic control and hypertension have been established (383). Although, it has proven to be effective in the treatment of hypercortisolemia symptoms and signs (382, 386), the major drawback is the lack of biochemical markers to asses either therapeutical effectiveness or possible hypoadrenalism. Adrenal insufficiency is challenging to treat, because the drug, besides blocking endogenous cortisol, also blocks the action of synthetic steroids as replacement therapy. Hypokalemia is a frequent problem due to the saturation of 11β-HSD type 2 and cortisol action on the mineralocorticoid receptor, although it responds well to spironolactone. The daily dose of mifepristone ranges between 300 and 1200mg. It showed a significant improvement of glucose and HbA1c in 60% of patients with impaired glucose tolerance or diabetes (383). Mifepristone could be used as add-on therapy for Cushing’s syndrome with associated hyperglycemia. Endometrial thickening and vaginal bleeding secondary to the anti-progestin effect are likely to be seen in women. However, a new derivative of mifepristone with less anti-progestogen blocking activity, relacorilant, is currently under trial.


Relacorilant (CORT125134)


Relacorilant is a glucocorticoid receptor inhibitor with no action on progesterone receptor. A phase II study (GRACE) included 130 patients with Cushing’s syndrome and type 2 diabetes and/or hypertension. Half of the patients receiving higher dose (range of 100mg-400mg daily) of relacorilant for 16 weeks had HbA1c reduced by ≥0.5% or dose of insulin/sulphonylurea reduced by ≥25%. The reduction of systolic BP by at least 5mmHg was reported in 64% of participants receiving higher dose of medication. Publication of the results of phase II & III studies are awaited (NCT03697109).


It should be noted that the use of all these novel agents may be limited by their expense and availability.


MONITORING TREATMENT   


It is important to monitor all patients on medical therapy for Cushing’s syndrome in order to assess the effectiveness of treatment, and in particular to avoid adrenal insufficiency. Serum cortisol level and/or urine cortisol level are used in order to estimate steroid inhibitor therapy. One way is to assess the mean of 5 serum cortisol measurements across the day, although others favor measurement of urinary free cortisol (UFC). A mean serum cortisol between 150 and 300 nmol/L (5.5-11 μg/dL) corresponds to a normal cortisol production rate (387), and this range should be the aim of therapy, although this figure may be an overestimate as it is based on older cortisol assays. As mentioned above, a liquid chromatography tandem mass spectrography cortisol assay is preferable in patients on metyrapone.


When mitotane is used, only measurement of 24-hour urinary free cortisol reflects therapy effectiveness and concentration of serum free cortisol, because mitotane reduces 17-OHCS excretion, which therefore cannot stand for correct measurements. Because it raises the level of cortisol binding globulin (CBG), the level of total serum cortisol is inappropriate for monitoring of cortisol secretion, as it can be two to threefold elevated (388, 389). The high level of CBG explains why replacement dosage of steroids needs to be increased in case of an adrenal insufficiency, although these is also a contribution from increased hepatic steroid metabolism.


CUSHING’S SYNDROME IN SPECIFIC GROUPS


Chronic Renal Failure


Cushing’s syndrome in the setting of chronic renal failure is poorly described but may pose diagnostic difficulties. In chronic renal failure serum levels of cortisol are generally normal but with some radioimmunoassays may be increased (390, 391). ACTH levels are increased (392). Glomerular filtration rates of less than 30 mL/min result in decreased cortisol excretion and spuriously low UFC values (393). The ACTH and cortisol responses to ovine CRH may be suppressed in patient with renal failure except for those undergoing continuous ambulatory peritoneal dialysis (394). The metabolism of dexamethasone is normal in chronic renal failure, but the oral absorption can be altered in some patients. There is reduced degree of suppression of cortisol by dexamethasone suggesting a prolonged half-life of cortisol. Normal suppression to the overnight 1-mg LDDST is uncommon, and the 2-day LDDST does better in this regard (390, 395).


Pediatric Cushing’s Syndrome (396)


The most common presentation of Cushing’s syndrome in children is growth retardation, whilst weight increases (397). However, one proviso is that patients with virilizing adrenal tumors may show growth acceleration (398). Other virilizing signs such as acne and hirsutism are seen in approximately 50% of patients regardless of etiology (397). Hypertension and striae are seen in approximately 50% of cases (399). Muscle weakness may be less common in the pediatric patient due to increased exercise (400). Psychiatric and cognitive changes may affect school performance; however, children may show “compulsive diligence” and actually do quite well academically (401). Headaches and fatigue are common (397). Cushing’s disease accounts for the between 75% and 80% of Cushing’s syndrome in older children, but before the age of 10 years ACTH-independent causes of Cushing’s syndrome are more common. Cushing’s disease has a male predominance in pre-pubertal children. Two causes of ACTH-independent Cushing’s syndrome, McCune-Albright syndrome and PPNAD, are typically diseases of childhood or young adults. Signs of virilization in the very young (<4 years) suggest adrenal carcinoma.  Ectopic secretion of ACTH occurs rarely in the pediatric population and is usually due to bronchial or thymic carcinoids (2).


As mentioned previously, late night salivary cortisol measurement has particular logistic benefits in children (402, 403). Serum midnight cortisol measurements in in-patients has high sensitivity (404). UFC should be corrected for body surface area (405). The standard 2-day LDDST adult protocol can be used in children weighing 40kg or more, otherwise the dexamethasone dose is adjusted to 30µg/kg/day (406). As in adults there is a good correlation between the cortisol suppression on the LDDST and the HDDST for the differential diagnosis and thus the latter is unnecessary (407). Although it can be argued that the ectopic ACTH syndrome is so rare in children that BIPSS is not necessary, it does add reassurance in those with a negative pituitary MRI, which is the case in more than 50% of cases. In addition, BIPSS has arguably better accuracy in lateralization of the pituitary tumor (385). MRI is at least as useful as CT in the evaluation of adrenal causes (408).


Transsphenoidal surgery is the treatment of choice in children with Cushing's disease, with similar rates of remission as in adults in expert hands (409). Conventional radiotherapy after non-curative transsphenoidal surgery performs even better than in adults, with reported remission rates as high as 100%, with remission usually occurring within 12 months (410). Following pituitary surgery, plus or minus radiotherapy, the incidence of growth hormone deficiency is high, but prompt diagnosis and treatment with human growth hormone ensure acceptable growth acceleration and catch-up growth, although an abnormal body composition often persists (411).  Normalization of reduced bone mineral density can also be achieved (336). Adrenalectomy is first-line therapy in ACTH-independent Cushing's syndrome.


Cushing’s Syndrome in Pregnancy (412)


Cushing’s syndrome in pregnancy is fortunately rare, because ovulatory disorders and consequently infertility constitute the clinical picture in 75% of untreated patients with Cushing’s syndrome (303, 304). The epidemiology in pregnant women is different to that in the non-pregnant population, in that pregnant patients show a 60% prevalence of ACTH-independent Cushing's syndrome (48% adenoma and 10% carcinoma) followed by Cushing’s disease and bilateral adrenal hyperplasia, and rarely ectopic disease (304, 305, 413). The onset of adrenal-dependent Cushing’s syndrome may relate to the aberrant expression of LH receptors on the tumor, cross-reacting with hCG. The diagnosis is challenging because of the symptoms and signs common to both Cushing’s syndrome and normal physiological changes in pregnancy; such as weight gain, fatigue, striae, hypertension and glucose intolerance. In addition, the hormonal changes, which occur during pregnancy may confuse the interpretation of the biochemical test procedures (305).


Total serum cortisol levels increase in pregnancy, as a result of induced production of corticosteroid-binding globulin by estrogens, beginning in the first trimester and peaking at 6 months, with a decrease only after delivery. Levels of free cortisol are also raised. In contrast to patients with pathologic hypercortisolism, levels of urinary 17-OH-corticosteroid excretion are within the normal range and the cortisol diurnal rhythm is maintained, but with a higher nadir (413). UFC excretion is normal in the first trimester and then rises up to three-fold by term (414). Suppression to dexamethasone testing is blunted, especially after the first trimester (125). Plasma ACTH levels are slightly decreased in the beginning of the pregnancy, but later tends to rise, partially because of placental ACTH and CRH secretion. The circadian rhythm of cortisol is usually maintained in the first 2 trimesters of pregnancy and becomes blunted in the 3rdtrimester.


In general, biochemical evaluation follows the same principles as with the non-pregnant patients. However, there are no agreed guidelines in interpreting results of hormonal measurements in pregnant Cushing’s patients, considering normal physiological deflection of cortisol metabolism in pregnant women. As mentioned above, UFC excretion is normally increased, so if there is less than a 3-fold rise it cannot be diagnostic, and the dexamethasone response is blunted therefore cannot be used as screening test because of the possibility of a false positive result. Late night salivary cortisol is an alternative screening test for pregnant women and it was reported to remain almost unchanged during pregnancy and is therefore probably the most reliable investigation (415, 416). Therefore, the differential diagnosis regarding the possible etiology of Cushing’s syndrome can be quite demanding. If suppressed, levels of ACTH can point to adrenal origin, but lack of suppression does not eliminate the possibility of ACTH-independent cause. High-dose dexamethasone test may be useful to distinguish an adrenal cause, because women with adrenal causes tend not to suppress, while those with Cushing’s disease do (413, 417, 418).


As an initial evaluation the basal levels of ACTH and the high-dose dexamethasone test may be performed. Furthermore, due to the high prevalence of primary adrenal disease, it is reasonable to perform an abdominal ultrasound at an early stage.


The CRH test has also been used to identify patients with Cushing's disease, and there is no evidence of harm both in animal studies and the small number of pregnant patients studied with CRH.


MRI without gadolinium enhancement is considered safe in the third trimester, and its use in combination with the non-invasive tests above should be able to resolve most diagnostic issues. BIPSS with appropriate additional radiation protection for the fetus should be reserved only for the rare cases where diagnostic uncertainty remains. Ultrasound of the adrenals can be used as a first-line imaging in ACTH-independent Cushing's syndrome.


Maternal hypercortisolism is associated with 40-70% hypertension, 14-26% preeclampsia, 25-37% diabetes mellitus, 5% osteoporosis and fractures, 3% cardiac failure, 4% mental health disorders and rarely (2%) death (419, 420).


Although the fetus is partially protected from maternal hypercortisolism by placental 11--hydroxisteroid dehydrogenase type 2, which converts 85% of cortisol to inactive cortisone (405), the untreated condition is associated with miscarriage, premature delivery and neonatal adrenal insufficiency (420).


Because of both maternal and neonatal risk, definitive surgical treatment of adrenal or pituitary disease is recommended to achieve eucortisolemia. The second trimester is probably the safest time for adrenal surgery or transsphenoidal operation, although adverse fetal outcomes after the successful treatment may still persist, such as intrauterine growth restriction and premature birth, but it does appear to prevent stillborn deliveries (420)(396).


Medical treatment carries potential risks to the fetus and should be considered only as second line therapy when the benefit outweighs the risk, and generally only as an interim measure to operation or awaiting the pre-pregnancy pituitary radiation effect. Metyrapone is probably the adrenolytic agent of choice, although an association with pre-eclampsia has been reported (305). Ketoconazole has been utilized successfully in a small number of patients but is teratogenic in animals and therefore should be used with caution. Cabergoline is a safe potential treatment option for mild hypercortisolism during pregnancy.


PROGNOSIS AND COURSE AFTER EFFECTIVE TREATMENT


Before treatment was readily available, the mortality rate for Cushing’s syndrome was 50% after the first symptoms appeared, mainly due to cardiovascular, thromboembolic, infectious or hypertensive complications (421).


Even today, patients with severe hypercortisolism have an raised mortality rate due to increased coagulability and it’s the consequences or opportunistic infections (101, 422, 423), emphasizing the need for taking over the hormonal control as soon as possible. The prognosis is mainly a reflection of the underlying condition. The life expectancy of patients with non-malignant causes of Cushing's syndrome has improved dramatically with effective surgical and medical treatments.


Even when cured by strict criteria, Cushing’s disease may often recur over time (424).

From a number of studies in patients with Cushing’s disease treated in the era of transsphenoidal surgery, it initially appeared that after curative transsphenoidal surgery long-term mortality was not significantly different from that in the general population (423, 425). However, another population based study suggested that mortality is marginally increased (3),while even more recently a very significantly increased mortality was shown even in patients who remained cured. A large European Registry of 1564 patients with Cushing’s syndrome, including 1045 patients with Cushing's disease, reported 3.1% 90-day mortality in this group generally (426). The main cause of death was progression of the main disease (36%), infections (31%), and cardio- and cerebrovascular disease (17%). As expected, the highest mortality was in individuals with ectopic Cushing's syndrome (20.2%), 2.2% in patients with Cushing's disease and 1.6% in those with ACTH-independent Cushing's syndrome.


However, a large-scale meta-analysis showed that patients with Cushing’s disease who were cured at their first operation showed a normalized standardized mortality ratio, further emphasizing the importance of this modality of treatment and the necessity for an experienced surgeon. Nevertheless, while abdominal obesity may improve, hypertension and insulin resistance leading to increased cardiovascular risk with evidence of atherosclerotic disease persists when measured 5 years after remission of Cushing’s disease (87). It is therefore important to aggressively treat associated conditions such as hypertension and diabetes even when the Cushing’s per se has been controlled. Unlike some signs and symptoms that disappear gradually over the next year after successful treatment, co-morbidities such as diabetes mellitus and hypertension improve, but may not resolve completely, requiring further aggressive treatment. There is also some evidence that the outcome from Cushing's disease may be worse in males (47). Some of the signs and symptoms of Cushing’s syndrome are expected to disappear gradually over the following year after the treatment; skin thickness improves in weeks, but for some it may take longer, as does muscle strength.


The outcome of pediatric Cushing’s disease is excellent if treated at centers with appropriate experience (399, 427).


Cushing's syndrome results in significant impairment in quality of life (428, 429), psychiatric symptoms (430) and cognitive deficits (431), as previously noted. However, in general these are only partially improved with treatment, but often do not resolve completely in either children or adults.


There is some evidence that deficits in bone mass may be partially reversed after treatment of hypercortisolemia (432, 433). Bisphosphonate treatment may induce a more rapid improvement in bone mineral density (434), and should be considered (along with calcium and vitamin D supplements), but it is unclear whether they are needed for the majority of patients with osteoporosis. Osteoporosis starts to improve after 6 months, with rapid improvement over the next two years, but with the possibility of residual disease to some extent (435). However, in general the prognosis is good without any specific treatment, and the care should be expectant.


The prognosis of the potentially malignant causes of Cushing's syndrome is more variable. Adrenal cancer associated with Cushing's syndrome has an extremely poor prognosis. Tumors that produce ectopic ACTH tend to have a poorer prognosis, compared with tumors from the same tissue that do not produce ACTH. Small cell lung cancer, islet cell tumors and thymic carcinoids illustrate this phenomenon: up to 82% of patients with small cell lung cancer and Cushing’s syndrome were reported to die within 2 weeks from the start of chemotherapy (436), although currently a survival in terms of months should be expected.


REFERENCES


  1. Newell-Price J, Trainer P, Besser M, Grossman A. The diagnosis and differential diagnosis of Cushing's syndrome and pseudo-Cushing's states. Endocr Rev. 1998;19(5):647-72.
  2. Storr HL, Chan LF, Grossman AB, Savage MO. Paediatric Cushing's syndrome: epidemiology, investigation and therapeutic advances. Trends Endocrinol Metab. 2007;18(4):167-74.
  3. Etxabe J, Vazquez JA. Morbidity and mortality in Cushing's disease: an epidemiological approach. Clin Endocrinol (Oxf). 1994;40(4):479-84.
  4. Lindholm J, Juul S, Jorgensen JO, Astrup J, Bjerre P, Feldt-Rasmussen U, et al. Incidence and late prognosis of cushing's syndrome: a population-based study. J Clin Endocrinol Metab. 2001;86(1):117-23.
  5. Gicquel C, Le Bouc Y, Luton JP, Girard F, Bertagna X. Monoclonality of corticotroph macroadenomas in Cushing's disease. J Clin Endocrinol Metab. 1992;75(2):472-5.
  6. Biller BM, Alexander JM, Zervas NT, Hedley-Whyte ET, Arnold A, Klibanski A. Clonal origins of adrenocorticotropin-secreting pituitary tissue in Cushing's disease. J Clin Endocrinol Metab. 1992;75(5):1303-9.
  7. Mampalam TJ, Tyrrell JB, Wilson CB. Transsphenoidal microsurgery for Cushing disease. A report of 216 cases. Ann Intern Med. 1988;109(6):487-93.
  8. Young WF, Jr., Scheithauer BW, Gharib H, Laws ER, Jr., Carpenter PC. Cushing's syndrome due to primary multinodular corticotrope hyperplasia. Mayo Clin Proc. 1988;63(3):256-62.
  9. Holthouse DJ, Robbins PD, Kahler R, Knuckey N, Pullan P. Corticotroph pituitary carcinoma: case report and literature review. Endocr Pathol. 2001;12(3):329-41.
  10. Gaffey TA, Scheithauer BW, Lloyd RV, Burger PC, Robbins P, Fereidooni F, et al. Corticotroph carcinoma of the pituitary: a clinicopathological study. Report of four cases. J Neurosurg. 2002;96(2):352-60.
  11. Dahia PL, Grossman AB. The molecular pathogenesis of corticotroph tumors. Endocr Rev. 1999;20(2):136-55.
  12. Reincke M, Sbiera S, Hayakawa A, Theodoropoulou M, Osswald A, Beuschlein F, et al. Mutations in the deubiquitinase gene USP8 cause Cushing's disease. Nat Genet. 2015;47(1):31-8.
  13. Doppman JL, Nieman LK, Travis WD, Miller DL, Cutler GB, Jr., Chrousos GP, et al. CT and MR imaging of massive macronodular adrenocortical disease: a rare cause of autonomous primary adrenal hypercortisolism. J Comput Assist Tomogr. 1991;15(5):773-9.
  14. Aron DC, Findling JW, Fitzgerald PA, Brooks RM, Fisher FE, Forsham PH, et al. Pituitary ACTH dependency of nodular adrenal hyperplasia in Cushing's syndrome. Report of two cases and review of the literature. Am J Med. 1981;71(2):302-6.
  15. Ilias I, Torpy DJ, Pacak K, Mullen N, Wesley RA, Nieman LK. Cushing's syndrome due to ectopic corticotropin secretion: twenty years' experience at the National Institutes of Health. J Clin Endocrinol Metab. 2005;90(8):4955-62.
  16. Isidori AM, Kaltsas GA, Pozza C, Frajese V, Newell-Price J, Reznek RH, et al. The ectopic adrenocorticotropin syndrome: clinical features, diagnosis, management, and long-term follow-up. J Clin Endocrinol Metab. 2006;91(2):371-7.
  17. Aniszewski JP, Young WF, Jr., Thompson GB, Grant CS, van Heerden JA. Cushing syndrome due to ectopic adrenocorticotropic hormone secretion. World J Surg. 2001;25(7):934-40.
  18. Drouin J. 60 YEARS OF POMC: Transcriptional and epigenetic regulation of POMC gene expression. J Mol Endocrinol. 2016;56(4):T99-T112.
  19. Ye L, Li X, Kong X, Wang W, Bi Y, Hu L, et al. Hypomethylation in the promoter region of POMC gene correlates with ectopic overexpression in thymic carcinoids. J Endocrinol. 2005;185(2):337-43.
  20. Newell-Price J, King P, Clark AJ. The CpG island promoter of the human proopiomelanocortin gene is methylated in nonexpressing normal tissue and tumors and represses expression. Mol Endocrinol. 2001;15(2):338-48.
  21. Clark AJ, Lavender PM, Besser GM, Rees LH. Pro-opiomelanocortin mRNA size heterogeneity in ACTH-dependent Cushing's syndrome. J Mol Endocrinol. 1989;2(1):3-9.
  22. Stewart MF, Crosby SR, Gibson S, Twentyman PR, White A. Small cell lung cancer cell lines secrete predominantly ACTH precursor peptides not ACTH. Br J Cancer. 1989;60(1):20-4.
  23. Oliver RL, Davis JR, White A. Characterisation of ACTH related peptides in ectopic Cushing's syndrome. Pituitary. 2003;6(3):119-26.
  24. Shahani S, Nudelman RJ, Nalini R, Kim HS, Samson SL. Ectopic corticotropin-releasing hormone (CRH) syndrome from metastatic small cell carcinoma: a case report and review of the literature. Diagn Pathol. 2010;5:56.
  25. Invitti C, Pecori Giraldi F, de Martin M, Cavagnini F. Diagnosis and management of Cushing's syndrome: results of an Italian multicentre study. Study Group of the Italian Society of Endocrinology on the Pathophysiology of the Hypothalamic-Pituitary-Adrenal Axis. J Clin Endocrinol Metab. 1999;84(2):440-8.
  26. Findlay JC, Sheeler LR, Engeland WC, Aron DC. Familial adrenocorticotropin-independent Cushing's syndrome with bilateral macronodular adrenal hyperplasia. J Clin Endocrinol Metab. 1993;76(1):189-91.
  27. Lacroix A, Bolte E, Tremblay J, Dupre J, Poitras P, Fournier H, et al. Gastric inhibitory polypeptide-dependent cortisol hypersecretion--a new cause of Cushing's syndrome. N Engl J Med. 1992;327(14):974-80.
  28. Reznik Y, Allali-Zerah V, Chayvialle JA, Leroyer R, Leymarie P, Travert G, et al. Food-dependent Cushing's syndrome mediated by aberrant adrenal sensitivity to gastric inhibitory polypeptide. N Engl J Med. 1992;327(14):981-6.
  29. Karapanou O, Vlassopoulou B, Tzanela M, Stratigou T, Tsatlidis V, Tsirona S, et al. Adrenocorticotropic hormone independent macronodular adrenal hyperplasia due to aberrant receptor expression: is medical treatment always an option? Endocr Pract. 2013;19(3):e77-82.
  30. de Groot JW, Links TP, Themmen AP, Looijenga LH, de Krijger RR, van Koetsveld PM, et al. Aberrant expression of multiple hormone receptors in ACTH-independent macronodular adrenal hyperplasia causing Cushing's syndrome. Eur J Endocrinol. 2010;163(2):293-9.
  31. Assie G, Libe R, Espiard S, Rizk-Rabin M, Guimier A, Luscap W, et al. ARMC5 mutations in macronodular adrenal hyperplasia with Cushing's syndrome. N Engl J Med. 2013;369(22):2105-14.
  32. Kirk JM, Brain CE, Carson DJ, Hyde JC, Grant DB. Cushing's syndrome caused by nodular adrenal hyperplasia in children with McCune-Albright syndrome. J Pediatr. 1999;134(6):789-92.
  33. Boyce AM. Fibrous Dysplasia. In: Feingold KR, Anawalt B, Boyce A, Chrousos G, de Herder WW, Dungan K, et al., editors. Endotext. South Dartmouth (MA)2000.
  34. Weinstein LS, Shenker A, Gejman PV, Merino MJ, Friedman E, Spiegel AM. Activating mutations of the stimulatory G protein in the McCune-Albright syndrome. N Engl J Med. 1991;325(24):1688-95.
  35. Boston BA, Mandel S, LaFranchi S, Bliziotes M. Activating mutation in the stimulatory guanine nucleotide-binding protein in an infant with Cushing's syndrome and nodular adrenal hyperplasia. J Clin Endocrinol Metab. 1994;79(3):890-3.
  36. Travis WD, Tsokos M, Doppman JL, Nieman L, Chrousos GP, Cutler GB, Jr., et al. Primary pigmented nodular adrenocortical disease. A light and electron microscopic study of eight cases. Am J Surg Pathol. 1989;13(11):921-30.
  37. Kaltsas G, Kanakis G, Chrousos G. Carney Complex. In: Feingold KR, Anawalt B, Boyce A, Chrousos G, de Herder WW, Dungan K, et al., editors. Endotext. South Dartmouth (MA)2000.
  38. Kiefer FW, Winhofer Y, Iacovazzo D, Korbonits M, Wolfsberger S, Knosp E, et al. PRKAR1A mutation causing pituitary-dependent Cushing disease in a patient with Carney complex. Eur J Endocrinol. 2017;177(2):K7-K12.
  39. Hernandez-Ramirez LC, Tatsi C, Lodish MB, Faucz FR, Pankratz N, Chittiboina P, et al. Corticotropinoma as a Component of Carney Complex. J Endocr Soc. 2017;1(7):918-25.
  40. Stratakis CA, Boikos SA. Genetics of adrenal tumors associated with Cushing's syndrome: a new classification for bilateral adrenocortical hyperplasias. Nat Clin Pract Endocrinol Metab. 2007;3(11):748-57.
  41. Swords FM, Baig A, Malchoff DM, Malchoff CD, Thorner MO, King PJ, et al. Impaired desensitization of a mutant adrenocorticotropin receptor associated with apparent constitutive activity. Mol Endocrinol. 2002;16(12):2746-53.
  42. Lalau JD, Vieau D, Tenenbaum F, Westeel PF, Mesmacque A, Lenne F, et al. A case of pseudo-Nelson's syndrome: cure of ACTH hypersecretion by removal of a bronchial carcinoid tumor responsible for Cushing's syndrome. J Endocrinol Invest. 1990;13(6):531-7.
  43. Contreras P, Altieri E, Liberman C, Gac A, Rojas A, Ibarra A, et al. Adrenal rest tumor of the liver causing Cushing's syndrome: treatment with ketoconazole preceding an apparent surgical cure. J Clin Endocrinol Metab. 1985;60(1):21-8.
  44. Marieb NJ, Spangler S, Kashgarian M, Heimann A, Schwartz ML, Schwartz PE. Cushing's syndrome secondary to ectopic cortisol production by an ovarian carcinoma. J Clin Endocrinol Metab. 1983;57(4):737-40.
  45. Nicolaides NC, Pavlaki AN, Maria Alexandra MA, Chrousos GP. Glucocorticoid Therapy and Adrenal Suppression. In: Feingold KR, Anawalt B, Boyce A, Chrousos G, de Herder WW, Dungan K, et al., editors. Endotext. South Dartmouth (MA)2000.
  46. Ross EJ, Linch DC. Cushing's syndrome--killing disease: discriminatory value of signs and symptoms aiding early diagnosis. Lancet. 1982;2(8299):646-9.
  47. Pecori Giraldi F, Moro M, Cavagnini F, Study Group on the Hypothalamo-Pituitary-Adrenal Axis of the Italian Society of E. Gender-related differences in the presentation and course of Cushing's disease. J Clin Endocrinol Metab. 2003;88(4):1554-8.
  48. Valassi E, Santos A, Yaneva M, Toth M, Strasburger CJ, Chanson P, et al. The European Registry on Cushing's syndrome: 2-year experience. Baseline demographic and clinical characteristics. Eur J Endocrinol. 2011;165(3):383-92.
  49. Puglisi S, Perotti P, Pia A, Reimondo G, Terzolo M. Adrenocortical Carcinoma with Hypercortisolism. Endocrinol Metab Clin North Am. 2018;47(2):395-407.
  50. Chatzellis E, Kaltsas G. Adrenal Incidentalomas. In: Feingold KR, Anawalt B, Boyce A, Chrousos G, de Herder WW, Dungan K, et al., editors. Endotext. South Dartmouth (MA)2000.
  51. Wajchenberg BL, Bosco A, Marone MM, Levin S, Rocha M, Lerario AC, et al. Estimation of body fat and lean tissue distribution by dual energy X-ray absorptiometry and abdominal body fat evaluation by computed tomography in Cushing's disease. J Clin Endocrinol Metab. 1995;80(9):2791-4.
  52. Koch CA, Doppman JL, Watson JC, Patronas NJ, Nieman LK. Spinal epidural lipomatosis in a patient with the ectopic corticotropin syndrome. N Engl J Med. 1999;341(18):1399-400.
  53. Panzer SW, Patrinely JR, Wilson HK. Exophthalmos and iatrogenic Cushing's syndrome. Ophthalmic Plast Reconstr Surg. 1994;10(4):278-82.
  54. Baid SK, Rubino D, Sinaii N, Ramsey S, Frank A, Nieman LK. Specificity of screening tests for Cushing's syndrome in an overweight and obese population. J Clin Endocrinol Metab. 2009;94(10):3857-64.
  55. Kaltsas G, Manetti L, Grossman AB. Osteoporosis in Cushing's syndrome. Front Horm Res. 2002;30:60-72.
  56. Ilias I, Zoumakis E, Ghayee H. An Overview of Glucocorticoid Induced Osteoporosis. In: Feingold KR, Anawalt B, Boyce A, Chrousos G, de Herder WW, Dungan K, et al., editors. Endotext. South Dartmouth (MA)2000.
  57. Canalis E. Clinical review 83: Mechanisms of glucocorticoid action in bone: implications to glucocorticoid-induced osteoporosis. J Clin Endocrinol Metab. 1996;81(10):3441-7.
  58. Felson DT, Anderson JJ. Across-study evaluation of association between steroid dose and bolus steroids and avascular necrosis of bone. Lancet. 1987;1(8538):902-6.
  59. Kristo C, Jemtland R, Ueland T, Godang K, Bollerslev J. Restoration of the coupling process and normalization of bone mass following successful treatment of endogenous Cushing's syndrome: a prospective, long-term study. Eur J Endocrinol. 2006;154(1):109-18.
  60. Toth M, Grossman A. Glucocorticoid-induced osteoporosis: lessons from Cushing's syndrome. Clin Endocrinol (Oxf). 2013;79(1):1-11.
  61. Wajchenberg BL, Mendonca BB, Liberman B, Pereira MA, Carneiro PC, Wakamatsu A, et al. Ectopic adrenocorticotropic hormone syndrome. Endocr Rev. 1994;15(6):752-87.
  62. Orth DN. Cushing's syndrome. N Engl J Med. 1995;332(12):791-803.
  63. Lado-Abeal J, Rodriguez-Arnao J, Newell-Price JD, Perry LA, Grossman AB, Besser GM, et al. Menstrual abnormalities in women with Cushing's disease are correlated with hypercortisolemia rather than raised circulating androgen levels. J Clin Endocrinol Metab. 1998;83(9):3083-8.
  64. Luton JP, Thieblot P, Valcke JC, Mahoudeau JA, Bricaire H. Reversible gonadotropin deficiency in male Cushing's disease. J Clin Endocrinol Metab. 1977;45(3):488-95.
  65. Kaltsas GA, Korbonits M, Isidori AM, Webb JA, Trainer PJ, Monson JP, et al. How common are polycystic ovaries and the polycystic ovarian syndrome in women with Cushing's syndrome? Clin Endocrinol (Oxf). 2000;53(4):493-500.
  66. Giustina A, Bossoni S, Bussi AR, Pozzi A, Wehrenberg WB. Effect of galanin on the growth hormone (GH) response to GH-releasing hormone in patients with Cushing's disease. Endocr Res. 1993;19(1):47-56.
  67. Bartalena L, Martino E, Petrini L, Velluzzi F, Loviselli A, Grasso L, et al. The nocturnal serum thyrotropin surge is abolished in patients with adrenocorticotropin (ACTH)-dependent or ACTH-independent Cushing's syndrome. J Clin Endocrinol Metab. 1991;72(6):1195-9.
  68. Colao A, Pivonello R, Faggiano A, Filippella M, Ferone D, Di Somma C, et al. Increased prevalence of thyroid autoimmunity in patients successfully treated for Cushing's disease. Clin Endocrinol (Oxf). 2000;53(1):13-9.
  69. Niepomniszcze H, Pitoia F, Katz SB, Chervin R, Bruno OD. Primary thyroid disorders in endogenous Cushing's syndrome. Eur J Endocrinol. 2002;147(3):305-11.
  70. Stewart PM, Krozowski ZS. 11 beta-Hydroxysteroid dehydrogenase. Vitam Horm. 1999;57:249-324.
  71. Christy NP, Laragh JH. Pathogenesis of hypokalemic alkalosis in Cushing's syndrome. N Engl J Med. 1961;265:1083-8.
  72. Biering H, Knappe G, Gerl H, Lochs H. [Prevalence of diabetes in acromegaly and Cushing syndrome]. Acta Med Austriaca. 2000;27(1):27-31.
  73. Pivonello R, Isidori AM, De Martino MC, Newell-Price J, Biller BM, Colao A. Complications of Cushing's syndrome: state of the art. Lancet Diabetes Endocrinol. 2016;4(7):611-29.
  74. Arnaldi G, Angeli A, Atkinson AB, Bertagna X, Cavagnini F, Chrousos GP, et al. Diagnosis and complications of Cushing's syndrome: a consensus statement. J Clin Endocrinol Metab. 2003;88(12):5593-602.
  75. Feingold KR. Atypical Forms of Diabetes. In: Feingold KR, Anawalt B, Boyce A, Chrousos G, de Herder WW, Dungan K, et al., editors. Endotext. South Dartmouth (MA)2000.
  76. Catargi B, Rigalleau V, Poussin A, Ronci-Chaix N, Bex V, Vergnot V, et al. Occult Cushing's syndrome in type-2 diabetes. J Clin Endocrinol Metab. 2003;88(12):5808-13.
  77. Krarup T, Krarup T, Hagen C. Do patients with type 2 diabetes mellitus have an increased prevalence of Cushing's syndrome? Diabetes Metab Res Rev. 2012;28(3):219-27.
  78. Mullan K, Black N, Thiraviaraj A, Bell PM, Burgess C, Hunter SJ, et al. Is there value in routine screening for Cushing's syndrome in patients with diabetes? J Clin Endocrinol Metab. 2010;95(5):2262-5.
  79. Newsome S, Chen K, Hoang J, Wilson JD, Potter JM, Hickman PE. Cushing's syndrome in a clinic population with diabetes. Intern Med J. 2008;38(3):178-82.
  80. Nieman LK, Biller BM, Findling JW, Newell-Price J, Savage MO, Stewart PM, et al. The diagnosis of Cushing's syndrome: an Endocrine Society Clinical Practice Guideline. J Clin Endocrinol Metab. 2008;93(5):1526-40.
  81. Chiodini I, Morelli V, Salcuni AS, Eller-Vainicher C, Torlontano M, Coletti F, et al. Beneficial metabolic effects of prompt surgical treatment in patients with an adrenal incidentaloma causing biochemical hypercortisolism. J Clin Endocrinol Metab. 2010;95(6):2736-45.
  82. Feingold KR, Brinton EA, Grunfeld C. The Effect of Endocrine Disorders on Lipids and Lipoproteins. In: Feingold KR, Anawalt B, Boyce A, Chrousos G, de Herder WW, Dungan K, et al., editors. Endotext. South Dartmouth (MA)2000.
  83. Arnaldi G, Scandali VM, Trementino L, Cardinaletti M, Appolloni G, Boscaro M. Pathophysiology of dyslipidemia in Cushing's syndrome. Neuroendocrinology. 2010;92 Suppl 1:86-90.
  84. Neary NM, Booker OJ, Abel BS, Matta JR, Muldoon N, Sinaii N, et al. Hypercortisolism is associated with increased coronary arterial atherosclerosis: analysis of noninvasive coronary angiography using multidetector computerized tomography. J Clin Endocrinol Metab. 2013;98(5):2045-52.
  85. Torpy DJ, Mullen N, Ilias I, Nieman LK. Association of hypertension and hypokalemia with Cushing's syndrome caused by ectopic ACTH secretion: a series of 58 cases. Ann N Y Acad Sci. 2002;970:134-44.
  86. De Leo M, Pivonello R, Auriemma RS, Cozzolino A, Vitale P, Simeoli C, et al. Cardiovascular disease in Cushing's syndrome: heart versus vasculature. Neuroendocrinology. 2010;92 Suppl 1:50-4.
  87. Colao A, Pivonello R, Spiezia S, Faggiano A, Ferone D, Filippella M, et al. Persistence of increased cardiovascular risk in patients with Cushing's disease after five years of successful cure. J Clin Endocrinol Metab. 1999;84(8):2664-72.
  88. Faggiano A, Pivonello R, Spiezia S, De Martino MC, Filippella M, Di Somma C, et al. Cardiovascular risk factors and common carotid artery caliber and stiffness in patients with Cushing's disease during active disease and 1 year after disease remission. J Clin Endocrinol Metab. 2003;88(6):2527-33.
  89. Jyotsna VP, Naseer A, Sreenivas V, Gupta N, Deepak KK. Effect of Cushing's syndrome - Endogenous hypercortisolemia on cardiovascular autonomic functions. Auton Neurosci. 2011;160(1-2):99-102.
  90. Alexandraki KI, Kaltsas GA, Vouliotis AI, Papaioannou TG, Trisk L, Zilos A, et al. Specific electrocardiographic features associated with Cushing's disease. Clin Endocrinol (Oxf). 2011;74(5):558-64.
  91. Trementino L, Arnaldi G, Appolloni G, Daidone V, Scaroni C, Casonato A, et al. Coagulopathy in Cushing's syndrome. Neuroendocrinology. 2010;92 Suppl 1:55-9.
  92. Stuijver DJ, van Zaane B, Feelders RA, Debeij J, Cannegieter SC, Hermus AR, et al. Incidence of venous thromboembolism in patients with Cushing's syndrome: a multicenter cohort study. J Clin Endocrinol Metab. 2011;96(11):3525-32.
  93. Boscaro M, Sonino N, Scarda A, Barzon L, Fallo F, Sartori MT, et al. Anticoagulant prophylaxis markedly reduces thromboembolic complications in Cushing's syndrome. J Clin Endocrinol Metab. 2002;87(8):3662-6.
  94. van der Pas R, Leebeek FW, Hofland LJ, de Herder WW, Feelders RA. Hypercoagulability in Cushing's syndrome: prevalence, pathogenesis and treatment. Clin Endocrinol (Oxf). 2013;78(4):481-8.
  95. Kelly W. Exophthalmos in Cushing's syndrome. Clin Endocrinol (Oxf). 1996;45(2):167-70.
  96. Kelly WF. Psychiatric aspects of Cushing's syndrome. QJM. 1996;89(7):543-51.
  97. Santos A, Resmini E, Pascual JC, Crespo I, Webb SM. Psychiatric Symptoms in Patients with Cushing's Syndrome: Prevalence, Diagnosis and Management. Drugs. 2017;77(8):829-42.
  98. Forget H, Lacroix A, Somma M, Cohen H. Cognitive decline in patients with Cushing's syndrome. J Int Neuropsychol Soc. 2000;6(1):20-9.
  99. Starkman MN, Gebarski SS, Berent S, Schteingart DE. Hippocampal formation volume, memory dysfunction, and cortisol levels in patients with Cushing's syndrome. Biol Psychiatry. 1992;32(9):756-65.
  100. Scheinman RI, Cogswell PC, Lofquist AK, Baldwin AS, Jr. Role of transcriptional activation of I kappa B alpha in mediation of immunosuppression by glucocorticoids. Science. 1995;270(5234):283-6.
  101. Sarlis NJ, Chanock SJ, Nieman LK. Cortisolemic indices predict severe infections in Cushing syndrome due to ectopic production of adrenocorticotropin. J Clin Endocrinol Metab. 2000;85(1):42-7.
  102. Meinardi JR, Wolffenbuttel BH, Dullaart RP. Cyclic Cushing's syndrome: a clinical challenge. Eur J Endocrinol. 2007;157(3):245-54.
  103. Valassi E, Franz H, Brue T, Feelders RA, Netea-Maier R, Tsagarakis S, et al. Diagnostic tests for Cushing's syndrome differ from published guidelines: data from ERCUSYN. Eur J Endocrinol. 2017;176(5):613-24.
  104. Carroll T, Raff H, Findling JW. Late-night salivary cortisol for the diagnosis of Cushing syndrome: a meta-analysis. Endocr Pract. 2009;15(4):335-42.
  105. Liu H, Bravata DM, Cabaccan J, Raff H, Ryzen E. Elevated late-night salivary cortisol levels in elderly male type 2 diabetic veterans. Clin Endocrinol (Oxf). 2005;63(6):642-9.
  106. Raff H. Utility of salivary cortisol measurements in Cushing's syndrome and adrenal insufficiency. J Clin Endocrinol Metab. 2009;94(10):3647-55.
  107. Masserini B, Morelli V, Bergamaschi S, Ermetici F, Eller-Vainicher C, Barbieri AM, et al. The limited role of midnight salivary cortisol levels in the diagnosis of subclinical hypercortisolism in patients with adrenal incidentaloma. Eur J Endocrinol. 2009;160(1):87-92.
  108. Castro M, Elias PC, Quidute AR, Halah FP, Moreira AC. Out-patient screening for Cushing's syndrome: the sensitivity of the combination of circadian rhythm and overnight dexamethasone suppression salivary cortisol tests. J Clin Endocrinol Metab. 1999;84(3):878-82.
  109. Nunes ML, Vattaut S, Corcuff JB, Rault A, Loiseau H, Gatta B, et al. Late-night salivary cortisol for diagnosis of overt and subclinical Cushing's syndrome in hospitalized and ambulatory patients. J Clin Endocrinol Metab. 2009;94(2):456-62.
  110. Carrasco CA, Coste J, Guignat L, Groussin L, Dugue MA, Gaillard S, et al. Midnight salivary cortisol determination for assessing the outcome of transsphenoidal surgery in Cushing's disease. J Clin Endocrinol Metab. 2008;93(12):4728-34.
  111. Doherty GM, Nieman LK, Cutler GB, Jr., Chrousos GP, Norton JA. Time to recovery of the hypothalamic-pituitary-adrenal axis after curative resection of adrenal tumors in patients with Cushing's syndrome. Surgery. 1990;108(6):1085-90.
  112. Galm BP, Qiao N, Klibanski A, Biller BMK, Tritos NA. Accuracy of Laboratory Tests for the Diagnosis of Cushing Syndrome. J Clin Endocrinol Metab. 2020;105(6).
  113. Corcuff JB, Tabarin A, Rashedi M, Duclos M, Roger P, Ducassou D. Overnight urinary free cortisol determination: a screening test for the diagnosis of Cushing's syndrome. Clin Endocrinol (Oxf). 1998;48(4):503-8.
  114. Yanovski JA, Cutler GB, Jr., Chrousos GP, Nieman LK. Corticotropin-releasing hormone stimulation following low-dose dexamethasone administration. A new test to distinguish Cushing's syndrome from pseudo-Cushing's states. JAMA. 1993;269(17):2232-8.
  115. Carroll BJ, Curtis GC, Davies BM, Mendels J, Sugerman AA. Urinary free cortisol excretion in depression. Psychol Med. 1976;6(1):43-50.
  116. Vila R, Granada ML, Guitierrez RM, Fernandez-Lopez JA, Remesar X, Formiguera X, et al. Urinary free cortisol excretion pattern in morbid obese women. Endocr Res. 2001;27(1-2):261-8.
  117. Lin CL, Wu TJ, Machacek DA, Jiang NS, Kao PC. Urinary free cortisol and cortisone determined by high performance liquid chromatography in the diagnosis of Cushing's syndrome. J Clin Endocrinol Metab. 1997;82(1):151-5.
  118. Meikle AW, Findling J, Kushnir MM, Rockwood AL, Nelson GJ, Terry AH. Pseudo-Cushing syndrome caused by fenofibrate interference with urinary cortisol assayed by high-performance liquid chromatography. J Clin Endocrinol Metab. 2003;88(8):3521-4.
  119. Liddle GW. Tests of pituitary-adrenal suppressibility in the diagnosis of Cushing's syndrome. J Clin Endocrinol Metab. 1960;20:1539-60.
  120. Kennedy L, Atkinson AB, Johnston H, Sheridan B, Hadden DR. Serum cortisol concentrations during low dose dexamethasone suppression test to screen for Cushing's syndrome. Br Med J (Clin Res Ed). 1984;289(6453):1188-91.
  121. Nugent CA, Nichols T, Tyler FH. Diagnosis of Cushing's Syndrome; Single Dose Dexamethasone Suppression Test. Arch Intern Med. 1965;116:172-6.
  122. McHardy-Young S, Harris PW, Lessof MH, Lyne C. Singledose dexamethasone suppression test for Cushing's Syndrome. Br Med J. 1967;2(5554):740-4.
  123. Shimizu N, Yoshida H. Studies on the "low dose" suppressible Cushing's disease. Endocrinol Jpn. 1976;23(6):479-84.
  124. Crapo L. Cushing's syndrome: a review of diagnostic tests. Metabolism. 1979;28(9):955-77.
  125. Odagiri E, Demura R, Demura H, Suda T, Ishiwatari N, Abe Y, et al. The changes in plasma cortisol and urinary free cortisol by an overnight dexamethasone suppression test in patients with Cushing's disease. Endocrinol Jpn. 1988;35(6):795-802.
  126. Wood PJ, Barth JH, Freedman DB, Perry L, Sheridan B. Evidence for the low dose dexamethasone suppression test to screen for Cushing's syndrome--recommendations for a protocol for biochemistry laboratories. Ann Clin Biochem. 1997;34 ( Pt 3):222-9.
  127. Doppman JL, Chang R, Oldfield EH, Chrousos G, Stratakis CA, Nieman LK. The hypoplastic inferior petrosal sinus: a potential source of false-negative results in petrosal sampling for Cushing's disease. J Clin Endocrinol Metab. 1999;84(2):533-40.
  128. Bernini GP, Argenio GF, Cerri F, Franchi F. Comparison between the suppressive effects of dexamethasone and loperamide on cortisol and ACTH secretion in some pathological conditions. J Endocrinol Invest. 1994;17(10):799-804.
  129. Newell-Price J, Trainer P, Perry L, Wass J, Grossman A, Besser M. A single sleeping midnight cortisol has 100% sensitivity for the diagnosis of Cushing's syndrome. Clin Endocrinol (Oxf). 1995;43(5):545-50.
  130. Trainer PJ, Grossman A. The diagnosis and differential diagnosis of Cushing's syndrome. Clin Endocrinol (Oxf). 1991;34(4):317-30.
  131. Papanicolaou DA, Yanovski JA, Cutler GB, Jr., Chrousos GP, Nieman LK. A single midnight serum cortisol measurement distinguishes Cushing's syndrome from pseudo-Cushing states. J Clin Endocrinol Metab. 1998;83(4):1163-7.
  132. Nieman L. Editorial: The dexamethasone-suppressed corticotropin-releasing hormone test for the diagnosis of Cushing's syndrome: what have we learned in 14 years? J Clin Endocrinol Metab. 2007;92(8):2876-8.
  133. Van Cauter E, Refetoff S. Evidence for two subtypes of Cushing's disease based on the analysis of episodic cortisol secretion. N Engl J Med. 1985;312(21):1343-9.
  134. Lytras N, Grossman A, Perry L, Tomlin S, Wass JA, Coy DH, et al. Corticotrophin releasing factor: responses in normal subjects and patients with disorders of the hypothalamus and pituitary. Clin Endocrinol (Oxf). 1984;20(1):71-84.
  135. Greene LW, Geer EB, Page-Wilson G, Findling JW, Raff H. Assay-Specific Spurious ACTH Results Lead to Misdiagnosis, Unnecessary Testing, and Surgical Misadventure-A Case Series. J Endocr Soc. 2019;3(4):763-72.
  136. Fig LM, Gross MD, Shapiro B, Ehrmann DA, Freitas JE, Schteingart DE, et al. Adrenal localization in the adrenocorticotropic hormone-independent Cushing syndrome. Ann Intern Med. 1988;109(7):547-53.
  137. Wagner-Bartak NA, Baiomy A, Habra MA, Mukhi SV, Morani AC, Korivi BR, et al. Cushing Syndrome: Diagnostic Workup and Imaging Features, With Clinical and Pathologic Correlation. AJR Am J Roentgenol. 2017;209(1):19-32.
  138. Doppman JL, Miller DL, Dwyer AJ, Loughlin T, Nieman L, Cutler GB, et al. Macronodular adrenal hyperplasia in Cushing disease. Radiology. 1988;166(2):347-52.
  139. Blake MA, Kalra MK, Sweeney AT, Lucey BC, Maher MM, Sahani DV, et al. Distinguishing benign from malignant adrenal masses: multi-detector row CT protocol with 10-minute delay. Radiology. 2006;238(2):578-85.
  140. Wei J, Li S, Liu Q, Zhu Y, Wu N, Tang Y, et al. ACTH-independent Cushing's syndrome with bilateral cortisol-secreting adrenal adenomas: a case report and review of literatures. BMC Endocr Disord. 2018;18(1):22.
  141. Doppman JL, Travis WD, Nieman L, Miller DL, Chrousos GP, Gomez MT, et al. Cushing syndrome due to primary pigmented nodular adrenocortical disease: findings at CT and MR imaging. Radiology. 1989;172(2):415-20.
  142. Malchoff CD, Rosa J, DeBold CR, Kozol RA, Ramsby GR, Page DL, et al. Adrenocorticotropin-independent bilateral macronodular adrenal hyperplasia: an unusual cause of Cushing's syndrome. J Clin Endocrinol Metab. 1989;68(4):855-60.
  143. Sohaib SA, Hanson JA, Newell-Price JD, Trainer PJ, Monson JP, Grossman AB, et al. CT appearance of the adrenal glands in adrenocorticotrophic hormone-dependent Cushing's syndrome. AJR Am J Roentgenol. 1999;172(4):997-1002.
  144. Newell-Price J, Morris DG, Drake WM, Korbonits M, Monson JP, Besser GM, et al. Optimal response criteria for the human CRH test in the differential diagnosis of ACTH-dependent Cushing's syndrome. J Clin Endocrinol Metab. 2002;87(4):1640-5.
  145. Howlett TA, Drury PL, Perry L, Doniach I, Rees LH, Besser GM. Diagnosis and management of ACTH-dependent Cushing's syndrome: comparison of the features in ectopic and pituitary ACTH production. Clin Endocrinol (Oxf). 1986;24(6):699-713.
  146. Findling JW, Kehoe ME, Shaker JL, Raff H. Routine inferior petrosal sinus sampling in the differential diagnosis of adrenocorticotropin (ACTH)-dependent Cushing's syndrome: early recognition of the occult ectopic ACTH syndrome. J Clin Endocrinol Metab. 1991;73(2):408-13.
  147. Oldfield EH, Doppman JL, Nieman LK, Chrousos GP, Miller DL, Katz DA, et al. Petrosal sinus sampling with and without corticotropin-releasing hormone for the differential diagnosis of Cushing's syndrome. N Engl J Med. 1991;325(13):897-905.
  148. Kaltsas GA, Giannulis MG, Newell-Price JD, Dacie JE, Thakkar C, Afshar F, et al. A critical analysis of the value of simultaneous inferior petrosal sinus sampling in Cushing's disease and the occult ectopic adrenocorticotropin syndrome. J Clin Endocrinol Metab. 1999;84(2):487-92.
  149. Colao A, Faggiano A, Pivonello R, Pecori Giraldi F, Cavagnini F, Lombardi G, et al. Inferior petrosal sinus sampling in the differential diagnosis of Cushing's syndrome: results of an Italian multicenter study. Eur J Endocrinol. 2001;144(5):499-507.
  150. Swearingen B, Katznelson L, Miller K, Grinspoon S, Waltman A, Dorer DJ, et al. Diagnostic errors after inferior petrosal sinus sampling. J Clin Endocrinol Metab. 2004;89(8):3752-63.
  151. Wang H, Ba Y, Xing Q, Cai RC. Differential diagnostic value of bilateral inferior Petrosal sinus sampling (BIPSS) in ACTH-dependent Cushing syndrome: a systematic review and Meta-analysis. BMC Endocr Disord. 2020;20(1):143.
  152. Yamamoto Y, Davis DH, Nippoldt TB, Young WF, Jr., Huston J, 3rd, Parisi JE. False-positive inferior petrosal sinus sampling in the diagnosis of Cushing's disease. Report of two cases. J Neurosurg. 1995;83(6):1087-91.
  153. McCance DR, McIlrath E, McNeill A, Gordon DS, Hadden DR, Kennedy L, et al. Bilateral inferior petrosal sinus sampling as a routine procedure in ACTH-dependent Cushing's syndrome. Clin Endocrinol (Oxf). 1989;30(2):157-66.
  154. Machado MC, de Sa SV, Domenice S, Fragoso MC, Puglia P, Jr., Pereira MA, et al. The role of desmopressin in bilateral and simultaneous inferior petrosal sinus sampling for differential diagnosis of ACTH-dependent Cushing's syndrome. Clin Endocrinol (Oxf). 2007;66(1):136-42.
  155. Miller DL, Doppman JL, Peterman SB, Nieman LK, Oldfield EH, Chang R. Neurologic complications of petrosal sinus sampling. Radiology. 1992;185(1):143-7.
  156. Lefournier V, Gatta B, Martinie M, Vasdev A, Tabarin A, Bessou P, et al. One transient neurological complication (sixth nerve palsy) in 166 consecutive inferior petrosal sinus samplings for the etiological diagnosis of Cushing's syndrome. J Clin Endocrinol Metab. 1999;84(9):3401-2.
  157. Rotman-Pikielny P, Patronas N, Papanicolaou DA. Pituitary apoplexy induced by corticotrophin-releasing hormone in a patient with Cushing's disease. Clin Endocrinol (Oxf). 2003;58(5):545-9.
  158. Erickson D, Huston J, 3rd, Young WF, Jr., Carpenter PC, Wermers RA, Bonelli FS, et al. Internal jugular vein sampling in adrenocorticotropic hormone-dependent Cushing's syndrome: a comparison with inferior petrosal sinus sampling. Clin Endocrinol (Oxf). 2004;60(4):413-9.
  159. Sharma ST, Raff H, Nieman LK. Prolactin as a marker of successful catheterization during IPSS in patients with ACTH-dependent Cushing's syndrome. J Clin Endocrinol Metab. 2011;96(12):3687-94.
  160. Tabarin A, Greselle JF, San-Galli F, Leprat F, Caille JM, Latapie JL, et al. Usefulness of the corticotropin-releasing hormone test during bilateral inferior petrosal sinus sampling for the diagnosis of Cushing's disease. J Clin Endocrinol Metab. 1991;73(1):53-9.
  161. Landolt AM, Schubiger O, Maurer R, Girard J. The value of inferior petrosal sinus sampling in diagnosis and treatment of Cushing's disease. Clin Endocrinol (Oxf). 1994;40(4):485-92.
  162. Lefournier V, Martinie M, Vasdev A, Bessou P, Passagia JG, Labat-Moleur F, et al. Accuracy of bilateral inferior petrosal or cavernous sinuses sampling in predicting the lateralization of Cushing's disease pituitary microadenoma: influence of catheter position and anatomy of venous drainage. J Clin Endocrinol Metab. 2003;88(1):196-203.
  163. Wind JJ, Lonser RR, Nieman LK, DeVroom HL, Chang R, Oldfield EH. The lateralization accuracy of inferior petrosal sinus sampling in 501 patients with Cushing's disease. J Clin Endocrinol Metab. 2013;98(6):2285-93.
  164. Liu Z, Zhang X, Wang Z, You H, Li M, Feng F, et al. High positive predictive value of the combined pituitary dynamic enhanced MRI and high-dose dexamethasone suppression tests in the diagnosis of Cushing's disease bypassing bilateral inferior petrosal sinus sampling. Sci Rep. 2020;10(1):14694.
  165. Lienhardt A, Grossman AB, Dacie JE, Evanson J, Huebner A, Afshar F, et al. Relative contributions of inferior petrosal sinus sampling and pituitary imaging in the investigation of children and adolescents with ACTH-dependent Cushing's syndrome. J Clin Endocrinol Metab. 2001;86(12):5711-4.
  166. Morris DG, Grossman AB. Dynamic tests in the diagnosis and differential diagnosis of Cushing's syndrome. J Endocrinol Invest. 2003;26(7 Suppl):64-73.
  167. Miller DL, Doppman JL, Nieman LK, Cutler GB, Jr., Chrousos G, Loriaux DL, et al. Petrosal sinus sampling: discordant lateralization of ACTH-secreting pituitary microadenomas before and after stimulation with corticotropin-releasing hormone. Radiology. 1990;176(2):429-31.
  168. Strott CA, Nugent CA, Tyler FH. Cushing's syndrome caused by bronchial adenomas. Am J Med. 1968;44(1):97-104.
  169. Malchoff CD, Orth DN, Abboud C, Carney JA, Pairolero PC, Carey RM. Ectopic ACTH syndrome caused by a bronchial carcinoid tumor responsive to dexamethasone, metyrapone, and corticotropin-releasing factor. Am J Med. 1988;84(4):760-4.
  170. Dichek HL, Nieman LK, Oldfield EH, Pass HI, Malley JD, Cutler GB, Jr. A comparison of the standard high dose dexamethasone suppression test and the overnight 8-mg dexamethasone suppression test for the differential diagnosis of adrenocorticotropin-dependent Cushing's syndrome. J Clin Endocrinol Metab. 1994;78(2):418-22.
  171. Nieman LK, Chrousos GP, Oldfield EH, Avgerinos PC, Cutler GB, Jr., Loriaux DL. The ovine corticotropin-releasing hormone stimulation test and the dexamethasone suppression test in the differential diagnosis of Cushing's syndrome. Ann Intern Med. 1986;105(6):862-7.
  172. Grossman AB, Howlett TA, Perry L, Coy DH, Savage MO, Lavender P, et al. CRF in the differential diagnosis of Cushing's syndrome: a comparison with the dexamethasone suppression test. Clin Endocrinol (Oxf). 1988;29(2):167-78.
  173. Tyrrell JB, Findling JW, Aron DC, Fitzgerald PA, Forsham PH. An overnight high-dose dexamethasone suppression test for rapid differential diagnosis of Cushing's syndrome. Ann Intern Med. 1986;104(2):180-6.
  174. Isidori AM, Kaltsas GA, Mohammed S, Morris DG, Jenkins P, Chew SL, et al. Discriminatory value of the low-dose dexamethasone suppression test in establishing the diagnosis and differential diagnosis of Cushing's syndrome. J Clin Endocrinol Metab. 2003;88(11):5299-306.
  175. Trainer PJ, Faria M, Newell-Price J, Browne P, Kopelman P, Coy DH, et al. A comparison of the effects of human and ovine corticotropin-releasing hormone on the pituitary-adrenal axis. J Clin Endocrinol Metab. 1995;80(2):412-7.
  176. Trainer PJ, Woods RJ, Korbonits M, Popovic V, Stewart PM, Lowry PJ, et al. The pathophysiology of circulating corticotropin-releasing hormone-binding protein levels in the human. J Clin Endocrinol Metab. 1998;83(5):1611-4.
  177. Nieman LK, Oldfield EH, Wesley R, Chrousos GP, Loriaux DL, Cutler GB, Jr. A simplified morning ovine corticotropin-releasing hormone stimulation test for the differential diagnosis of adrenocorticotropin-dependent Cushing's syndrome. J Clin Endocrinol Metab. 1993;77(5):1308-12.
  178. Pecori Giraldi F, Invitti C, Cavagnini F, Study Group of the Italian Society of Endocrinology on the Pathophysiology of the Hypothalamic-pituitary-adrenal a. The corticotropin-releasing hormone test in the diagnosis of ACTH-dependent Cushing's syndrome: a reappraisal. Clin Endocrinol (Oxf). 2001;54(5):601-7.
  179. Hermus AR, Pieters GF, Pesman GJ, Smals AG, Benraad TJ, Kloppenborg PW. The corticotropin-releasing-hormone test versus the high-dose dexamethasone test in the differential diagnosis of Cushing's syndrome. Lancet. 1986;2(8506):540-4.
  180. Woo YS, Isidori AM, Wat WZ, Kaltsas GA, Afshar F, Sabin I, et al. Clinical and biochemical characteristics of adrenocorticotropin-secreting macroadenomas. J Clin Endocrinol Metab. 2005;90(8):4963-9.
  181. Korbonits M, Kaltsas G, Perry LA, Putignano P, Grossman AB, Besser GM, et al. The growth hormone secretagogue hexarelin stimulates the hypothalamo-pituitary-adrenal axis via arginine vasopressin. J Clin Endocrinol Metab. 1999;84(7):2489-95.
  182. Korbonits M, Bustin SA, Kojima M, Jordan S, Adams EF, Lowe DG, et al. The expression of the growth hormone secretagogue receptor ligand ghrelin in normal and abnormal human pituitary and other neuroendocrine tumors. J Clin Endocrinol Metab. 2001;86(2):881-7.
  183. Tabarin A, San Galli F, Dezou S, Leprat F, Corcuff JB, Latapie JL, et al. The corticotropin-releasing factor test in the differential diagnosis of Cushing's syndrome: a comparison with the lysine-vasopressin test. Acta Endocrinol (Copenh). 1990;123(3):331-8.
  184. Malerbi DA, Mendonca BB, Liberman B, Toledo SP, Corradini MC, Cunha-Neto MB, et al. The desmopressin stimulation test in the differential diagnosis of Cushing's syndrome. Clin Endocrinol (Oxf). 1993;38(5):463-72.
  185. Ghigo E, Arvat E, Ramunni J, Colao A, Gianotti L, Deghenghi R, et al. Adrenocorticotropin- and cortisol-releasing effect of hexarelin, a synthetic growth hormone-releasing peptide, in normal subjects and patients with Cushing's syndrome. J Clin Endocrinol Metab. 1997;82(8):2439-44.
  186. Newell-Price J, Perry L, Medbak S, Monson J, Savage M, Besser M, et al. A combined test using desmopressin and corticotropin-releasing hormone in the differential diagnosis of Cushing's syndrome. J Clin Endocrinol Metab. 1997;82(1):176-81.
  187. Tsagarakis S, Tsigos C, Vasiliou V, Tsiotra P, Kaskarelis J, Sotiropoulou C, et al. The desmopressin and combined CRH-desmopressin tests in the differential diagnosis of ACTH-dependent Cushing's syndrome: constraints imposed by the expression of V2 vasopressin receptors in tumors with ectopic ACTH secretion. J Clin Endocrinol Metab. 2002;87(4):1646-53.
  188. Korbonits M, Jacobs RA, Aylwin SJ, Burrin JM, Dahia PL, Monson JP, et al. Expression of the growth hormone secretagogue receptor in pituitary adenomas and other neuroendocrine tumors. J Clin Endocrinol Metab. 1998;83(10):3624-30.
  189. Evanson J. Radiology of the Pituitary. In: Feingold KR, Anawalt B, Boyce A, Chrousos G, de Herder WW, Dungan K, et al., editors. Endotext. South Dartmouth (MA)2000.
  190. Hall WA, Luciano MG, Doppman JL, Patronas NJ, Oldfield EH. Pituitary magnetic resonance imaging in normal human volunteers: occult adenomas in the general population. Ann Intern Med. 1994;120(10):817-20.
  191. Patronas N, Bulakbasi N, Stratakis CA, Lafferty A, Oldfield EH, Doppman J, et al. Spoiled gradient recalled acquisition in the steady state technique is superior to conventional postcontrast spin echo technique for magnetic resonance imaging detection of adrenocorticotropin-secreting pituitary tumors. J Clin Endocrinol Metab. 2003;88(4):1565-9.
  192. Tabarin A, Laurent F, Catargi B, Olivier-Puel F, Lescene R, Berge J, et al. Comparative evaluation of conventional and dynamic magnetic resonance imaging of the pituitary gland for the diagnosis of Cushing's disease. Clin Endocrinol (Oxf). 1998;49(3):293-300.
  193. Findling JW, Doppman JL. Biochemical and radiologic diagnosis of Cushing's syndrome. Endocrinol Metab Clin North Am. 1994;23(3):511-37.
  194. Chatain GP, Patronas N, Smirniotopoulos JG, Piazza M, Benzo S, Ray-Chaudhury A, et al. Potential utility of FLAIR in MRI-negative Cushing's disease. J Neurosurg. 2018;129(3):620-8.
  195. Escourolle H, Abecassis JP, Bertagna X, Guilhaume B, Pariente D, Derome P, et al. Comparison of computerized tomography and magnetic resonance imaging for the examination of the pituitary gland in patients with Cushing's disease. Clin Endocrinol (Oxf). 1993;39(3):307-13.
  196. de Herder WW, Uitterlinden P, Pieterman H, Tanghe HL, Kwekkeboom DJ, Pols HA, et al. Pituitary tumour localization in patients with Cushing's disease by magnetic resonance imaging. Is there a place for petrosal sinus sampling? Clin Endocrinol (Oxf). 1994;40(1):87-92.
  197. Buchfelder M, Nistor R, Fahlbusch R, Huk WJ. The accuracy of CT and MR evaluation of the sella turcica for detection of adrenocorticotropic hormone-secreting adenomas in Cushing disease. AJNR Am J Neuroradiol. 1993;14(5):1183-90.
  198. Doppman JL, Pass HI, Nieman LK, Findling JW, Dwyer AJ, Feuerstein IM, et al. Detection of ACTH-producing bronchial carcinoid tumors: MR imaging vs CT. AJR Am J Roentgenol. 1991;156(1):39-43.
  199. de Herder WW, Lamberts SW. Tumor localization--the ectopic ACTH syndrome. J Clin Endocrinol Metab. 1999;84(4):1184-5.
  200. Tabarin A, Valli N, Chanson P, Bachelot Y, Rohmer V, Bex-Bachellerie V, et al. Usefulness of somatostatin receptor scintigraphy in patients with occult ectopic adrenocorticotropin syndrome. J Clin Endocrinol Metab. 1999;84(4):1193-202.
  201. Torpy DJ, Chen CC, Mullen N, Doppman JL, Carrasquillo JA, Chrousos GP, et al. Lack of utility of (111)In-pentetreotide scintigraphy in localizing ectopic ACTH producing tumors: follow-up of 18 patients. J Clin Endocrinol Metab. 1999;84(4):1186-92.
  202. Kumar J, Spring M, Carroll PV, Barrington SF, Powrie JK. 18Flurodeoxyglucose positron emission tomography in the localization of ectopic ACTH-secreting neuroendocrine tumours. Clin Endocrinol (Oxf). 2006;64(4):371-4.
  203. Pacak K, Ilias I, Chen CC, Carrasquillo JA, Whatley M, Nieman LK. The role of [(18)F]fluorodeoxyglucose positron emission tomography and [(111)In]-diethylenetriaminepentaacetate-D-Phe-pentetreotide scintigraphy in the localization of ectopic adrenocorticotropin-secreting tumors causing Cushing's syndrome. J Clin Endocrinol Metab. 2004;89(5):2214-21.
  204. Bozkurt MF, Virgolini I, Balogova S, Beheshti M, Rubello D, Decristoforo C, et al. Guideline for PET/CT imaging of neuroendocrine neoplasms with (68)Ga-DOTA-conjugated somatostatin receptor targeting peptides and (18)F-DOPA. Eur J Nucl Med Mol Imaging. 2017;44(9):1588-601.
  205. Santhanam P, Taieb D, Giovanella L, Treglia G. PET imaging in ectopic Cushing syndrome: a systematic review. Endocrine. 2015;50(2):297-305.
  206. Treglia G, Giovanella L, Lococo F. Evolving role of PET/CT with different tracers in the evaluation of pulmonary neuroendocrine tumours. Eur J Nucl Med Mol Imaging. 2014;41(5):853-5.
  207. Isidori AM, Minnetti M, Sbardella E, Graziadio C, Grossman AB. Mechanisms in endocrinology: The spectrum of haemostatic abnormalities in glucocorticoid excess and defect. Eur J Endocrinol. 2015;173(3):R101-13.
  208. Jane JA, Jr., Catalino MP, Laws ER, Jr. Surgical Treatment of Pituitary Adenomas. In: Feingold KR, Anawalt B, Boyce A, Chrousos G, de Herder WW, Dungan K, et al., editors. Endotext. South Dartmouth (MA)2000.
  209. Biller BM, Grossman AB, Stewart PM, Melmed S, Bertagna X, Bertherat J, et al. Treatment of adrenocorticotropin-dependent Cushing's syndrome: a consensus statement. J Clin Endocrinol Metab. 2008;93(7):2454-62.
  210. Lamberts SW, van der Lely AJ, de Herder WW. Transsphenoidal selective adenomectomy is the treatment of choice in patients with Cushing's disease. Considerations concerning preoperative medical treatment and the long-term follow-up. J Clin Endocrinol Metab. 1995;80(11):3111-3.
  211. Netea-Maier RT, van Lindert EJ, den Heijer M, van der Eerden A, Pieters GF, Sweep CG, et al. Transsphenoidal pituitary surgery via the endoscopic technique: results in 35 consecutive patients with Cushing's disease. Eur J Endocrinol. 2006;154(5):675-84.
  212. Wagenmakers MA, Netea-Maier RT, van Lindert EJ, Timmers HJ, Grotenhuis JA, Hermus AR. Repeated transsphenoidal pituitary surgery (TS) via the endoscopic technique: a good therapeutic option for recurrent or persistent Cushing's disease (CD). Clin Endocrinol (Oxf). 2009;70(2):274-80.
  213. Atkinson AB, Kennedy A, Wiggam MI, McCance DR, Sheridan B. Long-term remission rates after pituitary surgery for Cushing's disease: the need for long-term surveillance. Clin Endocrinol (Oxf). 2005;63(5):549-59.
  214. Broersen LHA, Biermasz NR, van Furth WR, de Vries F, Verstegen MJT, Dekkers OM, et al. Endoscopic vs. microscopic transsphenoidal surgery for Cushing's disease: a systematic review and meta-analysis. Pituitary. 2018;21(5):524-34.
  215. Bochicchio D, Losa M, Buchfelder M. Factors influencing the immediate and late outcome of Cushing's disease treated by transsphenoidal surgery: a retrospective study by the European Cushing's Disease Survey Group. J Clin Endocrinol Metab. 1995;80(11):3114-20.
  216. Blevins LS, Jr., Christy JH, Khajavi M, Tindall GT. Outcomes of therapy for Cushing's disease due to adrenocorticotropin-secreting pituitary macroadenomas. J Clin Endocrinol Metab. 1998;83(1):63-7.
  217. Hughes NR, Lissett CA, Shalet SM. Growth hormone status following treatment for Cushing's syndrome. Clin Endocrinol (Oxf). 1999;51(1):61-6.
  218. Kelly DF. Transsphenoidal surgery for Cushing's disease: a review of success rates, remission predictors, management of failed surgery, and Nelson's Syndrome. Neurosurg Focus. 2007;23(3):E5.
  219. Yamada S, Inoshita N, Fukuhara N, Yamaguchi-Okada M, Nishioka H, Takeshita A, et al. Therapeutic outcomes in patients undergoing surgery after diagnosis of Cushing's disease: A single-center study. Endocr J. 2015;62(12):1115-25.
  220. Braun LT, Rubinstein G, Zopp S, Vogel F, Schmid-Tannwald C, Escudero MP, et al. Recurrence after pituitary surgery in adult Cushing's disease: a systematic review on diagnosis and treatment. Endocrine. 2020;70(2):218-31.
  221. Bakiri F, Tatai S, Aouali R, Semrouni M, Derome P, Chitour F, et al. Treatment of Cushing's disease by transsphenoidal, pituitary microsurgery: prognosis factors and long-term follow-up. J Endocrinol Invest. 1996;19(9):572-80.
  222. Prevedello DM, Pouratian N, Sherman J, Jane JA, Jr., Vance ML, Lopes MB, et al. Management of Cushing's disease: outcome in patients with microadenoma detected on pituitary magnetic resonance imaging. J Neurosurg. 2008;109(4):751-9.
  223. Wilson CB, Mindermann T, Tyrrell JB. Extrasellar, intracavernous sinus adrenocorticotropin-releasing adenoma causing Cushing's disease. J Clin Endocrinol Metab. 1995;80(6):1774-7.
  224. Weil RJ, Vortmeyer AO, Nieman LK, Devroom HL, Wanebo J, Oldfield EH. Surgical remission of pituitary adenomas confined to the neurohypophysis in Cushing's disease. J Clin Endocrinol Metab. 2006;91(7):2656-64.
  225. Meij BP, Lopes MB, Ellegala DB, Alden TD, Laws ER, Jr. The long-term significance of microscopic dural invasion in 354 patients with pituitary adenomas treated with transsphenoidal surgery. J Neurosurg. 2002;96(2):195-208.
  226. Sonino N, Zielezny M, Fava GA, Fallo F, Boscaro M. Risk factors and long-term outcome in pituitary-dependent Cushing's disease. J Clin Endocrinol Metab. 1996;81(7):2647-52.
  227. Streeten DH, Anderson GH, Jr., Dalakos T, Joachimpillai AD. Intermittent hypercortisolism: a disorder strikingly prevalent after hypophysial surgical procedures. Endocr Pract. 1997;3(3):123-9.
  228. Kelly PA, Samandouras G, Grossman AB, Afshar F, Besser GM, Jenkins PJ. Neurosurgical treatment of Nelson's syndrome. J Clin Endocrinol Metab. 2002;87(12):5465-9.
  229. McCance DR, Besser M, Atkinson AB. Assessment of cure after transsphenoidal surgery for Cushing's disease. Clin Endocrinol (Oxf). 1996;44(1):1-6.
  230. Estrada J, Garcia-Uria J, Lamas C, Alfaro J, Lucas T, Diez S, et al. The complete normalization of the adrenocortical function as the criterion of cure after transsphenoidal surgery for Cushing's disease. J Clin Endocrinol Metab. 2001;86(12):5695-9.
  231. Newell-Price J. Transsphenoidal surgery for Cushing's disease: defining cure and following outcome. Clin Endocrinol (Oxf). 2002;56(1):19-21.
  232. Yap LB, Turner HE, Adams CB, Wass JA. Undetectable postoperative cortisol does not always predict long-term remission in Cushing's disease: a single centre audit. Clin Endocrinol (Oxf). 2002;56(1):25-31.
  233. Pereira AM, van Aken MO, van Dulken H, Schutte PJ, Biermasz NR, Smit JW, et al. Long-term predictive value of postsurgical cortisol concentrations for cure and risk of recurrence in Cushing's disease. J Clin Endocrinol Metab. 2003;88(12):5858-64.
  234. Esposito F, Dusick JR, Cohan P, Moftakhar P, McArthur D, Wang C, et al. Clinical review: Early morning cortisol levels as a predictor of remission after transsphenoidal surgery for Cushing's disease. J Clin Endocrinol Metab. 2006;91(1):7-13.
  235. Lindsay JR, Oldfield EH, Stratakis CA, Nieman LK. The postoperative basal cortisol and CRH tests for prediction of long-term remission from Cushing's disease after transsphenoidal surgery. J Clin Endocrinol Metab. 2011;96(7):2057-64.
  236. Valassi E, Biller BM, Swearingen B, Pecori Giraldi F, Losa M, Mortini P, et al. Delayed remission after transsphenoidal surgery in patients with Cushing's disease. J Clin Endocrinol Metab. 2010;95(2):601-10.
  237. Ram Z, Nieman LK, Cutler GB, Jr., Chrousos GP, Doppman JL, Oldfield EH. Early repeat surgery for persistent Cushing's disease. J Neurosurg. 1994;80(1):37-45.
  238. Locatelli M, Vance ML, Laws ER. Clinical review: the strategy of immediate reoperation for transsphenoidal surgery for Cushing's disease. J Clin Endocrinol Metab. 2005;90(9):5478-82.
  239. Papanicolaou DA, Tsigos C, Oldfield EH, Chrousos GP. Acute glucocorticoid deficiency is associated with plasma elevations of interleukin-6: does the latter participate in the symptomatology of the steroid withdrawal syndrome and adrenal insufficiency? J Clin Endocrinol Metab. 1996;81(6):2303-6.
  240. Leshin M. Acute adrenal insufficiency: recognition, management, and prevention. Urol Clin North Am. 1982;9(2):229-35.
  241. Bangar V, Clayton RN. How reliable is the short synacthen test for the investigation of the hypothalamic-pituitary-adrenal axis? Eur J Endocrinol. 1998;139(6):580-3.
  242. Stewart PM, Corrie J, Seckl JR, Edwards CR, Padfield PL. A rational approach for assessing the hypothalamo-pituitary-adrenal axis. Lancet. 1988;1(8596):1208-10.
  243. Orme SM, Peacey SR, Barth JH, Belchetz PE. Comparison of tests of stress-released cortisol secretion in pituitary disease. Clin Endocrinol (Oxf). 1996;45(2):135-40.
  244. Ammari F, Issa BG, Millward E, Scanion MF. A comparison between short ACTH and insulin stress tests for assessing hypothalamo-pituitary-adrenal function. Clin Endocrinol (Oxf). 1996;44(4):473-6.
  245. Debono M, Ghobadi C, Rostami-Hodjegan A, Huatan H, Campbell MJ, Newell-Price J, et al. Modified-release hydrocortisone to provide circadian cortisol profiles. J Clin Endocrinol Metab. 2009;94(5):1548-54.
  246. Timmers HJ, van Ginneken EM, Wesseling P, Sweep CG, Hermus AR. A patient with recurrent hypercortisolism after removal of an ACTH-secreting pituitary adenoma due to an adrenal macronodule. J Endocrinol Invest. 2006;29(10):934-9.
  247. Olson BR, Rubino D, Gumowski J, Oldfield EH. Isolated hyponatremia after transsphenoidal pituitary surgery. J Clin Endocrinol Metab. 1995;80(1):85-91.
  248. Nemergut EC, Zuo Z, Jane JA, Jr., Laws ER, Jr. Predictors of diabetes insipidus after transsphenoidal surgery: a review of 881 patients. J Neurosurg. 2005;103(3):448-54.
  249. Burke CW, Adams CB, Esiri MM, Morris C, Bevan JS. Transsphenoidal surgery for Cushing's disease: does what is removed determine the endocrine outcome? Clin Endocrinol (Oxf). 1990;33(4):525-37.
  250. Ritzel K, Beuschlein F, Mickisch A, Osswald A, Schneider HJ, Schopohl J, et al. Clinical review: Outcome of bilateral adrenalectomy in Cushing's syndrome: a systematic review. J Clin Endocrinol Metab. 2013;98(10):3939-48.
  251. Bornstein SR, Allolio B, Arlt W, Barthel A, Don-Wauchope A, Hammer GD, et al. Diagnosis and Treatment of Primary Adrenal Insufficiency: An Endocrine Society Clinical Practice Guideline. J Clin Endocrinol Metab. 2016;101(2):364-89.
  252. Kemink L, Pieters G, Hermus A, Smals A, Kloppenborg P. Patient's age is a simple predictive factor for the development of Nelson's syndrome after total adrenalectomy for Cushing's disease. J Clin Endocrinol Metab. 1994;79(3):887-9.
  253. Fountas A, Karavitaki N. Nelson's Syndrome: An Update. Endocrinol Metab Clin North Am. 2020;49(3):413-32.
  254. Reincke M, Albani, A., Stratakis, C.A .,Buchfelder, M., Heaney, A.P., van Rossum, E., Grossman, A., Findling, J., Brue, T., Murakami, M., Pecori Giraldi, F., Losa, M., Theodoropoulou, M., Pivonello, R., Detomas, M., Daniele, A., Sbiera, S., Honegger, J., Elenkova, A., Zacharieva, S., Lacroix, A., Pérez‐Rivas, L.G., Di Dalmazi, G., Laws, E.R., Newell-Price, J.D., Gomez-Sanchez, C.E., Karavitaki, N., Bancos, I., Rainey, W.E., Chabre, O., Valassi, E., Assie, G., Schopohl, J., Rubinstein, G. and Ritzel, K. Corticotroph tumor progression after bilateral adrenalectomy (Nelson’s syndrome: Systematic review and “Munich Expert Consensus. Eur J Endocrinol. 2020.
  255. Fountas A, Lim ES, Drake WM, Powlson AS, Gurnell M, Martin NM, et al. Outcomes of Patients with Nelson's Syndrome after Primary Treatment: A Multicenter Study from 13 UK Pituitary Centers. J Clin Endocrinol Metab. 2020;105(5).
  256. Assie G, Bahurel H, Coste J, Silvera S, Kujas M, Dugue MA, et al. Corticotroph tumor progression after adrenalectomy in Cushing's Disease: A reappraisal of Nelson's Syndrome. J Clin Endocrinol Metab. 2007;92(1):172-9.
  257. Nagesser SK, van Seters AP, Kievit J, Hermans J, van Dulken H, Krans HM, et al. Treatment of pituitary-dependent Cushing's syndrome: long-term results of unilateral adrenalectomy followed by external pituitary irradiation compared to transsphenoidal pituitary surgery. Clin Endocrinol (Oxf). 2000;52(4):427-35.
  258. Kosmin M, Fersht N. Radiotherapy for Pituitary Tumors. In: Feingold KR, Anawalt B, Boyce A, Chrousos G, de Herder WW, Dungan K, et al., editors. Endotext. South Dartmouth (MA)2000.
  259. Devoe DJ, Miller WL, Conte FA, Kaplan SL, Grumbach MM, Rosenthal SM, et al. Long-term outcome in children and adolescents after transsphenoidal surgery for Cushing's disease. J Clin Endocrinol Metab. 1997;82(10):3196-202.
  260. Jennings AS, Liddle GW, Orth DN. Results of treating childhood Cushing's disease with pituitary irradiation. N Engl J Med. 1977;297(18):957-62.
  261. Nelson DH, Meakin JW, Thorn GW. ACTH-producing pituitary tumors following adrenalectomy for Cushing's syndrome. Ann Intern Med. 1960;52:560-9.
  262. Howlett TA, Plowman PN, Wass JA, Rees LH, Jones AE, Besser GM. Megavoltage pituitary irradiation in the management of Cushing's disease and Nelson's syndrome: long-term follow-up. Clin Endocrinol (Oxf). 1989;31(3):309-23.
  263. Estrada J, Boronat M, Mielgo M, Magallon R, Millan I, Diez S, et al. The long-term outcome of pituitary irradiation after unsuccessful transsphenoidal surgery in Cushing's disease. N Engl J Med. 1997;336(3):172-7.
  264. Minniti G, Osti M, Jaffrain-Rea ML, Esposito V, Cantore G, Maurizi Enrici R. Long-term follow-up results of postoperative radiation therapy for Cushing's disease. J Neurooncol. 2007;84(1):79-84.
  265. Vance ML. Cushing's disease: radiation therapy. Pituitary. 2009;12(1):11-4.
  266. Brada M, Ashley S, Ford D, Traish D, Burchell L, Rajan B. Cerebrovascular mortality in patients with pituitary adenoma. Clin Endocrinol (Oxf). 2002;57(6):713-7.
  267. Erfurth EM, Bulow B, Svahn-Tapper G, Norrving B, Odh K, Mikoczy Z, et al. Risk factors for cerebrovascular deaths in patients operated and irradiated for pituitary tumors. J Clin Endocrinol Metab. 2002;87(11):4892-9.
  268. Plowman PN. Pituitary adenoma radiotherapy-when, who and how? Clin Endocrinol (Oxf). 1999;51(3):265-71.
  269. Mitsumori M, Shrieve DC, Alexander E, 3rd, Kaiser UB, Richardson GE, Black PM, et al. Initial clinical results of LINAC-based stereotactic radiosurgery and stereotactic radiotherapy for pituitary adenomas. Int J Radiat Oncol Biol Phys. 1998;42(3):573-80.
  270. Landolt AM, Haller D, Lomax N, Scheib S, Schubiger O, Siegfried J, et al. Stereotactic radiosurgery for recurrent surgically treated acromegaly: comparison with fractionated radiotherapy. J Neurosurg. 1998;88(6):1002-8.
  271. Thoren M, Hoybye C, Grenback E, Degerblad M, Rahn T, Hulting AL. The role of gamma knife radiosurgery in the management of pituitary adenomas. J Neurooncol. 2001;54(2):197-203.
  272. Sheehan J, Lopes MB, Laws E. Pathological findings following radiosurgery of pituitary adenomas. Prog Neurol Surg. 2007;20:172-9.
  273. Bunevicius A, Laws ER, Vance ML, Iuliano S, Sheehan J. Surgical and radiosurgical treatment strategies for Cushing's disease. J Neurooncol. 2019;145(3):403-13.
  274. Swords FM, Monson JP, Besser GM, Chew SL, Drake WM, Grossman AB, et al. Gamma knife radiosurgery: a safe and effective salvage treatment for pituitary tumours not controlled despite conventional radiotherapy. Eur J Endocrinol. 2009;161(6):819-28.
  275. Petit JH, Biller BM, Yock TI, Swearingen B, Coen JJ, Chapman P, et al. Proton stereotactic radiotherapy for persistent adrenocorticotropin-producing adenomas. J Clin Endocrinol Metab. 2008;93(2):393-9.
  276. Swords FM, Allan CA, Plowman PN, Sibtain A, Evanson J, Chew SL, et al. Stereotactic radiosurgery XVI: a treatment for previously irradiated pituitary adenomas. J Clin Endocrinol Metab. 2003;88(11):5334-40.
  277. Jagannathan J, Sheehan JP, Pouratian N, Laws ER, Steiner L, Vance ML. Gamma Knife surgery for Cushing's disease. J Neurosurg. 2007;106(6):980-7.
  278. He J, Zhou J, Lu Z. Radiotherapy of ectopic ACTH syndrome due to thoracic carcinoids. Chin Med J (Engl). 1995;108(5):338-41.
  279. Andres R, Mayordomo JI, Ramon y Cajal S, Tres A. Paraneoplastic Cushing's syndrome associated to locally advanced thymic carcinoid tumor. Tumori. 2002;88(1):65-7.
  280. Miller CA, Ellison EC. Therapeutic alternatives in metastatic neuroendocrine tumors. Surg Oncol Clin N Am. 1998;7(4):863-79.
  281. Lehnert T. Liver transplantation for metastatic neuroendocrine carcinoma: an analysis of 103 patients. Transplantation. 1998;66(10):1307-12.
  282. Tabarin A, Catargi B, Chanson P, Hieronimus S, Corcuff JB, Laurent F, et al. Pseudo-tumours of the thymus after correction of hypercortisolism in patients with ectopic ACTH syndrome: a report of five cases. Clin Endocrinol (Oxf). 1995;42(2):207-13.
  283. Ur E, Grossman A. Corticotropin-releasing hormone in health and disease: an update. Acta Endocrinol (Copenh). 1992;127(3):193-9.
  284. Ogura M, Kusaka I, Nagasaka S, Yatagai T, Shinozaki S, Itabashi N, et al. Unilateral adrenalectomy improves insulin resistance and diabetes mellitus in a patient with ACTH-independent macronodular adrenal hyperplasia. Endocr J. 2003;50(6):715-21.
  285. Lamas C, Alfaro JJ, Lucas T, Lecumberri B, Barcelo B, Estrada J. Is unilateral adrenalectomy an alternative treatment for ACTH-independent macronodular adrenal hyperplasia?: Long-term follow-up of four cases. Eur J Endocrinol. 2002;146(2):237-40.
  286. Lacroix A, Hamet P, Boutin JM. Leuprolide acetate therapy in luteinizing hormone--dependent Cushing's syndrome. N Engl J Med. 1999;341(21):1577-81.
  287. Lacroix A, Tremblay J, Rousseau G, Bouvier M, Hamet P. Propranolol therapy for ectopic beta-adrenergic receptors in adrenal Cushing's syndrome. N Engl J Med. 1997;337(20):1429-34.
  288. Valimaki M, Pelkonen R, Porkka L, Sivula A, Kahri A. Long-term results of adrenal surgery in patients with Cushing's syndrome due to adrenocortical adenoma. Clin Endocrinol (Oxf). 1984;20(2):229-36.
  289. Sarkar R, Thompson NW, McLeod MK. The role of adrenalectomy in Cushing's syndrome. Surgery. 1990;108(6):1079-84.
  290. McCallum RW, Connell JM. Laparoscopic adrenalectomy. Clin Endocrinol (Oxf). 2001;55(4):435-6.
  291. Elfenbein DM, Scarborough JE, Speicher PJ, Scheri RP. Comparison of laparoscopic versus open adrenalectomy: results from American College of Surgeons-National Surgery Quality Improvement Project. J Surg Res. 2013;184(1):216-20.
  292. Raffaelli M, Brunaud L, De Crea C, Hoche G, Oragano L, Bresler L, et al. Synchronous bilateral adrenalectomy for Cushing's syndrome: laparoscopic versus posterior retroperitoneoscopic versus robotic approach. World J Surg. 2014;38(3):709-15.
  293. Taffurelli G, Ricci C, Casadei R, Selva S, Minni F. Open adrenalectomy in the era of laparoscopic surgery: a review. Updates Surg. 2017;69(2):135-43.
  294. Bellantone R, Ferrante A, Boscherini M, Lombardi CP, Crucitti P, Crucitti F, et al. Role of reoperation in recurrence of adrenal cortical carcinoma: results from 188 cases collected in the Italian National Registry for Adrenal Cortical Carcinoma. Surgery. 1997;122(6):1212-8.
  295. Magee BJ, Gattamaneni HR, Pearson D. Adrenal cortical carcinoma: survival after radiotherapy. Clin Radiol. 1987;38(6):587-8.
  296. de Castro F, Isa W, Aguera L, Rosell Costa D, Abad JI, Robles JE, et al. [Primary adrenal carcinoma]. Actas Urol Esp. 1993;17(1):30-4.
  297. Fassnacht M, Hahner S, Polat B, Koschker AC, Kenn W, Flentje M, et al. Efficacy of adjuvant radiotherapy of the tumor bed on local recurrence of adrenocortical carcinoma. J Clin Endocrinol Metab. 2006;91(11):4501-4.
  298. Broersen LHA, Jha M, Biermasz NR, Pereira AM, Dekkers OM. Effectiveness of medical treatment for Cushing's syndrome: a systematic review and meta-analysis. Pituitary. 2018;21(6):631-41.
  299. Carballeira A, Fishman LM, Jacobi JD. Dual sites of inhibition by metyrapone of human adrenal steroidogenesis: correlation of in vivo and in vitro studies. J Clin Endocrinol Metab. 1976;42(4):687-95.
  300. Trainer PJ, Besser M. Cushing's syndrome. Therapy directed at the adrenal glands. Endocrinol Metab Clin North Am. 1994;23(3):571-84.
  301. Owen LJ, Halsall DJ, Keevil BG. Cortisol measurement in patients receiving metyrapone therapy. Ann Clin Biochem. 2010;47(Pt 6):573-5.
  302. Verhelst JA, Trainer PJ, Howlett TA, Perry L, Rees LH, Grossman AB, et al. Short and long-term responses to metyrapone in the medical management of 91 patients with Cushing's syndrome. Clin Endocrinol (Oxf). 1991;35(2):169-78.
  303. Aron DC, Schnall AM, Sheeler LR. Cushing's syndrome and pregnancy. Am J Obstet Gynecol. 1990;162(1):244-52.
  304. Buescher MA, McClamrock HD, Adashi EY. Cushing syndrome in pregnancy. Obstet Gynecol. 1992;79(1):130-7.
  305. Machado MC, Fragoso M, Bronstein MD. Pregnancy in Patients with Cushing's Syndrome. Endocrinol Metab Clin North Am. 2018;47(2):441-9.
  306. Schteingart DE. Drugs in the medical treatment of Cushing's syndrome. Expert Opin Emerg Drugs. 2009;14(4):661-71.
  307. Feelders RA, Hofland LJ, de Herder WW. Medical treatment of Cushing's syndrome: adrenal-blocking drugs and ketaconazole. Neuroendocrinology. 2010;92 Suppl 1:111-5.
  308. Connell JM, Cordiner J, Davies DL, Fraser R, Frier BM, McPherson SG. Pregnancy complicated by Cushing's syndrome: potential hazard of metyrapone therapy. Case report. Br J Obstet Gynaecol. 1985;92(11):1192-5.
  309. Santen RJ, Van den Bossche H, Symoens J, Brugmans J, DeCoster R. Site of action of low dose ketoconazole on androgen biosynthesis in men. J Clin Endocrinol Metab. 1983;57(4):732-6.
  310. Pont A, Goldman ES, Sugar AM, Siiteri PK, Stevens DA. Ketoconazole-induced increase in estradiol-testosterone ratio. Probable explanation for gynecomastia. Arch Intern Med. 1985;145(8):1429-31.
  311. Engelhardt D, Dorr G, Jaspers C, Knorr D. Ketoconazole blocks cortisol secretion in man by inhibition of adrenal 11 beta-hydroxylase. Klin Wochenschr. 1985;63(13):607-12.
  312. Engelhardt D, Weber MM, Miksch T, Abedinpour F, Jaspers C. The influence of ketoconazole on human adrenal steroidogenesis: incubation studies with tissue slices. Clin Endocrinol (Oxf). 1991;35(2):163-8.
  313. Steen RE, Kapelrud H, Haug E, Frey H. In vivo and in vitro inhibition by ketoconazole of ACTH secretion from a human thymic carcinoid tumour. Acta Endocrinol (Copenh). 1991;125(3):331-4.
  314. Chou SC, Lin JD. Long-term effects of ketoconazole in the treatment of residual or recurrent Cushing's disease. Endocr J. 2000;47(4):401-6.
  315. Ahmed M, Kanaan I, Alarifi A, Ba-Essa E, Saleem M, Tulbah A, et al. ACTH-producing pituitary cancer: experience at the King Faisal Specialist Hospital & Research Centre. Pituitary. 2000;3(2):105-12.
  316. Amado JA, Pesquera C, Gonzalez EM, Otero M, Freijanes J, Alvarez A. Successful treatment with ketoconazole of Cushing's syndrome in pregnancy. Postgrad Med J. 1990;66(773):221-3.
  317. Berwaerts J, Verhelst J, Mahler C, Abs R. Cushing's syndrome in pregnancy treated by ketoconazole: case report and review of the literature. Gynecol Endocrinol. 1999;13(3):175-82.
  318. McCance DR, Hadden DR, Kennedy L, Sheridan B, Atkinson AB. Clinical experience with ketoconazole as a therapy for patients with Cushing's syndrome. Clin Endocrinol (Oxf). 1987;27(5):593-9.
  319. Castinetti F, Guignat L, Giraud P, Muller M, Kamenicky P, Drui D, et al. Ketoconazole in Cushing's disease: is it worth a try? J Clin Endocrinol Metab. 2014;99(5):1623-30.
  320. Lewis JH, Zimmerman HJ, Benson GD, Ishak KG. Hepatic injury associated with ketoconazole therapy. Analysis of 33 cases. Gastroenterology. 1984;86(3):503-13.
  321. McCance DR, Ritchie CM, Sheridan B, Atkinson AB. Acute hypoadrenalism and hepatotoxicity after treatment with ketoconazole. Lancet. 1987;1(8532):573.
  322. Sonino N, Boscaro M, Paoletta A, Mantero F, Ziliotto D. Ketoconazole treatment in Cushing's syndrome: experience in 34 patients. Clin Endocrinol (Oxf). 1991;35(4):347-52.
  323. Tucker WS, Jr., Snell BB, Island DP, Gregg CR. Reversible adrenal insufficiency induced by ketoconazole. JAMA. 1985;253(16):2413-4.
  324. Miettinen TA. Cholesterol metabolism during ketoconazole treatment in man. J Lipid Res. 1988;29(1):43-51.
  325. Schwetz V, Aberer F, Stiegler C, T RP, Obermayer-Pietsch B, Pilz S. Fluconazole and acetazolamide in the treatment of ectopic Cushing's syndrome with severe metabolic alkalosis. Endocrinol Diabetes Metab Case Rep. 2015;2015:150027.
  326. Canteros TM, De Miguel V, Fainstein-Day P. Fluconazole treatment in severe ectopic Cushing syndrome. Endocrinol Diabetes Metab Case Rep. 2019;2019(1).
  327. van der Pas R, Hofland LJ, Hofland J, Taylor AE, Arlt W, Steenbergen J, et al. Fluconazole inhibits human adrenocortical steroidogenesis in vitro. J Endocrinol. 2012;215(3):403-12.
  328. Ledingham IM, Watt I. Influence of sedation on mortality in critically ill multiple trauma patients. Lancet. 1983;1(8336):1270.
  329. Weber MM, Lang J, Abedinpour F, Zeilberger K, Adelmann B, Engelhardt D. Different inhibitory effect of etomidate and ketoconazole on the human adrenal steroid biosynthesis. Clin Investig. 1993;71(11):933-8.
  330. Lamberts SW, Bons EG, Bruining HA, de Jong FH. Differential effects of the imidazole derivatives etomidate, ketoconazole and miconazole and of metyrapone on the secretion of cortisol and its precursors by human adrenocortical cells. J Pharmacol Exp Ther. 1987;240(1):259-64.
  331. De Coster R, Beerens D, Haelterman C, Wouters L. Effects of etomidate on cortisol biosynthesis in isolated guinea-pig adrenal cells: comparison with metyrapone. J Endocrinol Invest. 1985;8(3):199-202.
  332. Allolio B, Schulte HM, Kaulen D, Reincke M, Jaursch-Hancke C, Winkelmann W. Nonhypnotic low-dose etomidate for rapid correction of hypercortisolaemia in Cushing's syndrome. Klin Wochenschr. 1988;66(8):361-4.
  333. Herrmann BL, Mitchell A, Saller B, Stolke D, Forsting M, Frilling A, et al. [Transsphenoidal hypophysectomy of a patient with an ACTH-producing pituitary adenoma and an "empty sella" after pretreatment with etomidate]. Dtsch Med Wochenschr. 2001;126(9):232-4.
  334. Drake WM, Perry LA, Hinds CJ, Lowe DG, Reznek RH, Besser GM. Emergency and prolonged use of intravenous etomidate to control hypercortisolemia in a patient with Cushing's syndrome and peritonitis. J Clin Endocrinol Metab. 1998;83(10):3542-4.
  335. Krakoff J, Koch CA, Calis KA, Alexander RH, Nieman LK. Use of a parenteral propylene glycol-containing etomidate preparation for the long-term management of ectopic Cushing's syndrome. J Clin Endocrinol Metab. 2001;86(9):4104-8.
  336. Greening JE, Brain CE, Perry LA, Mushtaq I, Sales Marques J, Grossman AB, et al. Efficient short-term control of hypercortisolaemia by low-dose etomidate in severe paediatric Cushing's disease. Horm Res. 2005;64(3):140-3.
  337. Schulte HM, Benker G, Reinwein D, Sippell WG, Allolio B. Infusion of low dose etomidate: correction of hypercortisolemia in patients with Cushing's syndrome and dose-response relationship in normal subjects. J Clin Endocrinol Metab. 1990;70(5):1426-30.
  338. Preda VA, Sen J, Karavitaki N, Grossman AB. Etomidate in the management of hypercortisolaemia in Cushing's syndrome: a review. Eur J Endocrinol. 2012;167(2):137-43.
  339. Young RB, Bryson MJ, Sweat ML, Street JC. Complexing of DDT and o,p'DDD with adrenal cytochrome P-450 hydroxylating systems. J Steroid Biochem. 1973;4(6):585-91.
  340. Cueto C, Brown JH, Richardson AP, Jr. Biological studies on an adrenocorticolytic agent and the isolation of the active components. Endocrinology. 1958;62(3):334-9.
  341. Icard P, Goudet P, Charpenay C, Andreassian B, Carnaille B, Chapuis Y, et al. Adrenocortical carcinomas: surgical trends and results of a 253-patient series from the French Association of Endocrine Surgeons study group. World J Surg. 2001;25(7):891-7.
  342. Terzolo M, Angeli A, Fassnacht M, Daffara F, Tauchmanova L, Conton PA, et al. Adjuvant mitotane treatment for adrenocortical carcinoma. N Engl J Med. 2007;356(23):2372-80.
  343. Luton JP, Cerdas S, Billaud L, Thomas G, Guilhaume B, Bertagna X, et al. Clinical features of adrenocortical carcinoma, prognostic factors, and the effect of mitotane therapy. N Engl J Med. 1990;322(17):1195-201.
  344. Schteingart DE, Tsao HS, Taylor CI, McKenzie A, Victoria R, Therrien BA. Sustained remission of Cushing's disease with mitotane and pituitary irradiation. Ann Intern Med. 1980;92(5):613-9.
  345. Leiba S, Weinstein R, Shindel B, Lapidot M, Stern E, Levavi H, et al. The protracted effect of o,p'-DDD in Cushing's disease and its impact on adrenal morphogenesis of young human embryo. Ann Endocrinol (Paris). 1989;50(1):49-53.
  346. Maher VM, Trainer PJ, Scoppola A, Anderson JV, Thompson GR, Besser GM. Possible mechanism and treatment of o,p'DDD-induced hypercholesterolaemia. Q J Med. 1992;84(305):671-9.
  347. Haak HR, Caekebeke-Peerlinck KM, van Seters AP, Briet E. Prolonged bleeding time due to mitotane therapy. Eur J Cancer. 1991;27(5):638-41.
  348. Hogan TF, Citrin DL, Johnson BM, Nakamura S, Davis TE, Borden EC. o,p'-DDD (mitotane) therapy of adrenal cortical carcinoma: observations on drug dosage, toxicity, and steroid replacement. Cancer. 1978;42(5):2177-81.
  349. Vilar O, Tullner WW. Effects of o,p' DDD on histology and 17-hydroxycorticosteroid output of the dog adrenal cortex. Endocrinology. 1959;65(1):80-6.
  350. Lamberts SW, de Herder WW, Krenning EP, Reubi JC. A role of (labeled) somatostatin analogs in the differential diagnosis and treatment of Cushing's syndrome. J Clin Endocrinol Metab. 1994;78(1):17-9.
  351. Batista DL, Zhang X, Gejman R, Ansell PJ, Zhou Y, Johnson SA, et al. The effects of SOM230 on cell proliferation and adrenocorticotropin secretion in human corticotroph pituitary adenomas. J Clin Endocrinol Metab. 2006;91(11):4482-8.
  352. Hofland LJ, van der Hoek J, Feelders R, van Aken MO, van Koetsveld PM, Waaijers M, et al. The multi-ligand somatostatin analogue SOM230 inhibits ACTH secretion by cultured human corticotroph adenomas via somatostatin receptor type 5. Eur J Endocrinol. 2005;152(4):645-54.
  353. Boscaro M, Ludlam WH, Atkinson B, Glusman JE, Petersenn S, Reincke M, et al. Treatment of pituitary-dependent Cushing's disease with the multireceptor ligand somatostatin analog pasireotide (SOM230): a multicenter, phase II trial. J Clin Endocrinol Metab. 2009;94(1):115-22.
  354. Colao A, Petersenn S, Newell-Price J, Findling JW, Gu F, Maldonado M, et al. A 12-month phase 3 study of pasireotide in Cushing's disease. N Engl J Med. 2012;366(10):914-24.
  355. Lacroix A, Gu F, Gallardo W, Pivonello R, Yu Y, Witek P, et al. Efficacy and safety of once-monthly pasireotide in Cushing's disease: a 12 month clinical trial. Lancet Diabetes Endocrinol. 2018;6(1):17-26.
  356. Feelders RA, de Bruin C, Pereira AM, Romijn JA, Netea-Maier RT, Hermus AR, et al. Pasireotide alone or with cabergoline and ketoconazole in Cushing's disease. N Engl J Med. 2010;362(19):1846-8.
  357. Hayashi K, Inoshita N, Kawaguchi K, Ibrahim Ardisasmita A, Suzuki H, Fukuhara N, et al. The USP8 mutational status may predict drug susceptibility in corticotroph adenomas of Cushing's disease. Eur J Endocrinol. 2016;174(2):213-26.
  358. Pivonello R, Ferone D, de Herder WW, de Krijger RR, Waaijers M, Mooij DM, et al. Dopamine receptor expression and function in human normal adrenal gland and adrenal tumors. J Clin Endocrinol Metab. 2004;89(9):4493-502.
  359. Godbout A, Manavela M, Danilowicz K, Beauregard H, Bruno OD, Lacroix A. Cabergoline monotherapy in the long-term treatment of Cushing's disease. Eur J Endocrinol. 2010;163(5):709-16.
  360. Trifiro G, Mokhles MM, Dieleman JP, van Soest EM, Verhamme K, Mazzaglia G, et al. Risk of cardiac valve regurgitation with dopamine agonist use in Parkinson's disease and hyperprolactinaemia: a multi-country, nested case-control study. Drug Saf. 2012;35(2):159-71.
  361. Curto L, Torre ML, Ferrau F, Pitini V, Altavilla G, Granata F, et al. Temozolomide-induced shrinkage of a pituitary carcinoma causing Cushing's disease--report of a case and literature review. ScientificWorldJournal. 2010;10:2132-8.
  362. Bode H, Seiz M, Lammert A, Brockmann MA, Back W, Hammes HP, et al. SOM230 (pasireotide) and temozolomide achieve sustained control of tumour progression and ACTH secretion in pituitary carcinoma with widespread metastases. Exp Clin Endocrinol Diabetes. 2010;118(10):760-3.
  363. McCormack AI, McDonald KL, Gill AJ, Clark SJ, Burt MG, Campbell KA, et al. Low O6-methylguanine-DNA methyltransferase (MGMT) expression and response to temozolomide in aggressive pituitary tumours. Clin Endocrinol (Oxf). 2009;71(2):226-33.
  364. Kovacs K, Scheithauer BW, Lombardero M, McLendon RE, Syro LV, Uribe H, et al. MGMT immunoexpression predicts responsiveness of pituitary tumors to temozolomide therapy. Acta Neuropathol. 2008;115(2):261-2.
  365. Bush ZM, Longtine JA, Cunningham T, Schiff D, Jane JA, Jr., Vance ML, et al. Temozolomide treatment for aggressive pituitary tumors: correlation of clinical outcome with O(6)-methylguanine methyltransferase (MGMT) promoter methylation and expression. J Clin Endocrinol Metab. 2010;95(11):E280-90.
  366. Raverot G, Sturm N, de Fraipont F, Muller M, Salenave S, Caron P, et al. Temozolomide treatment in aggressive pituitary tumors and pituitary carcinomas: a French multicenter experience. J Clin Endocrinol Metab. 2010;95(10):4592-9.
  367. Paez-Pereda M, Kovalovsky D, Hopfner U, Theodoropoulou M, Pagotto U, Uhl E, et al. Retinoic acid prevents experimental Cushing syndrome. J Clin Invest. 2001;108(8):1123-31.
  368. Heaney AP, Fernando M, Yong WH, Melmed S. Functional PPAR-gamma receptor is a novel therapeutic target for ACTH-secreting pituitary adenomas. Nat Med. 2002;8(11):1281-7.
  369. Heaney AP, Fernando M, Melmed S. PPAR-gamma receptor ligands: novel therapy for pituitary adenomas. J Clin Invest. 2003;111(9):1381-8.
  370. Ambrosi B, Dall'Asta C, Cannavo S, Libe R, Vigo T, Epaminonda P, et al. Effects of chronic administration of PPAR-gamma ligand rosiglitazone in Cushing's disease. Eur J Endocrinol. 2004;151(2):173-8.
  371. Cannavo S, Arosio M, Almoto B, Dall'Asta C, Ambrosi B. Effectiveness of long-term rosiglitazone administration in patients with Cushing's disease. Clin Endocrinol (Oxf). 2005;63(1):118-9.
  372. Suri D, Weiss RE. Effect of pioglitazone on adrenocorticotropic hormone and cortisol secretion in Cushing's disease. J Clin Endocrinol Metab. 2005;90(3):1340-6.
  373. Lacroix A, N'Diaye N, Mircescu H, Tremblay J, Hamet P. The diversity of abnormal hormone receptors in adrenal Cushing's syndrome allows novel pharmacological therapies. Braz J Med Biol Res. 2000;33(10):1201-9.
  374. Preumont V, Mermejo LM, Damoiseaux P, Lacroix A, Maiter D. Transient efficacy of octreotide and pasireotide (SOM230) treatment in GIP-dependent Cushing's syndrome. Horm Metab Res. 2011;43(4):287-91.
  375. Calhoun DA, White WB, Krum H, Guo W, Bermann G, Trapani A, et al. Effects of a novel aldosterone synthase inhibitor for treatment of primary hypertension: results of a randomized, double-blind, placebo- and active-controlled phase 2 trial. Circulation. 2011;124(18):1945-55.
  376. Bertagna X, Pivonello R, Fleseriu M, Zhang Y, Robinson P, Taylor A, et al. LCI699, a potent 11beta-hydroxylase inhibitor, normalizes urinary cortisol in patients with Cushing's disease: results from a multicenter, proof-of-concept study. J Clin Endocrinol Metab. 2014;99(4):1375-83.
  377. Fleseriu M, Pivonello R, Young J, Hamrahian AH, Molitch ME, Shimizu C, et al. Osilodrostat, a potent oral 11beta-hydroxylase inhibitor: 22-week, prospective, Phase II study in Cushing's disease. Pituitary. 2016;19(2):138-48.
  378. Fleseriu M, Pivonello R, Elenkova A, Salvatori R, Auchus RJ, Feelders RA, et al. Efficacy and safety of levoketoconazole in the treatment of endogenous Cushing's syndrome (SONICS): a phase 3, multicentre, open-label, single-arm trial. Lancet Diabetes Endocrinol. 2019;7(11):855-65.
  379. Baulieu EE. The steroid hormone antagonist RU486. Mechanism at the cellular level and clinical applications. Endocrinol Metab Clin North Am. 1991;20(4):873-91.
  380. Bertagna X, Basin C, Picard F, Varet B, Bertagna C, Hucher M, et al. Peripheral antiglucocorticoid action of RU 486 in man. Clin Endocrinol (Oxf). 1988;28(5):537-41.
  381. Healy DL, Chrousos GP, Schulte HM, Gold PW, Hodgen GD. Increased adrenocorticotropin, cortisol, and arginine vasopressin secretion in primates after the antiglucocorticoid steroid RU 486: dose response relationships. J Clin Endocrinol Metab. 1985;60(1):1-4.
  382. Bertagna X, Bertagna C, Laudat MH, Husson JM, Girard F, Luton JP. Pituitary-adrenal response to the antiglucocorticoid action of RU 486 in Cushing's syndrome. J Clin Endocrinol Metab. 1986;63(3):639-43.
  383. Fleseriu M, Biller BM, Findling JW, Molitch ME, Schteingart DE, Gross C, et al. Mifepristone, a glucocorticoid receptor antagonist, produces clinical and metabolic benefits in patients with Cushing's syndrome. J Clin Endocrinol Metab. 2012;97(6):2039-49.
  384. Castinetti F, Fassnacht M, Johanssen S, Terzolo M, Bouchard P, Chanson P, et al. Merits and pitfalls of mifepristone in Cushing's syndrome. Eur J Endocrinol. 2009;160(6):1003-10.
  385. Johanssen S, Allolio B. Mifepristone (RU 486) in Cushing's syndrome. Eur J Endocrinol. 2007;157(5):561-9.
  386. Nieman LK, Chrousos GP, Kellner C, Spitz IM, Nisula BC, Cutler GB, et al. Successful treatment of Cushing's syndrome with the glucocorticoid antagonist RU 486. J Clin Endocrinol Metab. 1985;61(3):536-40.
  387. Trainer PJ, Eastment C, Grossman AB, Wheeler MJ, Perry L, Besser GM. The relationship between cortisol production rate and serial serum cortisol estimation in patients on medical therapy for Cushing's syndrome. Clin Endocrinol (Oxf). 1993;39(4):441-3.
  388. van Seters AP, Moolenaar AJ. Mitotane increases the blood levels of hormone-binding proteins. Acta Endocrinol (Copenh). 1991;124(5):526-33.
  389. Alexandraki KI, Kaltsas GA, le Roux CW, Fassnacht M, Ajodha S, Christ-Crain M, et al. Assessment of serum-free cortisol levels in patients with adrenocortical carcinoma treated with mitotane: a pilot study. Clin Endocrinol (Oxf). 2010;72(3):305-11.
  390. Workman RJ, Vaughn WK, Stone WJ. Dexamethasone suppression testing in chronic renal failure: pharmacokinetics of dexamethasone and demonstration of a normal hypothalamic-pituitary-adrenal axis. J Clin Endocrinol Metab. 1986;63(3):741-6.
  391. Nolan GE, Smith JB, Chavre VJ, Jubiz W. Spurious overestimation of plasma cortisol in patients with chronic renal failure. J Clin Endocrinol Metab. 1981;52(6):1242-5.
  392. Luger A, Lang I, Kovarik J, Stummvoll HK, Templ H. Abnormalities in the hypothalamic-pituitary-adrenocortical axis in patients with chronic renal failure. Am J Kidney Dis. 1987;9(1):51-4.
  393. Chan KC, Lit LC, Law EL, Tai MH, Yung CU, Chan MH, et al. Diminished urinary free cortisol excretion in patients with moderate and severe renal impairment. Clin Chem. 2004;50(4):757-9.
  394. Siamopoulos KC, Dardamanis M, Kyriaki D, Pappas M, Sferopoulos G, Alevisou V. Pituitary adrenal responsiveness to corticotropin-releasing hormone in chronic uremic patients. Perit Dial Int. 1990;10(2):153-6.
  395. Ramirez G, Gomez-Sanchez C, Meikle WA, Jubiz W. Evaluation of the hypothalamic hypophyseal adrenal axis in patients receiving long-term hemodialysis. Arch Intern Med. 1982;142(8):1448-52.
  396. Calao AM. Pituitary adenomas in childhood. In: Feingold KR, Anawalt B, Boyce A, Chrousos G, de Herder WW, Dungan K, et al., editors. Endotext. South Dartmouth (MA)2000.
  397. Weber A, Trainer PJ, Grossman AB, Afshar F, Medbak S, Perry LA, et al. Investigation, management and therapeutic outcome in 12 cases of childhood and adolescent Cushing's syndrome. Clin Endocrinol (Oxf). 1995;43(1):19-28.
  398. Lee PD, Winter RJ, Green OC. Virilizing adrenocortical tumors in childhood: eight cases and a review of the literature. Pediatrics. 1985;76(3):437-44.
  399. Savage MO, Lienhardt A, Lebrethon MC, Johnston LB, Huebner A, Grossman AB, et al. Cushing's disease in childhood: presentation, investigation, treatment and long-term outcome. Horm Res. 2001;55 Suppl 1:24-30.
  400. Urbanic RC, George JM. Cushing's disease--18 years' experience. Medicine (Baltimore). 1981;60(1):14-24.
  401. Streeten DH, Faas FH, Elders MJ, Dalakos TG, Voorhess M. Hypercortisolism in childhood: shortcomings of conventional diagnostic criteria. Pediatrics. 1975;56(5):797-803.
  402. Martinelli CE, Jr., Sader SL, Oliveira EB, Daneluzzi JC, Moreira AC. Salivary cortisol for screening of Cushing's syndrome in children. Clin Endocrinol (Oxf). 1999;51(1):67-71.
  403. Gafni RI, Papanicolaou DA, Nieman LK. Nighttime salivary cortisol measurement as a simple, noninvasive, outpatient screening test for Cushing's syndrome in children and adolescents. J Pediatr. 2000;137(1):30-5.
  404. Batista DL, Riar J, Keil M, Stratakis CA. Diagnostic tests for children who are referred for the investigation of Cushing syndrome. Pediatrics. 2007;120(3):e575-86.
  405. Carpenter PC. Diagnostic evaluation of Cushing's syndrome. Endocrinol Metab Clin North Am. 1988;17(3):445-72.
  406. Magiakou MA, Mastorakos G, Oldfield EH, Gomez MT, Doppman JL, Cutler GB, Jr., et al. Cushing's syndrome in children and adolescents. Presentation, diagnosis, and therapy. N Engl J Med. 1994;331(10):629-36.
  407. Dias R, Storr HL, Perry LA, Isidori AM, Grossman AB, Savage MO. The discriminatory value of the low-dose dexamethasone suppression test in the investigation of paediatric Cushing's syndrome. Horm Res. 2006;65(3):159-62.
  408. Hanson JA, Weber A, Reznek RH, Cotterill AM, Ross RJ, Harris RJ, et al. Magnetic resonance imaging of adrenocortical adenomas in childhood: correlation with computed tomography and ultrasound. Pediatr Radiol. 1996;26(11):794-9.
  409. Storr HL, Afshar F, Matson M, Sabin I, Davies KM, Evanson J, et al. Factors influencing cure by transsphenoidal selective adenomectomy in paediatric Cushing's disease. Eur J Endocrinol. 2005;152(6):825-33.
  410. Storr HL, Plowman PN, Carroll PV, Francois I, Krassas GE, Afshar F, et al. Clinical and endocrine responses to pituitary radiotherapy in pediatric Cushing's disease: an effective second-line treatment. J Clin Endocrinol Metab. 2003;88(1):34-7.
  411. Davies JH, Storr HL, Davies K, Monson JP, Besser GM, Afshar F, et al. Final adult height and body mass index after cure of paediatric Cushing's disease. Clin Endocrinol (Oxf). 2005;62(4):466-72.
  412. Nana M, Williamson C. Pituitary and Adrenal Disorders of Pregnancy. In: Feingold KR, Anawalt B, Boyce A, Chrousos G, de Herder WW, Dungan K, et al., editors. Endotext. South Dartmouth (MA)2000.
  413. Lindsay JR, Jonklaas J, Oldfield EH, Nieman LK. Cushing's syndrome during pregnancy: personal experience and review of the literature. J Clin Endocrinol Metab. 2005;90(5):3077-83.
  414. Carr BR, Parker CR, Jr., Madden JD, MacDonald PC, Porter JC. Maternal plasma adrenocorticotropin and cortisol relationships throughout human pregnancy. Am J Obstet Gynecol. 1981;139(4):416-22.
  415. Ambroziak U, Kondracka A, Bartoszewicz Z, Krasnodebska-Kiljanska M, Bednarczuk T. The morning and late-night salivary cortisol ranges for healthy women may be used in pregnancy. Clin Endocrinol (Oxf). 2015;83(6):774-8.
  416. Lopes LM, Francisco RP, Galletta MA, Bronstein MD. Determination of nighttime salivary cortisol during pregnancy: comparison with values in non-pregnancy and Cushing's disease. Pituitary. 2016;19(1):30-8.
  417. Barasch E, Sztern M, Spinrad S, Chayen R, Servadio C, Kaufman H, et al. Pregnancy and Cushing's syndrome: example of endocrine interaction. Isr J Med Sci. 1988;24(2):101-4.
  418. Ross RJ, Chew SL, Perry L, Erskine K, Medbak S, Afshar F. Diagnosis and selective cure of Cushing's disease during pregnancy by transsphenoidal surgery. Eur J Endocrinol. 1995;132(6):722-6.
  419. Bronstein MD, Machado MC, Fragoso MC. MANAGEMENT OF ENDOCRINE DISEASE: Management of pregnant patients with Cushing's syndrome. Eur J Endocrinol. 2015;173(2):R85-91.
  420. Caimari F, Valassi E, Garbayo P, Steffensen C, Santos A, Corcoy R, et al. Cushing's syndrome and pregnancy outcomes: a systematic review of published cases. Endocrine. 2017;55(2):555-63.
  421. Plotz CM, Knowlton AI, Ragan C. Natural course of Cushing's syndrome as compared with the course of rheumatoid arthritis treated by hormones. Ann Rheum Dis. 1952;11(4):308-9.
  422. Van Zaane B, Nur E, Squizzato A, Dekkers OM, Twickler MT, Fliers E, et al. Hypercoagulable state in Cushing's syndrome: a systematic review. J Clin Endocrinol Metab. 2009;94(8):2743-50.
  423. Clayton RN, Jones PW, Reulen RC, Stewart PM, Hassan-Smith ZK, Ntali G, et al. Mortality in patients with Cushing's disease more than 10 years after remission: a multicentre, multinational, retrospective cohort study. Lancet Diabetes Endocrinol. 2016;4(7):569-76.
  424. Alexandraki KI, Kaltsas GA, Isidori AM, Storr HL, Afshar F, Sabin I, et al. Long-term remission and recurrence rates in Cushing's disease: predictive factors in a single-centre study. Eur J Endocrinol. 2013;168(4):639-48.
  425. Swearingen B, Biller BM, Barker FG, 2nd, Katznelson L, Grinspoon S, Klibanski A, et al. Long-term mortality after transsphenoidal surgery for Cushing disease. Ann Intern Med. 1999;130(10):821-4.
  426. Valassi E, Tabarin A, Brue T, Feelders RA, Reincke M, Netea-Maier R, et al. High mortality within 90 days of diagnosis in patients with Cushing's syndrome: results from the ERCUSYN registry. Eur J Endocrinol. 2019;181(5):461-72.
  427. Savage MO, Storr HL, Chan LF, Grossman AB. Diagnosis and treatment of pediatric Cushing's disease. Pituitary. 2007;10(4):365-71.
  428. Lindsay JR, Nansel T, Baid S, Gumowski J, Nieman LK. Long-term impaired quality of life in Cushing's syndrome despite initial improvement after surgical remission. J Clin Endocrinol Metab. 2006;91(2):447-53.
  429. Santos A, Resmini E, Martinez Momblan MA, Valassi E, Martel L, Webb SM. Quality of Life in Patients With Cushing's Disease. Front Endocrinol (Lausanne). 2019;10:862.
  430. Dorn LD, Burgess ES, Friedman TC, Dubbert B, Gold PW, Chrousos GP. The longitudinal course of psychopathology in Cushing's syndrome after correction of hypercortisolism. J Clin Endocrinol Metab. 1997;82(3):912-9.
  431. Forget H, Lacroix A, Cohen H. Persistent cognitive impairment following surgical treatment of Cushing's syndrome. Psychoneuroendocrinology. 2002;27(3):367-83.
  432. Manning PJ, Evans MC, Reid IR. Normal bone mineral density following cure of Cushing's syndrome. Clin Endocrinol (Oxf). 1992;36(3):229-34.
  433. Di Somma C, Pivonello R, Loche S, Faggiano A, Klain M, Salvatore M, et al. Effect of 2 years of cortisol normalization on the impaired bone mass and turnover in adolescent and adult patients with Cushing's disease: a prospective study. Clin Endocrinol (Oxf). 2003;58(3):302-8.
  434. Di Somma C, Colao A, Pivonello R, Klain M, Faggiano A, Tripodi FS, et al. Effectiveness of chronic treatment with alendronate in the osteoporosis of Cushing's disease. Clin Endocrinol (Oxf). 1998;48(5):655-62.
  435. Hermus AR, Smals AG, Swinkels LM, Huysmans DA, Pieters GF, Sweep CF, et al. Bone mineral density and bone turnover before and after surgical cure of Cushing's syndrome. J Clin Endocrinol Metab. 1995;80(10):2859-65.
  436. Dimopoulos MA, Fernandez JF, Samaan NA, Holoye PY, Vassilopoulou-Sellin R. Paraneoplastic Cushing's syndrome as an adverse prognostic factor in patients who die early with small cell lung cancer. Cancer. 1992;69(1):66-71.

Clinical Strategies in the Testing of Thyroid Function

ABSTRACT


In the past decades, emphasis has shifted from testing thyroid function in individuals who are likely to have clinically overt thyroid disorders to a broader population, an approach that includes also identification of so-called subclinical or mild thyroid dysfunctions. The key measurement methods used to detect thyroid dysfunction are still serum thyroid stimulating hormone (TSH) and the main circulating thyroid hormones thyroxine (T4) and triiodothyronine (T3), either as total or estimated free concentrations, and it is indeed the improved assay sensitivities and specificities that have made it possible to diagnose these milder forms. For these key variables, it is preferable for results to be interpretable in relation to population-based reference intervals to use methods that are independent of the particular laboratory assay used. This requirement is satisfied for well standardized assays for serum TSH, total T4 and total T3. However, when free T4 is estimated, assay results often need to be evaluated in relation to method-specific reference intervals or “normal ranges”. Free T3 estimates are even more subject to spurious results and high inter-method variability. This limitation of both assessments is particularly cogent during pregnancy and in the face of critical illness. The widespread search for even minor thyroid dysfunction is influenced by two key questions. How damaging are the effects of subclinical dysfunction? Does treatment confer benefit? The answers are not uniform across populations. The diagnostic imperative is now radically different for the population at large and for women who are pregnant or about to become pregnant.


INTRODUCTION


In the past decades, emphasis has shifted from testing of thyroid function in individuals who are likely to have clinically overt thyroid disorders to a broader population, an approach that identifies so-called subclinical thyroid dysfunction in up to 10% of women over fifty. The key assays that are used to detect thyroid dysfunction are serum thyroid stimulating hormone (TSH) and the main circulating thyroid hormones thyroxine (T4) and triiodothyronine (T3), either as total or estimated free concentrations. For these key variables, it is preferable for results to be interpretable in relation to population-based reference intervals that use methods that are independent of the particular assay used. This requirement is satisfied for well standardized assays for serum TSH, total T4 and total T3. However, when free T4 is estimated, assay results often need to be evaluated in relation to method-specific reference intervals or “normal ranges”. Free T3 estimates are even more subject to spurious results and high inter-method variability. This limitation of both assessments is particularly cogent during pregnancy and in the face of critical illness (see below).


The widespread search for even minor thyroid dysfunction is influenced by two key questions. How damaging are the effects of subclinical dysfunction? Does treatment confer benefit? The answers are not uniform across populations. The diagnostic imperative is now radically different for the population at large and for women who are pregnant or about to become pregnant. Some key practice points that relate to the testing of thyroid function are summarized in Table 1.


Table 1. Key Practice Points Related to the Testing of Thyroid Function

Many disorders are associated with increased prevalence of thyroid dysfunction; optimal testing strategy requires information on all co-existing conditions and medications.

The more widely thyroid function is tested, the greater the proportion of abnormal results that show borderline or “subclinical dysfunction”.

Testing of thyroid function is now widely advocated before and early in pregnancy, especially where fertility is impaired, assisted reproduction is used, or where pregnancy complications have occurred.

Except for “subclinical” hypothyroidism in early or impending pregnancy, intervention for subclinical thyroid dysfunction should only be considered after a sustained abnormality has been demonstrated over a minimum of three months.

There is increasing documentation of adverse effects from sustained or progressive subclinical hypothyroidism, although evidence of benefit from treatment is less clear.

The combination of raised serum TSH and positive peroxidase antibody is predictive of likely long-term progression towards overt hypothyroidism.

The relationship between serum TSH and circulating thyroid hormones gives a better index of thyroid status than any single variable. Six key assumptions underpin the diagnostic value of this relationship.

“TSH alone” first line approach to thyroid function testing has important drawbacks and limitations.

Serum TSH is a cornerstone of thyroid diagnosis, but it is not possible to define its “normal” range or reference interval for all clinical circumstances. Age, pregnancy and fertility issues, diurnal variation and pulse secretion, and associated antibody status militate against fixed cut-off points.

Both TSH and T4 show spontaneous biological fluctuations that are much greater than analytical imprecision. A serial change can be inferred with confidence with about 50% alteration in serum TSH and 25% change in the free T4 estimate.

During thyroid hormone therapy, either replacement or suppressive, the optimal target TSH range may differ from the reference interval that is used to establish a new diagnosis.

Interpretation of anomalous test results should take into account the effects of all associated medications, as well as nutraceuticals, e.g. biotin.

No estimate of circulating free thyroxine is impeccable. Especially in situations where assessment is difficult, e.g. late pregnancy and severe associated illness, there are strong arguments for re-establishing total T4 measurement as the preferred “gold standard”.

Identification of marked iodine excess, detected by urinary estimation, may identify reversible thyroid abnormalities, e.g. iodine-induced exacerbation of primary hypothyroidism, atypical thyrotoxicosis with blocked isotope uptake, or resistance to standard doses of antithyroid drugs. Some food sources (e.g. soy, sea weed) and alternative health care products can be heavily iodine-contaminated.


WHO SHOULD BE TESTED FOR THYROID DYSFUNCTION?


It has long been recognized that the clinical manifestations of hyperthyroidism (thyrotoxicosis), or hypothyroidism are so diverse that diagnosis based on clinical features lacks sensitivity and specificity. Hence, reliance is placed on measurements of circulating thyroid hormones and thyroid stimulating hormone (TSH) to confirm or rule out thyroid dysfunction.


After the publication of guidelines from the American College of Physicians in 1998 (1,2), testing for detection of thyroid dysfunction became widely applied, especially in women over 50, the group most likely to have either overt or subclinical thyroid dysfunction. Testing of this group is generally advocated at the time of presentation for medical care, i.e. a case finding strategy, rather than screening of a whole population group.


A normal serum TSH value in ambulatory patients without associated disease or pituitary dysfunction has a high negative predictive value in ruling out both primary hypothyroidism and hyperthyroidism (1,2), which has led to a short-cut approach in which free T4 may only be estimated if TSH is above 10 mU/l. However, this ”TSH first” strategy of thyroid function testing has important limitations (see below). If there is no suspicion of pituitary or thyroid disease, a normal TSH concentration does not need to be re-tested for about 5 years (3). To this broad indication has recently been added the still controversial recommendation that universal testing of thyroid function has a place before or as early as possible in pregnancy, although this is very much debated (4-7), and the recent official guidelines from the scientific community are still not in agreement (8,9).


In some groups (Tables 2 and 3), known to be at increased risk of thyroid dysfunction, there is a case for routine testing even in the absence of any suggestive clinical features.


Almost all developed countries now have routine neonatal screening programs for congenital hypothyroidism using heel prick filter paper blood spots (see below). The value of such programs has long been clear (10), but neonatal screening is not yet routine in numerous developing countries where nevertheless the prevalence of neonatal hypothyroidism may be high, and often associated with iodine deficiency (11) (see below). In terms of benefit from allocation of health care resources in developing countries, the establishment of neonatal screening (12) probably takes precedence over routine testing of adults, even in today’s India (13).


Table 2. Groups with an Increased Likelihood of Thyroid Dysfunction

Pregnancy and postpartum (14)

Previous thyroid disease or surgery

Atrial fibrillation (15)

Goiter

Associated autoimmune disease(s) (16-18)

Chromosome 18q deletions (19)

Chronic renal failure (20)

Williams syndrome (21)

Fabry disease (22)

Irradiation of head and neck (23-25)

Radical laryngeal/pharyngeal surgery

Recovery from Cushing’s syndrome (26,27)

Gout (28)

Environmental irradiation (29,30)

Thalassemia major (31)

Primary pulmonary hypertension (32)

Polycystic ovarian syndrome (33)

Morbid obesity (34)

Breast cancer (35,36)

Hepatitis C (pre-treatment) (37)

Down’s syndrome (38)

Turner’s syndrome (39)

Pituitary or cerebral irradiation (25)

Head trauma (40-42)

Very low birth weight premature infants (43,44)


Table 3. Drugs with an Increased Likelihood of Inducing Thyroid Dysfunction (45-47)

Inhibit thyroid hormone production

Antithyroid drugs, Amiodarone, Lithium, Iodide (large doses), Iodine-containing contrast media

Alter extra-thyroidal metabolism of thyroid hormone

Propylthiouracil, Glucocorticoids, Propranolol, Amiodarone, Iodine-Containing Contrast Media, Carbamazepine, Barbiturates, Rifampicin, Phenytoin, Sertraline

Alter T4/T3 binding to plasma proteins

Estrogen, Heroin, Methadone, Clofibrate, 5-Fluorouracil, Perphenazine, Glucocorticoids, Androgens, L-Asparaginase, Nicotinic Acid, Furosemide, Salicylates, Phenytoin, Fenclofenac Heparin

Induction of thyroiditis

Amiodarone, Interleukin-2, Interferon-α, Interferon-β, γ-Interferon, Sunitinib, Monoclonal antibody therapy check point inhibitors (Nivulomab, Pembrolizumab, pilimimab)

Effect on TSH secretion

Lithium, Dopamine Receptor Blockers, Dopa Inhibitors, Cimetidine, Clomiphene, Thyroid Hormone, Dopamine, L-Dopa, Glucocorticoids, Growth Hormone, Somatostatin, Octreotide

Impaired absorption of oral T4

Aluminum hydroxide, Ferrous Sulfate, Cholestyramine, Calcium Carbonate, Calcium Citrate, Calcium Acetate, Iron Sulfate, Colestipol, Sucralfate, Soya preparations, Kayexalate, Ciprofloxacin, Sevelamer, Proton pump inhibitors

Other

Thalidomide, Lenalidomide, Chemotherapy for sarcoma


THE BASIS FOR A CASE-FINDING STRATEGY


Routine laboratory testing of particular population groups becomes well founded if a testing strategy satisfies the following criteria:

  1. An abnormality cannot be identified in a reliable and timely way by standard clinical assessment.
  2. Dysfunction is sufficiently common to justify routine testing, either by case finding or by population screening.
  3. There are adverse consequences of failure to identify an abnormality, including the possibility of progression towards more severe disease.
  4. The laboratory test method is cost-effective and sufficiently sensitive and specific to identify those at risk of adverse consequences.
  5. There are no major adverse consequences of testing
  6. Treatment is safe and effective and prevents some or all of the adverse consequences.
  7. Abnormal findings can be adequately followed-up to ensure an appropriate clinical response. (An early detection program may have little value if this last requirement cannot be met.)


While the first five of the above criteria are reasonably established for thyroid dysfunction, the latter two are less secure.

Sensitivity and Accuracy of Clinical Assessment


Studies of unselected patients evaluated by primary care physicians show that clinical acumen alone lacks both sensitivity and specificity in detecting previously undiagnosed thyroid dysfunction. In up to one-third of patients evaluated for suspected thyroid dysfunction by specialists, laboratory results led to revision of the clinical assessment (48). Systematic comparison of the standard clinical features of hypothyroidism with laboratory tests (49) showed that clinical assessment identified only about 40% with overt hypothyroidism and classical signs were present only in the most severely affected individuals. Both overt hyper- and hypothyroidism can have important consequences before the usual clinical features are obvious, and clinicians may fail to recognize diagnostic features even when they are present.


Boelaert et al. (50) have recently confirmed that the typical multiple classical symptoms of hyperthyroidism become less prevalent with advancing age, with greater importance of weight loss, atrial fibrillation, and shortness of breath as presenting features (51). They proposed a low threshold for assessment of thyroid function in patients older than 60 years who have any of these features.


Clinical evaluation remains of central importance to assess severity of thyroid dysfunction, evaluate discordant results, establish the specific cause of thyroid dysfunction and monitor the response to treatment. There is little doubt that repeated laboratory confirmation of normal thyroid function can be wasteful; strategies have been suggested to improve cost-effectiveness (51-53).


However, functional disorders of the thyroid (hypothyroidism and hyperthyroidism) are common and, in many cases, managed by primary care providers. In addition to diagnosed cases, there are many patients who present to their provider seeking evaluation of their thyroid status as a possible cause of a variety of complaints including obesity, mood changes, hair loss, and fatigue. There is an ever-growing body of literature in the public domain, whether in print or internet-based, suggesting that thyroid conditions are under-diagnosed by physicians and that standard thyroid function tests are unreliable. Primary care providers are often the first to evaluate these patients and order biochemical testing. This has become a more complex process, with many patients requesting and even demanding certain biochemical tests that may not be indicated (54).

Prevalence


In considering the prevalence of thyroid dysfunction, a distinction needs to be made between so-called subclinical and overt abnormalities; paradoxically, this distinction is based on laboratory rather than clinical criteria. There is a trend to replace the term ‘subclinical hypothyroidism’ with the designation ‘mild thyroid failure’ (55,56).


In the progressive development of thyroid dysfunction, abnormal values for serum TSH generally occur before there is a diagnostic abnormality of serum T4, because of the markedly amplified relationship between serum T4 and release of TSH from the anterior pituitary (see below). For a two-fold change in serum T4, up or down from the set-point for that individual, the serum TSH will normally change up to 100-fold in the reverse direction (57,58). Thus, TSH becomes recognizably abnormal long before the serum concentrations of T4 or T3 fall outside the population-based reference interval. This was made possible by introduction of immunochemiluminometric methods for measurement of serum TSH with an increased functional sensitivity (59).


The more widespread the testing of thyroid function in the absence of suggestive clinical features, the greater the proportion of abnormal results in which only TSH is abnormal. In evaluating serum TSH, typically defined with a normal reference interval of about 0.4-4.0 mU/l, it is important to note that normal values approximate to a logarithmic distribution, with mean and median values at 1.0-1.5 mU/l (57,60-62). While values of 2-4 mU/l lie within the reference range, the likelihood of eventual hypothyroidism increases progressively for values above 2 mU/l, especially if thyroid peroxidase antibodies are present (63).


A population study in Colorado (64), of over 25,000 individuals of mean age 56 years, 56% of whom were female, showed TSH excess in 9.5 %, with a 2.2 % prevalence of suppressed TSH; over half the group with suppressed TSH were taking thyroid medication. In women, the prevalence of TSH excess increased progressively from 4% at age 18-24 to 20% over age 74 (64).


The National Health and Nutrition Examination Survey (NHANES III) (63), found hypothyroidism in 4.6% of the US population (0.3% overt and 4.3% subclinical) and hyperthyroidism in 1.3% (0.5% overt), with increasing prevalence with age in both females and males (figure 1). Abnormalities were more common in females than males. The prevalence of positive thyroid peroxidase antibodies was clearly associated with both hyper- and hypothyroidism, with important ethnic differences in antibody prevalence.

Figure 1. Percentage of the US population (NHANESIII) with abnormal serum TSH concentrations as a function of age. The disease-free population excludes those who reported thyroid disease, goiter or thyroid-related medications; the reference population excluded, in addition, those who had positive thyroid autoantibodies, or were taking medications that can influence thyroid function. Note the much higher prevalence of TSH abnormalities in the total population, than in the reference population (from reference (63)).

Prevalence data from one region do not necessarily apply in other populations, because of differences such as ethnic predisposition or variations in iodine intake. For example, in Hong Kong, where iodine intake is marginally deficient, only 1.2% of Chinese women aged over 60 years had serum TSH values > 5 mU/l, with a comparable prevalence of suppressed values indicating possible hyperthyroidism (65). Several European studies (66,67) have compared the effect of various levels of iodine intake on the prevalence of thyroid over- and underfunction.


Hypothyroidism is generally more common with abundant iodine intake, while goiter and subclinical hyperthyroidism are more common with low iodine intake (66,67). This was illustrated in a random selection of 4649 participants from the Civil Registration System in Denmark in age groups between 18 and 65 years. Thyroid dysfunction was evaluated from blood samples and questionnaires and compared with results from ultrasonography. Median iodine excretion was 53 µg/l in Aalborg and 68 µg/l in Copenhagen. Previously diagnosed thyroid dysfunction was found with the same prevalence in these regions. Serum TSH was lower in Aalborg than in Copenhagen (P=0.003) and declined with age in Aalborg, but not in Copenhagen. No previously diagnosed hyperthyroidism was found with the same overall prevalence in the two regions, but in subjects >40 years hyperthyroidism was more prevalent in Aalborg (1.3 vs 0.5%, P=0.017). No previously diagnosed hypothyroidism was found more frequently in Aalborg (0.6 vs 0.2%, P=0.03). Hyperthyroidism was more often associated with macronodular thyroid structure at ultrasound in Aalborg and hypothyroidism was more often associated with a patchy thyroid structure in Copenhagen. Thus, significant differences in thyroid dysfunction were found between the regions with a minor difference in iodine excretion. The findings are in agreement with a higher prevalence of thyroid autonomy among the elderly in the most iodine-deficient region (68).


Thus, thyroid abnormalities in populations with low iodine intake and those with high iodine intake develop in opposite directions: goiter and thyroid hyperfunction when iodine intake is relatively low, and impaired thyroid function when iodine intake is relatively high. Probably, mild iodine deficiency partly protects against autoimmune thyroid disease. Thyroid autoantibodies may be markers of an autoimmune process in the thyroid or secondary to the development of goiter (69).


These regional differences may and should influence the choice of diagnostic test and target population. For example, in an iodine replete environment, emphasis could be placed on testing younger or pregnant women for subclinical hypothyroidism by measurement of TSH and thyroid peroxidase antibodies, whereas in an iodine-deficient region there might be additional emphasis on early detection of thyroid autonomy and hyperthyroidism in older people, using a highly sensitive 3rd generation TSH assay.


SUBCLINICAL THYROID DYSFUNCTION


The proven or presumed importance of subclinical thyroid dysfunction will have a major effect on the extent to which thyroid function testing is applied in any population. The term ‘subclinical’ is used when the serum concentration of TSH is persistently abnormal (however defined), while the concentrations of T4 and T3 remain within their reference intervals. Because results can fluctuate spontaneously, a new diagnosis of subclinical thyroid dysfunction is not warranted on basis of a single laboratory sample. The following five criteria define endogenous subclinical thyroid dysfunction:

  1. TSH increased above or decreased below designated limits (see below)
  2. Normal free T4 concentration (and free T3 for hyperthyroidism)
  3. Abnormality is not due to medication (see below)
  4. There is no concurrent critical illness or pituitary dysfunction.
  5. A sustained abnormality is demonstrated over 3-6 months.


Apart from the situation of impending or early pregnancy, where there is clear consensus that subclinical hypothyroidism should be promptly and fully treated, the approach to subclinical thyroid dysfunction remains uncertain (70). Various authorities have expressed divergent views on the importance of detecting the mild TSH abnormalities that reflect subclinical thyroid dysfunction. Extremes of opinion can be summarized as follows. On the one hand, some take the position that subclinical thyroid dysfunction, both hypothyroidism and hyperthyroidism, are disorders that need to be treated in order to avert potential harm (71). To achieve optimal sensitivity, particularly for the diagnosis of hypothyroidism, some have advocated that the upper limit of the TSH reference interval should be lowered (72)because values in the range 2-4 mU/l, usually regarded as normal, are associated with an increased prevalence of future hypothyroidism (62). Active search for subclinical thyroid dysfunction is based on the view that treatment is usually justified, because of potential adverse outcomes, even if proof of benefit is still lacking. At this end of the opinion spectrum, there is support for general community screening for thyroid dysfunction (71), in contrast to a case-finding strategy for women over 50 when they present for medical care (1).


Others have taken the view that while there is circumstantial evidence that subclinical thyroid dysfunction can have adverse long-term effects, there is still a lack of strong evidence that treatment of thyroid dysfunction in general confers benefit (73), although more indicative evidence has emerged with time (see later). Thus, treatment of subclinical hyperthyroidism seems to improve bone health (74) and prevent atrial fibrillation (15), while evidence for treatment benefits of subclinical hypothyroidism is much weaker, at least in patients above 65 years of age (see later).


A definitive position on this dilemma should ideally emerge from long-term studies focused on outcomes, but if differences are small, studies may be under-powered and the results may still be indeterminate. Other factors to take into account in establishing an approach to widespread thyroid testing include ethnic or environmental predisposition to thyroid dysfunction in various communities, balance with other healthcare priorities that may be more compelling, cost of laboratory testing and the extent to which competent clinical assessment and therapeutic response may be overwhelmed by reliance on laboratory measurements. Yet, even with the aspect of not advocating for universal screening, some guidelines inadvertently include almost all women for testing of thyroid function, even if not stating it clearly (75). Thus, according to the American Thyroid Association (ATA) and American Association of Clinical Endocrinologists (AACE) guidelines, levothyroxine therapy would be considered for 92% of women with subclinical hypothyroidism and TSH ≤10 mU/L (75).


Adverse Consequences of Subclinical Thyroid Dysfunction


The issues that identify the clinical importance of subclinical thyroid dysfunction are summarized in Table 4; many of these adverse effects relate to the cardiovascular system (73,76). There is still conflicting evidence on whether mild thyroid abnormalities influence cardiovascular mortality and, as yet, no convincing support for the proposition that treatment of subclinical thyroid dysfunction improves survival. In a 12-year follow-up study of women over 65, neither TSH > 5 mU/l, nor <0.5 mU/l were associated with any increase in all-cause or cardiovascular mortality, although a previous history of hyperthyroidism had a minor adverse effect (77). In contrast, another survey of the relationship between serum TSH and all-cause and cardiovascular mortality over a 10-year period in individuals over 60, showed that the group with serum TSH below 0.5 mU/l had a significantly increased mortality, apparently due to cardiovascular disease (78), although an increased serum TSH was not associated with excess mortality (78). More recent studies provide strengthening evidence for adverse effects from minor degrees of thyroid dysfunction. A Scottish study (79) of over 17,000 people followed for an average of 4.5 years, correlated fatal or non-fatal first episodes of cardiovascular disease, arrhythmias, and osteoporotic fractures with ambulatory serum TSH values. With elevated TSH >4 mU/l there was an increased incidence of dysrhythmia, cardiovascular ischemic episodes, and fracture (hazard ratios 1.8-1.95) (77). With a suppressed serum TSH <0.03 mU/l, all three endpoints were also increased in frequency (hazard ratio 1.4-2.0). It is important to note that these authors distinguished between clearly suppressed TSH (<0.03 mU/l) and subnormal-detectable TSH 0.04-0.4 mU/l, the latter of which was not associated with significant adverse effects. These findings appeared to be at odds with the initial evaluation of the Wickham data that showed no adverse cardiovascular effects of subclinical hypothyroidism. However, reanalysis of the Whickham findings (80) did show an adverse effect if the beneficial effect of thyroxine treatment was excluded.


Table 4. Reported Effects of Subclinical Thyroid Dysfunction

Subclinical hyperthyroidism (suppressed TSH, normal free T4, and free T3 estimates)

·     Exposure to iodine may precipitate severe thyrotoxicosis (81)

·     Threefold increased risk of atrial fibrillation after 10 years (82)

·     Abnormalities of cardiac function (15,82,83)

·     Osteoporosis risk increased (84,85)

·     Progression to overt hyperthyroidism (86,87)

Subclinical hypothyroidism or mild thyroid failure (increased TSH, normal free T4 estimate)

·     Non-specific symptoms may improve with treatment (88)

·     Progression to overt hypothyroidism (89)

·     Independent risk factor for atherosclerosis (90)

·     Increased risk of coronary artery disease (91-93)

·     Increased frequency of congestive heart failure (91,93,94)

·     Adverse effects on vascular compliance (95-97)

·     Abnormal cardiac function may improve with treatment (98)

·     Beneficial effect of treatment on lipids (99,100)

·     Increased prevalence of depressive illness (101)

·     Impaired fibrinolysis (102)


Subclinical Hyperthyroidism


NATURAL HISTORY OF SUBCLINICAL HYPERTHYROIDISM


Follow up studies suggest that spontaneous progression to overt hyperthyroidism is uncommon and that subnormal-detectable levels of TSH in the range 0.05-0.4 mU/l frequently return to normal within one year (87). Meyerovitch et al. (103) reported the results of sequential tests of thyroid function over a 5-year period in a large community-based cohort. During the follow-up period, test results returned to normal in 27%, 62% and 51% respectively of untreated patients whose initial serum TSH values were >10 mU/l, 5.5-10 mU/l and < 0.35 mU/l (103). While some subjects did show progression, the high chance of resolution towards normal suggests that retesting after follow-up, possibly after at least 6 months, is advisable before considering any intervention. However, quantitative conclusions from that retrospective study may be insecure, as many subjects with abnormal TSH were excluded from follow-up because they were treated after their initial result (103). If those treated were the more severely affected, whether based on symptoms, presence of goiter, or degree of TSH abnormality, the analysis may over-estimate the likelihood of resolution during follow-up. Spontaneous remission of subclinical hyperthyroidism may occur more frequently in Graves’ disease than in nodular thyroid disorders (104). However, in a recent study from UK (105), a third each of 84 patients with subclinical hyperthyroidism due to Graves’ disease progressed, normalized, or remained in the subclinically hyperthyroid state. Older people and those with positive anti-thyroperoxidase antibodies had a higher risk of progression of the disease. These data need to be verified and confirmed in larger cohorts and over longer periods of follow-up. The chance of spontaneous progression to overt hyperthyroidism appears to be no greater than 10% per year (87,104), or even lower, and also seems dependent on the cause of subclinical hyperthyroidism (Graves’ or multinodular) (106). However, it should be noted that the transition from autoimmune subclinical to overt hyperthyroidism can occur more rapidly than is generally the case in immune hypothyroidism (107).


CARDIOVASCULAR EFFECTS


From the Framingham study it was found that undetected subclinical hyperthyroidism, defined only by suppression of TSH, carried a three-fold increased risk of atrial fibrillation within 10 years (78). As yet, there is no study that shows that treatment given on the basis of low TSH alone, modifies this risk (108), although it is clear that survival is adversely affected by atrial fibrillation (109). In a large cohort study, endogenous subclinical hyperthyroidism is associated with increased risks of total and coronary heart disease mortality, and incident atrial fibrillation, with highest risks of coronary heart disease mortality and atrial fibrillation when the TSH concentration was lower than 0.10 mIU/L (110). A recent meta-analysis of prospective cohorts found an increased risk of coronary heart disease (relative risk (RR) 1.20; 95% confidence interval (CI), 1.02-1.42), total mortality (RR = 1.27; 95% CI, 1.07-1.51), and coronary heart disease mortality (RR = 1.45; 95% CI, 1.12-1.86) from subclinical hyperthyroidism, while this was not the case for subclinical hypothyroidism (111). Another group also analyzed prospective cohorts in a systematic review and meta-analysis (112) and found that higher free T4 levels at baseline in euthyroid individuals were associated with an increased risk of atrial fibrillation in age- and sex-adjusted analyses (hazard ratio, 1.45; 95% confidence interval, 1.26-1.66, for the highest quartile versus the lowest quartile of free T4; P for trend ≤0.001 across quartiles). Estimates did not substantially differ after further adjustment for preexisting cardiovascular disease. Thus, in euthyroid individuals, higher circulating free T4 levels, but not TSH levels, were associated with increased risk of incident atrial fibrillation (112). These results, however, need verification in prospective studies. Finally, impaired left ventricular ejection fraction and reduced exercise capacity have been documented in subclinical hyperthyroidism due to high dosage thyroxine and may be alleviated by beta blockade (113).

 IODINE-INDUCED THYROTOXICOSIS


Undiagnosed subclinical hyperthyroidism due to autonomous nodular thyroid disease, a condition especially prevalent in iodine deficient regions, carries the risk of progression to severe overt thyrotoxicosis after iodine exposure (114). An Australian study from a region that is not known to be iodine deficient, was suggestive of recent iodine exposure, most often from radiologic contrast agents, in up to 25% of elderly thyrotoxic patients (81). Prior knowledge of subnormal serum TSH may identify a high-risk group with thyroid autonomy in whom iodine exposure carries the risk of iatrogenic hyperthyroidism (115,116). Prophylactic drugs could be considered in high-risk populations, such as administration of perchlorate and/or a thionamide class drug to elderly patients with suppressed TSH and/or palpable goiter (115).


OSTEOPOROSIS

Notably, in a controlled trial of suppressive T4 treatment for multinodular goiter, TSH suppression without clear excess of serum T4 or T3 resulted in a mean 3.6% decrease in lumbar spine density within 2 years (74). Normalization of serum TSH resulted in normalization of the bone mineral density in postmenopausal women.

Subclinical Hypothyroidism

NATURAL HISTORY OF SUBCLINICAL HYPOTHYROIDISM


The benchmark study of thyroid epidemiology from Wickham, UK (119), showed that the likelihood of overt hypothyroidism after 20 years was directly related to the initial serum TSH concentration, even when the concentration was in the range between 2 to 4 mU/l, within the upper reference interval. The study by Meyerovitch et al. (103)showed that with the initial serum TSH in the range 5.5-10 mU/l, the chance of normalization after prolonged follow-up was greater than the chance of progression to TSH levels >10 mU/l (see above). The antibody status was unfortunately not assessed in that cohort. Huber et al. (87) followed 82 Swiss women with subclinical hypothyroidism, with normal free T4 and serum TSH >4 mU/l, for a mean of 9.2 years (Figure 2). About half of their cohort had had previous ablative treatment for Graves’ disease. The cumulative incidence of overt hypothyroidism, defined here as low free T4 with TSH >20 mU/l, was directly related to the initial serum TSH, with 55% of women with initial serum TSH >6 mU/l progressing to overt hypothyroidism. Progression was not uniform, and over half of the cohort showed no deterioration of thyroid function, but positive microsomal antibodies (corresponding to the more specific thyroperoxidase antibodies) increased the likelihood of progression. It is now clear that the opposite sequence may also occur, with spontaneous normalization of elevated TSH values (103,120). In a cardiovascular health study (121), subclinical hypothyroidism persisted for 4 years in just over half of older individuals, with high rates of reversion to euthyroidism in individuals with lower TSH concentrations and thyroperoxidase antibody negativity. It was advised that future studies should examine the impact of transitions in thyroid status on clinical outcomes (121). Rosario et al. found that most of 241 women with mild TSH elevations ranging from 4.5 to 10 mIU/l did not progress to overt hypothyroidism and even normalized their serum TSH. However, initial TSH seemed to be a more important predictor of progression than the presence of antibodies or ultrasonographic appearance (122). In a prospective study from China, patients >40 years of age, i.e. a younger mean age than most studies, with higher baseline total cholesterol or positive thyroid peroxidase antibodies, had higher risks of progression to overt hypothyroidism, while those with higher baseline creatinine, higher baseline TSH (≥7 mIU/L, p <0.001), or older age (>60 years vs. ≤50 years, p =0.012), had lower odds of reverting to euthyroidism. They concluded that thyroperoxidase antibodies and total cholesterol seemed to be more important predictors of progression to overt hypothyroidism than the initial TSH concentration, whereas high baseline TSH or creatinine were negatively correlated with reversion to euthyroidism. The prognostic value of total cholesterol and creatinine should therefore be considered in mild subclinical hypothyroidism (123).

Notably, a prospective study showed that the progression of autoimmune subclinical hypothyroidism tends to be slower than for subclinical hyperthyroidism (107). Hence, there is a need for prolonged follow-up and patient education, if the decision to treat is deferred.

Figure 2. Kaplan-Meier estimates of the cumulative incidence of overt hypothyroidism in women with subclinical hypothyroidism (initial serum TSH >4 mU/l) as a function of initial serum TSH, thyroid secretory reserve in response to oral thyrotropin releasing hormone (TRH) and detectable microsomal antibodies. Serum TSH appears to be the strongest of these predictors (from reference (89)).

ATHEROSCLEROSIS AND VASCULAR COMPLIANCE


As mentioned earlier, subclinical hypothyroidism, or mild thyroid failure, was shown to be an independent risk factor for both myocardial infarction and radiologically-visible aortic atherosclerosis in a study of Dutch women over 55 years of age (90). This effect was independent of body mass index, total and HDL cholesterol, blood pressure, and smoking status. The attributable risk for subclinical hypothyroidism was comparable to that for the other major risk factors, hypercholesterolemia, hypertension, smoking, and diabetes mellitus. The association was slightly stronger when subclinical hypothyroidism was associated with positive peroxidase antibodies, but thyroid autoimmunity itself was not an independent risk factor (124). A systematic review and meta-analysis of 27 studies demonstrated a significant association of subclinical hypothyroidism and cardiovascular risk with arterial wall thickening and stiffening as well as endothelial dysfunction. However, sustained subclinical thyroid dysfunction did not affect the baseline or development of carotid plaques in healthy individuals (125).


In cross-sectional studies, carotid artery-intima media thickness was significantly higher in participants with subclinical hypothyroidism compared to euthyroid controls (126). Small interventional studies suggested that restoring euthyroidism in patients with subclinical hypothyroidism is associated with regression of carotid atherosclerosis (126,127). However, these trials had major limitations, with uncontrolled study designs and/or small sample sizes (the largest included only 45 participants with subclinical hypothyroidism (127).


Although well known in overt hypothyroidism (128), the finding of impaired flow-mediated, endothelium-dependent vasodilatation in subjects with borderline hypothyroidism or high-normal serum TSH values (95) was at first unexpected. Baseline artery diameter and forearm flow were comparable, but flow mediated vasodilatation during the period of reactive hyperemia was significantly impaired even in the group with serum TSH of 2-4 mU/l, compared with the group with serum TSH 0.4-2 mU/l (95). The difference could not be attributed to a difference in maximal nitrate-induced vasodilatation, age, sex, hypertension, diabetes, smoking, serum cholesterol, or levels of total T3 and T4 (91). This finding suggested that even a minor deviation from an individual’s pituitary-thyroid set point may be associated with alteration in vasodilatory response. There is no known direct action of TSH that would account for this effect. A Japanese placebo-controlled study of women aged 60-70 with subclinical hypothyroidism with mean pre-treatment serum TSH of 7.3 mU/l showed improvement in pulse wave velocity, an index of vascular stiffness, in response to TSH normalization for 2 months by progressive low dose T4 replacement only up to 37.5 ug/day (96). Thyroxine replacement for 18 months has been reported to improve blood pressure, lipids, and carotid intimal thickness in women with subclinical hypothyroidism (129). In a larger properly powered randomized placebo-controlled trial normalization of TSH with levothyroxine was associated with no difference in carotid intima-media thickness and carotid atherosclerosis in older persons with subclinical hypothyroidism (130); a meta-analysis of 12 studies showed (131) that carotid intima-media thickness was significantly higher among subjects with subclinical hypothyroidism (n=280) as compared to euthyroid controls (n=263) at baseline. This meta-analysis showed that thyroxine therapy in subjects with subclinical hypothyroidism significantly decreased carotid intimal thickness and improves lipid profiles, modifiable cardiovascular risk factors. One of the big differences between these publications was the age difference; the subjects were younger in the meta-analysis (131), while the patients in the other publications were all older and not included in the meta-analysis, which was published earlier. The same was the case in another more recent meta-analysis, including only 3 randomized clinical trials in younger patients with subclinical hypothyroidism (132). They also found a decreasing carotid intimal thickness with levothyroxine therapy. Thyroid hormone replacement in younger subjects with subclinical hypothyroidism may thus play a role in slowing down or preventing the progression of atherosclerosis (131,132), but there is still no such evidence in older individuals.


LIPIDS

Overt hypothyroidism is associated with an increase in the serum cholesterol concentration (133) and correction of overt hypothyroidism resulted in a decrease in total and low density lipoprotein (LDL) cholesterol, apolipoprotein A1, apo B and apo E, and serum triglyceride concentrations may also decrease (134,135). A defect in receptor-mediated LDL catabolism, similar to that seen in familial hypercholesterolemia, has been described in severe overt hypothyroidism (136), but there is no evidence to support such an abnormality in mild thyroid failure. At the other extreme, several large population studies reported a positive correlation between serum lipids and serum TSH across its normal range (137), a correlation also associated with increasing blood pressure (138). The clinical impact of these associations remains unknown.


The Colorado study including over 25,000 subjects showed a continuous graded increase in serum cholesterol over a range of serum TSH values from <0.3 to >60 mU/l (64). However, there is still no consensus that mild thyroid failure has an adverse effect on plasma lipids, or that T4 treatment sufficient to normalize isolated TSH elevations has a beneficial effect. A meta-analysis suggests that T4 treatment of subjects with mild thyroid failure does lower the mean total and LDL cholesterol, and is without effect on high density lipoprotein (HDL) cholesterol or triglyceride levels (99). In a prospective double-blind, placebo-controlled trial of thyroxine in subclinical hypothyroidism in which the response was carefully monitored with TSH, Meier et al. (100) reported that the decrease in LDL cholesterol was more pronounced with higher initial TSH levels >12 mU/l or with elevated baseline LDL concentrations, but also here the clinical impact remains unknown.


It remains uncertain whether the serum concentration of the highly atherogenic Lp(a) particle is increased in overt hypothyroidism and whether T4 treatment sufficient to normalize TSH has a favorable influence. Serum concentrations of Lp(a) have been found to be increased in overt hypothyroidism with normalization after treatment in some studies (139,140) while others fail to confirm this finding (141,142). Finally, in 100 women with subclinical hypothyroidism selected among 87 obese women aged between 50 and 70 years, total cholesterol, LDL-cholesterol and triglycerides concentrations as well as LDL-C/HDL-C ratio and Castelli index were higher in subclinical hypothyroidism than in controls and decreased after levothyroxine substitution. All the calculated atherosclerosisindexes showed significant positive correlations with TSH concentrations in the subclinical hypothyroidism group. Also, in this group the systolic and diastolic blood pressure decreased significantly after treatment. Thus, dyslipidemia in obese subclinical hypothyroidism women is not severe, but if untreated for many years, it is assumed to lead to atherosclerosis. Substitution therapy improved the lipid profile, changing the relations between protective and proatherogenic fractions of serum lipids, and it optimizes blood pressure (143), which by itself does not prove a positive clinical outcome.

CARDIAC FUNCTION  

From echocardiographic studies, there is evidence that mild thyroid failure can significantly increase systemic vascular resistance and impair cardiac systolic and diastolic function (144), as demonstrated by decreased flow velocity across the aortic and mitral valves (98). These changes, which were associated with reduced cardiorespiratory work capacity during maximal exercise, were reversed by T4 treatment sufficient to normalize serum TSH (98). Impairment of both diastolic and systolic function was demonstrable by echocardiography in a subclinically hypothyroid group of patients with TSH in the range 4-12 mU/l (98). Thyroxine treatment sufficient to normalize TSH to a mean of 1.3 mU/l for 6 months was associated with improvement in myocardial contractility (98). Calculation of a global myocardial performance index from the echocardiographic findings also confirmed significantly higher scores in hypothyroid patients in comparison to the control group, showing that regression in global left ventricular functions is an important echocardiographic finding (145).


A very recent small study of 20 young patients with autoimmune subclinical hypothyroidism used cardiac magnetic resonance for a myocardial longitudinal relaxation time (T1) mapping technique and demonstrated significant diffuse myocardial injury (146), which may explain results of the cardiac function studies and also provide a novel method for early detection of cardiac dysfunction in subclinical hypothyroidism.


Future studies are required to determine the effects of the above finding on long-term cardiovascular outcomes and how these reversible abnormalities relate to cardiovascular prognosis.


INSULIN SENSITIVITY AND METABOLIC SYNDROME


Several studies suggested that there may be a link between insulin sensitivity, serum lipids, and thyroid function, whether assessed by serum TSH or circulating thyroid hormone levels. Bakker et al. (147) noted that while serum TSH showed no overall correlation with insulin sensitivity or serum lipids, there was a complex interaction between these variables such that the association between TSH and LDL-C was much stronger in insulin- resistant than in insulin- sensitive subjects. The same group showed that low free T4 levels within the reference range are dually associated with LDL-C and insulin resistance (148). Further results will show whether these findings account for the purported link between subclinical hypothyroidism and the metabolic syndrome (149) and whether this link contributes to increased cardiovascular risk in a subgroup of patients with subclinical hypothyroidism. Notably, there is a positive correlation between serum TSH and BMI in euthyroid obese women (9,150). The results of a population study suggest that thyroid function (also within the reference range) could be one of several factors acting in concert to determine body weight in a population. Even slightly elevated serum TSH levels were associated with an increase in the occurrence of obesity (151). Furthermore, a recent cross-sectional study in a sample of 753 subjects (46% males) aged 35-70 years who had no history of diabetes, renal, hepatic, thyroid, or coronary heart disease, and were participants of the Genetics of Atherosclerotic Disease study indicated that subclinical hypothyroidism was associated with fatty liver together with increased odds of metabolic syndrome, insulin resistance, and coronary artery calcification, independent of potential confounders (152).


Finally, subclinical hypothyroidism has been suspected to be related to polycystic ovary syndrome, since subclinical hypothyroidism is present in 10-25% of women with polycystic ovary syndrome. However, a recent meta-analysis of 12 studies found that subclinical hypothyroidism did not influence the hormonal profile of women with polycystic ovary syndrome. On the other hand, it resulted in mild metabolic abnormalities, which are, however, not clinically important in a short-term setting (153).


The value of routine thyroid testing in the above groups remains uncertain (154). The metabolic syndrome and subclinical hypothyroidism are both highly prevalent in the general population. Cross-sectional epidemiological data suggest that a mutual association exists between the two, although the cause–effect relationship remains poorly elucidated. As subclinical hypothyroidism raises cholesterol, blood pressure, and visceral fat, it is easy to understand why it associates with metabolic syndrome (155). Rather, the reasons whereby patients with metabolic syndrome are at higher risk for subclinical hypothyroidism are less apparent. Some studies have reported that subclinical hypothyroidism is itself characterized by high cardiovascular risk. Therefore, the coexistence of subclinical hypothyroidism and metabolic syndrome may identify subjects at a particularly high risk for future cardiovascular events. Recent data indicated that carotid intima-media thickness, a marker of initial atherosclerosis and a possible predictor of future events, was higher in patients with both subclinical hypothyroidism and metabolic syndrome than in the presence of each condition alone.


To date, it remains unclear whether any biological relationship between subclinical hypothyroidism and the metabolic syndrome truly exists and what the underlying mechanisms might be. Nonetheless, given the high prevalence of both conditions, and the observed associations, it is of interest to investigate whether their mutual presence confers a higher cardiovascular disease risk. If confirmed in larger studies, these results may be clinically relevant, suggesting that subclinical hypothyroidism should be investigated in patients with metabolic syndrome to better individualize therapy and counter cardiovascular risk (156).


OSTEOPOROSIS

From a previously mentioned study (118), subclinical hypothyroidism was associated with RRs of 1.34 (95% CI 1.14-1.58; I 2 =32%) for hip fracture, 1.27 (95% CI 1.02-1.58; I 2 =51.9%) for any location of fracture, and 1.25 (95% CI 1.04-1.50) for forearm fracture. The authors failed to find any associations between the change in bone mineral density and subclinical hypothyroidism but subclinical hypothyroidism was associated with an increased risk of fractures. Although subclinical hyperthyroidism was related to reduced bone mineral density, there is no evidence of a definite association between subclinical hypothyroidism and the risk of low bone mineral density.

NEUROBEHAVIORAL EFFECTS AND QUALITY OF LIFE


It is well known that overt thyroid dysfunction can include psychological or psychiatric symptomatology. A small retrospective study has shown a 2-3 fold increased frequency of previous depression in subjects with mild thyroid failure (101); T4 treatment has been reported to improve neuropsychological responses in this group (157). However, contrary to these findings, more recent controlled studies of unselected patients suggest that subclinical hypothyroidism is not associated with any consistent deficit in quality of life indices or improvement with treatment (158,159). This was very recently confirmed in the TRUST trial using the thyroid patient reported outcome (ThyPRO) questionnaire in older adults with subclinical hypothyroidism; in that study, therapy with levothyroxine did not improve symptoms or tiredness compared with placebo (160).


STUDIES IN CHILDREN


A study by Cerbone et al. (161) has shown that long-term idiopathic subclinical hypothyroidism did not appear to have an adverse effect on linear growth or intellectual development in children aged 4-18 years. More recently, a meta-analysis including nine studies demonstrated that subclinical hypothyroidism in children is a remitting process with a low risk of evolution toward overt hypothyroidism. Most of the subjects reverted to euthyroidism or remained subclinically hypothyroid, with a rate of evolution toward overt hypothyroidism ranging between 0 and 28.8%, with a rate of 50% in only one study. The initial presence of goiter and elevated thyroglobulin antibodies, the presence of celiac disease, and a progressive increase in thyroperoxidase antibodies and TSH value predict progression toward overt hypothyroidism. Replacement therapy is not indicated in children with subclinical hypothyroidism with TSH 5-10  mU/l, absence of goiter, and negative antithyroid antibodies. An increased growth velocity was observed in children treated with levothyroxine in two studies. Levothyroxine reduced thyroid volume in 25-100% of children with subclinical hypothyroidism and autoimmune thyroiditis in two studies. No effects were seen on neuropsychological functions in one study, and posttreatment evolution of subclinical hypothyroidism was reported in one study (162). Hence, it may be justifiable to follow this group without early recourse to lifelong replacement.


On the other hand, the association with Hashimoto’s thyroiditis exerted a negative influence on the evolution over time of mild subclinical hypothyroidism, irrespective of other concomitant risk factors. In children – unlike in adults - with mild and subclinical hypothyroidism related to Hashimoto’s thyroiditis, the risk of a deterioration in thyroid status over time is high (53.1%), while the probability of spontaneous TSH normalization is relatively low (21.9%). In contrast, children with mild and idiopathic subclinical hypothyroidism, had a very low risk of a deterioration in thyroid status over time (11.1%), whereas the probability of spontaneous TSH normalization was high (41.1%) (163).


Safety and Effectiveness of Treatment of Subclinical Thyroid Dysfunction


The benefits of early diagnosis and treatment are self-evident from the obvious decline in hospitalization and mortality rates for severe thyroid dysfunction over the past decades. Before reliable tests of thyroid function became widely used, severe hyperthyroidism approaching thyroid storm and hypothyroidism with impending myxedema coma occurred quite regularly, but these presentations are now very uncommon (164,165). While the arguments for seeking and treating mild thyroid dysfunction are less compelling, there may be potential benefits for large numbers of people.


The points in favor of treating mild thyroid dysfunction relate directly to the adverse consequences listed in Table 4, but for many of these adverse outcomes there is still a lack of long-term studies that show benefit as illustrated in a very recent randomized, double-blind placebo-controlled trial nested within the TRUST trial, which found that normalization of TSH with levothyroxine in people >65 years was associated with no difference in carotid-intima media thickness and carotid atherosclerosis by ultrasound in older persons with subclinical hypothyroidism (130). On the basis of potential benefit from simple straightforward treatment and absence of adverse effects, the argument for active treatment is generally stronger for mild thyroid failure than for subclinical hyperthyroidism. Conservative T4 therapy aimed at normalizing TSH is simple, inexpensive and generally safe (166), although replacement may not be warranted in the older adults with very advanced age (167). Where cardiovascular disease precludes full thyroid hormone replacement, detailed evaluation of the cardiac abnormality is appropriate (168,169). In contrast, treatment of subclinical hyperthyroidism needs to be evaluated in relation to adverse drug effects and the potential for hypothyroidism. It is, however, prudent to take into consideration an effect and consequence of suppressed serum TSH on atrial fibrillation, bone loss, depression, quality of life and mortality when counseling individual patients.


In younger patients there may be a benefit of early treatment of subclinical hypothyroidism (170) although the studies supporting this approach were not placebo-controlled and only used surrogate endpoints in small cohorts.


USE OF LABORATORY ASSAYS FOR CASE FINDING AND SCREENING


If the identification of abnormal thyroid function is to be based on laboratory testing, it is desirable that population reference intervals should not vary between methods. As recently emphasized, serum T3, T4 and serum TSH concentrations are among the many hormone variables where between-assay standardization is crucial to ensure optimal assay specificity (171). At present, that aim is not satisfactory for free T4 estimates, a problem that is particularly troublesome during pregnancy (see below). Analytically, serum TSH, total T4 and total T3 are well standardized, so that considerations of so-called normal ranges relate to the clinically relevant issues. By contrast, the diverse, ingenious manoeuvres involved in the estimation of free T4 and T3 lead to poor standardization between methods, so that method-specific reference intervals need to be used, both for individual clinical diagnosis and population studies. Between-method free T4 variations are especially troublesome in pregnancy and critical illness (see below).

TSH Reference Interval or “Normal Range”

For serum TSH, arguably the most important variable for the diagnosis of primary thyroid dysfunction, no firm consensus range has been agreed, despite reliable standardization between methods. Firstly, a reference interval for the diagnosis of hypothyroidism in adults may be far too broad and lenient to identify women whose fertility or pregnancy outcome might be improved by thyroid supplementation. Second, it has been shown that the reference TSH set-point for each individual can be defined with a narrow band of the broad population range (172,173) (see below). Third, criteria for the new diagnosis of thyroid dysfunction may not be the same as those required for optimal adjustment of therapy. Fourth, for population studies, whether screening or case-finding, a reference interval with higher sensitivity will have lower specificity.


Thus, the controversies as to whether the standard TSH reference interval of about 0.4–4.0 mU/l should be narrowed, with lowering of the upper limit (70), or retained (174-176) do not address the needs of individuals. Population studies to define the upper limit of the “normal range” for serum TSH will be influenced by whether those with positive thyroperoxidase antibodies are excluded (see below) (63,177,178). However, even after exclusion of individuals with clinical, antibodies, or sonographic evidence of any thyroid disorder, Hamilton et al. supported an upper reference limit at about 4 mU/l (176), although quite different criteria may apply around pregnancy (see below). Ethnic differences (179), as well as differences and time of sampling in relation to diurnal variation are also important.


Terminology for abnormal TSH values has also become inconsistent, as for example in the use of the term suppressed to describe lower-than-normal TSH values. In some studies (180,181) any subnormal value is classified as suppressed, while others reserve this term for lower levels (63) that allow a distinction between undetectable (e.g. <0.03 mU/l) and a subnormal-detectable range below about 0.4 mU/l (76). These two categories may have different diagnostic and prognostic significance. Based on follow-up studies of the probability of progression to overt thyroid dysfunction, there is a strong case for regarding TSH values in the subnormal-detectable range, arbitrarily 0.05-0.4 mU/l, as distinct from the even lower levels that are typical of hyperthyroidism. It is a personal view that the term “suppressed” should be avoided in describing subnormal-detectable values, a semantic point that may affect up to 1% of the population. Since the gradation from normality to severe thyroid dysfunction is a continuum, studies of adverse outcomes or benefits from intervention will be critically dependent on uniform terminology.


Choice of Initial Test


The definitive diagnosis of thyroid dysfunction should always be made using the typical relationships between trophic hormone and target gland secretion that define endocrine dysfunction. In contrast, case-finding studies of untreated subjects may begin with measurement of TSH alone (182), with T4 and T3 assays added only if TSH is abnormal, or if an abnormality of TSH secretion is suspected. It is self-evident that serum TSH loses its diagnostic value when pituitary function is abnormal (183-186).


In the absence of associated disease, a normal serum TSH concentration by a so-called third generation assay (a functional lower limit of sensitivity of about 0.03 mU/l) (57,58), has a high negative predictive value in ruling out primary hypothyroidism and hyperthyroidism. Such immunometric assays, which use two antibodies against different epitopes of the TSH molecule, give a wide separation between the lower limit of the normal reference range at about 0.4 mU/l and the typical suppressed TSH values found in hyperthyroidism. While some subjects with subnormal-detectable TSH values do progress to overt hyperthyroidism, values in this range may also revert to normal (see above).


There are some clinical situations in which assessment of thyroid function will give a high prevalence of abnormalities that cannot be interpreted with certainty. Notably, glucocorticoids and dopaminergic agents have a potent effect to suppress TSH secretion (45,187), while TSH is also frequently subnormal in starvation or caloric deprivation (188). Transient increases to above normal can occur in euthyroid subjects during recovery from critical illness (178,189-191). The finding that 33% of serum TSH values fell more than 2 standard deviations (SD) from the geometric mean in acutely hospitalized patients, with 17% of values more than 3 SD from the mean value, indicates that TSH concentrations lack diagnostic specificity in this setting (192). A serum free T4 estimate will generally follow from an abnormal TSH concentration, but during critical illness, free T4 estimates often show non-specific abnormalities (see below) (193). Lack of specificity was the basis for a recommendation against routine assessment of serum TSH and free T4 during acute critical illness in the absence of risk factors, or clinical features suggestive of a thyroid disorder (194).

Testing of thyroid function is appropriate in a wide range of psychiatric disorders, but diagnostic specificity is limited by a high prevalence of transient non-specific abnormalities at the time of acute psychiatric admission (195). Thus, laboratory evaluation should be delayed for 2-3 weeks after acute presentation, unless there are specific risk factors for thyroid dysfunction (196).


Potential Adverse Effects of Testing


In terms of potential for adverse effects, there may be important differences between screening of unselected populations and the case-finding strategy that is now recommended for thyroid dysfunction. There are no reports of a “labelling effect” (i.e. perception of chronic illness in previously asymptomatic subjects), described in hypertension screening programs (197), when testing for thyroid dysfunction is done at the time of presentation for medical care. Nevertheless, further attention needs to be given to the potential for unwarranted treatment based on false positive results, as well as the cost of follow-up investigations for perceived abnormalities that may not warrant treatment at any stage. In particular, there is a need for clinical consensus as to how marginally abnormal results should be classified. Widespread laboratory testing will lead to an increase in the number of false positive results; the potential for a diagnostic method to give misleading variations from normal may not become known for some years until the full diversity of the non-diseased population is documented (198).

Follow-up of Abnormal Results


If serum TSH is used as a single initial test for case-finding, a value outside the reference interval should lead to estimation of serum free T4 on the same sample, if possible, without recall of the patient. This requires an algorithm-based testing protocol, which should also include measurement of serum free T3 if TSH is suppressed, to identify T3 toxicosis. It may also be relevant to measure thyroid peroxidase antibodies if TSH is increased, so as to define an autoimmune mechanism of hypothyroidism, particularly as a raised level of these antibodies is associated with an increased likelihood of progression to overt hypothyroidism (61,178).


For screening or case-finding to be effective, patients with unsuspected overt thyroid dysfunction should be actively traced because they will benefit most from treatment and have the most to lose if the abnormal finding is ignored. For mild thyroid dysfunction, a practitioner who has continuing contact with the patient should evaluate the assay result in clinical context and initiate any necessary follow-up. However, there is currently no consensus as to how an appropriate clinical response to abnormal laboratory findings can be assured.


A transition towards identification of thyroid dysfunction by laboratory measurement, rather than on clinical criteria, modifies, but does not diminish the role of the clinician. The severity of thyroid dysfunction cannot be judged from the extent of the laboratory abnormality (198,199), which indicates neither the duration of exposure, nor individual susceptibility. Whether a decision is made to treat or to observe, patient education is crucial in establishing effective compliance and rational cost-effective long-term follow-up. Computer based programs can identify affected individuals, but do not replace direct involvement of both patient and clinician. There may be potential medicolegal consequences of failure to respond to abnormal results, if widespread laboratory testing is initiated without an established follow-up plan.

INTERPRETATION OF TSH AND T4 ASSAYS

The TSH-T4 Relationship


Definitive assessment of thyroid status requires both a sensitive serum TSH assay and a valid T4 estimate, with interpretation based on the relationship between these two values. It is generally assumed that inverse TSH responses to changes in free T4 are approximately logarithmic (59) (Figure 3). While this concept is useful, recent data suggests that the relationship varies with thyroid status, age, sex, smoking and thyroid autoantibody status (200-203) with progressively greater amplification of the TSH response as thyroid function declines. Diurnal variation in serum TSH, with amplitude about 50% with higher levels between 2100 and 0600, is superimposed on rapid pulse secretion with amplitude about 10%. Basal secretion and pulsatility are both increased in primary hypothyroidism, with retention of diurnal variation (204).

Figure 3. The relationship between serum TSH and free T4 estimate in ambulatory individuals with stable thyroid function and normal hypothalamic-pituitary-thyroid function (adapted from reference (178) with permission).

Figure 4. The relationship between serum TSH and free T4 concentration is shown for normal subjects (N) and in the typical abnormalities of thyroid function: A, primary hypothyroidism; B, central or pituitary-dependent hypothyroidism; C, hyperthyroidism due to autonomy or abnormal stimulation of the gland; D, TSH-dependent hyperthyroidism or thyroid hormone resistance. Note that linear changes in the concentration of T4 correspond approximately to logarithmic changes in serum TSH (178).

The T4-TSH Setpoint


Small changes in serum T4 and T3 concentrations, within the normal range, alter the serum TSH concentration, indicating that the inverse feedback relationship between serum free T4 and TSH applies across their normal ranges, as well as in disease states (205,206). Studies of normal subjects demonstrate significant individual variation, independent of sex and age, in the setpoint of the pituitary-thyroid axis (172,173,207), which suggests that the TSH set-point for a particular serum free T4 or free T3 concentration is an individual characteristic. It follows that the concept of “normality” for an individual may be narrower than for a population at-large. Studies of monozygotic and dizygotic twin pairs also suggest that genetic factors influence the serum concentrations of total and free T4 within the normal range (208), as well as the relationship between TSH and free T3 and T4 (209,210). The recent demonstration (211) that multiple genetic factors can influence inter-individual differences in the TSH response to circulating thyroid hormones may ultimately increase the precision and the complexity of interpreting thyroid function are also reviewed recently (212,213).


Andersen et al. (173), in a study of normal subjects whose samples were taken monthly between 09:00 and 12:00 for a year, showed that individual references ranges for T4 and T3 were only about half the width of the population reference ranges, indicating that a test result within the population range is not necessarily normal for that individual. Serum TSH showed greater between-sample variation for each individual than serum T4 or T3. Based on the degree of individual variation, it was estimated that a normal serum TSH concentration needed to change by 0.2-1.6 mU/l to be confident of a serial change in thyroid status. Based on this analysis, it was estimated that a single morning sample defined serum T4 and T3 to within 25%, and serum TSH only to within 50%. Since TSH shows diurnal variation and pulsatile secretion in both normal and hypothyroid subjects (204,214), random samples are likely to show even greater variation. This concept can also be described as individuality index (166).


It has been suggested that some healthy older adults have normal serum TSH concentrations despite having low serum free T4 values, attributed to resetting of the threshold for TSH inhibition (215). In a large cohort of Danish patients with newly diagnosed hypothyroidism, the increase in serum TSH for a given degree of lowering of serum free T4 was less in the elderly, suggesting that equivalent TSH increases in the elderly may be accompanied by more severe thyroid hormone deficiency (216). It is notable that a higher level of serum free T4 was necessary to normalize serum TSH in children with congenital hypothyroidism than in adults with acquired autoimmune hypothyroidism (217). It is uncertain whether this is a further reflection of age-related difference, or whether this difference reflects a perinatal shift in the central setpoint for regulation of TSH secretion.


The TSH-T4 Relationship: Diagnostic Assumptions


The precise diagnosis of thyroid dysfunction can generally be established from a single serum sample from the relationship shown in Figure 4, subject to six key assumptions (Table 5). It should be noted that only the last three of these assumptions can be validated in the laboratory; the first three are best verified clinically.


Table 5. Assumptions Inherent to Diagnostic Use of the T4 -TSH Relationship

(Conditions that may breach these assumptions are shown in italics)

1. Steady-state conditions (note differences in the half-lives of TSH and T4)

·       Early treatment with antithyroid drugs (218)

·       Early response to T4 therapy

·       Evolution of transient thyroid dysfunction (178)

·       Recovery from severe illness (190,191)

2. Normal trophic-target hormone relationship

·       Alternative thyroid stimulators

·       Immunoglobulins (219)

·       Chorionic gonadotrophin (220)

·       Medications that influence TSH secretion (45)

·       T3, triiodothyroacetic acid (221)

·       Other thyroid hormone analogues (222)

·       Glucocorticoids (223)

·       Dopamine (224)

·       Amiodarone (45)

·       Recent hyperthyroidism (218)

·       Recent longstanding hypothyroidism

·       Treated congenital hypothyroidism (225)

·       TSH receptor mutations (226)

·       Variable individual setpoint (173,207,208,213,215,216)

3. Tissue responses proportional to hormone concentration

·       Hormone resistance syndromes (227)(see below)

·       Slow onset/offset of thyroid hormone action

·       Drug effects (45)

·       Amiodarone (45)

·       Phenytoin (228)

4. The assay measurement represents the active hormone

·       Unmeasured agonist in excess (e.g. T3, triiodothyroacetic acid, human choriogonadotropin hormone (178)

·       TSH of altered biologic activity (229,230)

·       Spurious immunoassay results (178)

·       TSH (178)

·       Heterophilic antibodies (231,232)

·       Free T4

·       Abnormal serum binding proteins (233)

·       Autoantibodies (234)

·       Medications that inhibit protein binding (233,235)(227, 229)

·       Heparin artefact (236,237)

5. The assay can reliably distinguish low from normal values

·       Lack of precision at the limit of detection (178,238)

6. Reference ranges are appropriate

·       Influence of age (239,240)(see also above)

·       Associated illness (178)( see below)


STEADY-STATE CONDITIONS


This first assumption should be questioned whenever anomalous results occur during associated illness, or with medications that perturb the pituitary-thyroid axis. The half-lives of plasma TSH (approximately 1 hour) and plasma T4 (approximately 1 week) differ so widely that acute perturbation of the pituitary-thyroid axis will often result in transient nonsteady state conditions (Figure 5). Due to its much shorter half-life, serum TSH deviates more rapidly from steady state. Other common deviations from steady state relate to short-term pulsatile or diurnal fluctuations in hormone secretion, responses to treatment and spontaneous evolution of disease, as can occur in subacute thyroiditis or postpartum thyroid dysfunction.


Figure 5. Measurement of serum T4, rather than serum TSH, is the more reliable single test of thyroid function when steady state conditions do not apply, as in the early phase of treatment for hyperthyroidism or hypothyroidism. (adapted from reference (178)

NORMAL TROPIC-TARGET HORMONE RELATIONSHIP


During treatment of prolonged hyperthyroidism, TSH secretion may remain low for several months after serum free T4 becomes normal (218). Conversely, after severe prolonged hypothyroidism, or in some children treated for congenital hypothyroidism (217), TSH hypersecretion may persist despite normalization of serum T4. Serum TSH will then give an inaccurate indication of thyroid status, with the potential for over-treatment if this variable alone is used to assess therapy.


TISSUE RESPONSES PROPORTIONAL TO THE HORMONE CONCNETRATION


The active or free concentrations of T3 and T4 generally correlate well with clinical features. However, in generalized thyroid hormone resistance due to mutations in the thyroid hormone receptor, serum free T3 and T4 concentrations are elevated and the TSH is inappropriately normal or elevated due to the impaired feedback at the level of the pituitary thyrotrophs.


The onset and offset of genomic thyroid hormone action are relatively slow, so that tissue responses may lag behind changes in serum concentrations of free T4 and T3. There is a notable lack of convenient, sensitive, specific, objective indices of thyroid hormone action (see later), so that assessment remains predominantly clinical. Corroborative measurements that can be useful, especially in following the response of individuals to therapy, include measurement of oxygen consumption (241), sex hormone binding globulin (242), and angiotensin converting enzyme (243), as well as several indices of cardiac contractility, although none of them is a very accurate nor specific biomarker for changes in thyroid function.


THE ASSAY MEASUREMENT REFLECTS THE ACTIVE HORMONE(S)


TSH and iodothyronine assays make comparative, rather than absolute, measurements of hormone concentrations, based on the premise that samples and assay standards differ only in their concentration of the analyte. This assumption fails if there is any other difference between a serum sample and assay standards that influence the measured variable, as, for example, dissimilar protein binding of tracer (244), the presence of binding competitors (235,245), or possible nonspecific interference with enzymatic, fluorescent, or chemiluminescent detection systems. Circulating T3 and T4 autoantibodies may invalidate immunoassays by sequestering the assay tracer (246), while heterophile mouse or sheep (231,232) antibodies and rheumatoid factor can interfere with immunoglobulin aggregation, or with cross linking of the signal and capture antibodies (247,248).


If the biologic activity of circulating immunoreactive TSH is increased or decreased, the normal relationship between measured serum TSH and free T4 may be altered. Secreted immunoreactive TSH is heterogeneous, due to differences in its three oligosaccharide side chains. In hypothalamic hypothyroidism, the secreted TSH has decreased bioactivity (229,230), whereas activity may be enhanced in thyroid hormone resistance, primary hypothyroidism, and in some TSH-producing tumors (249,250).


THE ASSAY CAN RELIABLY DISTINGUISH LOW FROM NORMAL LEVELS 


Assay precision inevitably deteriorates as the limit of detection is approached; this characteristic is crucial in evaluating TSH assays that are used to distinguish hyperthyroidism from normal (57,178). The lower working limit of a TSH assay should be defined in terms of its between-assay reproducibility, defined as functional sensitivity, rather than by the analytical sensitivity of individual assay runs (57,178).


REFERENCE RANGES ARE APPROPRIATE 

Since reference ranges of the thyroid related hormone measurements vary substantially according to the methods of measurement, it does not make much sense to provide typical ranges. However, reference ranges show little change with advancing age, except for a possible decline in normal serum T3 with age (215,240). Serum T3 is significantly higher in children (239) and probably also in young adults. For statistical analyses, TSH reference ranges are generally evaluated after logarithmic transformation; the geometric mean is then used to define a realistic lower normal limit. There may be an age-related change in the central setpoint for TSH secretion, with a progressive decline in the TSH setpoint or response to decreased levels in serum T4 (215,216). Associated illness, nutritional changes, and medications frequently cause assay results to fall outside the normal reference ranges as defined in healthy subjects, so that it may be relevant to use wider than normal reference ranges in the face of associated illness (178). Thus, reference ranges are only appropriate and useful in the context of employing the same biochemical laboratory method in establishing the reference range as the one used for routine measurement in patients. Since automated laboratory methods have been extensively implemented globally, where most clinicians rely entirely on the manufacturers’ information on the method quality (sensitivity, accuracy and imprecision), as well as the reference interval, above requirement for one’s own local laboratory to perform these assessments in order to improve local laboratory quality of results has currently left much to desire.

APPLICATION AND INTERPRETATION OF INDIVIDUAL SERUM ASSAYS

Serum TSH as the Initial Test of Thyroid Function


Either serum TSH or free T4 can be used as the initial test of thyroid function, with TSH previously assessed as giving better first-line discrimination at slightly higher cost (182). A normal serum TSH concentration has high negative predictive value in ruling out primary thyroid disease, and this assay has become increasingly used as the single initial test of thyroid function, with no further assays done routinely if serum TSH is normal. If serum TSH is increased, free T4 is measured on the same sample to distinguish between overt and subclinical hypothyroidism (Figure 6). If serum TSH is suppressed, i.e.<0.05 mU/l, both free T4 and free T3 should be assessed to distinguish between overt hyperthyroidism, T3-thyrotoxicosis and subclinical hyperthyroidism. The interpretation of subnormal TSH values is influenced by the functional sensitivity of the particular assay (see below).


The demonstrated slightly higher costs are probably eliminated by the much better interlaboratory robustness of the TSH assays compared to free T4 estimates, although this has never been properly verified.

Figure 6. An algorithm for the initial assessment of thyroid function, based on initial assay of serum TSH. The limitations of this strategy are summarized in table 5. TPOAb=thyroperoxidase antibodies; TRAb=Thyrotropin receptor antibodies; FT4 and 3=Free thyroxine and -triiodothyronine.

LIMITATIONS OF THE “TSH FIRST” TESTING STRATEGY


The rationale for using TSH alone as a first-line test of thyroid function rests on the assumptions that thyroprivic, or primary hypothyroidism is far more common than central or secondary hypothyroidism, and on the fact that serum TSH deviates outside the reference range early in the natural history of thyroid over-function or progressive thyroid failure. The major weaknesses of this approach are the likelihood of missing secondary hypothyroidism (in which the concentration of immunoreactive serum TSH is frequently normal rather than low), and the frequency of abnormal TSH concentrations in the absence of thyroid dysfunction, especially in patients with an associated illness or interference in the TSH assays (Table 6).


Beckett and Toft (184) have pointed out the adverse consequences of missing secondary hypothyroidism due to pituitary failure by relying on normal serum TSH to rule out thyroid dysfunction. The diagnosis of this disorder is often difficult, with diverse presentations to a wide range of practitioners who may not be attuned to key clinical features. They estimated that as many as 1500 cases per year of central hypothyroidism could be missed in the UK if the “TSH first” policy were followed inflexibly. This potentially serious diagnostic problem was shown by Wardle et al. (183) who reported an analysis of 56,000 requests for thyroid function testing over 12 months from a population of 471,000. Serum TSH was normal in association with subnormal total and free T4 in 15 patients who, on further investigation, had probable hypopituitarism that would have been missed by assessment of serum TSH alone. Cost benefit analyses would therefore need to balance the savings from not measuring serum T4 routinely, against the cost of further investigation and medical care for the missed diagnoses, in addition to a component for burden of suffering and potential litigation. If advances in technology can reduce the unit cost of measuring T4, the “TSH first” approach may be abandoned.


Table 6. Situations in Which Serum TSH Alone can Give a False or Uncertain Indication of Thyroid Status.

Condition

TSH

fT4

fT3

Primary abnormality of TSH secretion

Pituitary-hypothalamic abnormality

L- N

L


Extremely premature infants

L- N

L

L

Central TSH excess

N -H

H

H

Hyperthyroidism

T3 toxicosis

U

N

H

Subclinical

U

N

N

Early Treatment

U

H-N-L

H-N-L

TSH assay artefact

L- N -H

H

H

Hypothyroidism

Subclinical

H

N


Early Treatment

H

L-N


Thyroid hormone resistance

N -H

H

H

Medications

Dopamine

L

N

N

Glucocorticoids

L

N

L-N

Amiodarone (acute)

H

N-H

L

N: normal; L: low; H: high; U: undetectable.


Serum Free and Total T4


Estimation of free T4, or total T4 linked to a measurement of the thyroid hormone binding ratio, in association with serum TSH, has now become the standard method of assessing thyroid function, except in settings where the TSH-first strategy persists. Assays for total T4 and T3 in unextracted serum include a reagent such as 8-anilinonaphthalene sulfonic acid that blocks T4 and T3 binding to serum proteins, so that total hormone is available for competition with the assay antibody. Assays for free T4 or T3 omit this blocking reagent and use a wide variety of manoeuvres to isolate a moiety that reflects the free hormone concentration. The theoretical basis, practical utility, and validity of the many different approaches to the estimation of serum free T4 and T3, have been considered in detail (251) (see below).


Two key assumptions in any method of free T4 estimation are (i) that the dissociation of bound hormone with sample dilution is similar in samples and standards, and (ii) that samples and standards show identical protein binding of the assay tracer. If either of these conditions is breached, the assay is likely to give inaccurate results. Serum free T4 and free T3 can be estimated either by two-step methods that separate a fraction of the free hormone pool from the binding proteins before the assay incubation, or by one-step methods in which the free hormone concentration is measured in the presence of binding proteins (251). Many of the one-step methods become invalid when the sample and standard differ in their binding of assay tracer, but the two-step methods are less prone to non-specific artefacts. Almost all techniques of estimating free T4 give a useful correction for moderate variations in serum thyroxine binding globulin concentration, but no method can yet accommodate the effect of circulating competitors for T4 binding (193,235,252).


Indications for Measurement of Serum T3


Measurement of serum T3 is indicated, in addition to serum T4, as follows:

  1. In suspected hyperthyroidism with suppressed TSH and normal serum T4, to identify T3-thyrotoxicosis and distinguish this entity from subclinical thyrotoxicosis.
  2. During antithyroid drug therapy to identify persistent T3 excess, despite normal or low serum T4 values (253).
  3. For diagnosis of amiodarone-induced hyperthyroidism, which should not be based on T4 excess alone because of the frequency of euthyroid hyperthyroxinemia during amiodarone treatment (254,255).
  4. To assess the extent of T3 excess in individuals treated with thyroid extracts of animal origin, to assess a potentially damaging hormone excess that is not reflected by the level of T4.
  5. To identify T3-predominant thyrotoxicosis, an entity that is less likely to achieve remission (see below). In some studies this entity is been reported to respond poorly to radioiodine (256), a phenomenon that may relate to rapid iodine turnover within the gland (257).


Serum T3 measurements may also be useful:

  1. For estimation of the serum T3-T4 ratio. A high ratio (>0.024 on a molar basis or >20 calculated as ng/µg) that persists during antithyroid drug treatment suggests that patients with hyperthyroid Graves’ disease are unlikely to achieve remission (258). This ratio usually is lower in iodide-induced hyperthyroidism (259) or hyperthyroidism caused by thyroiditis (260) than in Graves’ disease.
  2. To detect early recurrence of hyperthyroidism after cessation of antithyroid drug therapy.
  3. To establish the extent of T3 excess during high-dose replacement or suppressive therapy with T4, or after an accidental or intentional T4 overdose.


Low serum T3 concentrations have little specificity or sensitivity for the diagnosis of hypothyroidism. Many patients with nonthyroidal illness have low values, and the serum T3 concentration can remain in the reference range until hypothyroidism is severe. Serum T3 concentrations are usually interpreted together with the concentrations of T4 (Table 7).


Table 7.  Relationship Between Serum T4 and T3 in Various Disorders*


Serum T4

Serum T3

Low

Normal

High

Low

Severe hypothyroidism

TBG deficiency #

Severe nonthyroidal illness

Euthyroid hypo-thyroxinemia

Nonthyroidal illness

Medications

Fetus

Restricted nutrition

Hyperthyroidism with

     severe nonthyroidal illness

Amiodarone

Normal

Iodine deficiency

T3 treatment

Hypothyroidism


T4 treatment

Euthyroid hyper- thyroxinemia

Hyperthyroidism with

     nonthyroidal illness

T4 binding autoantibodies

High

Iodine deficiency

T3 treatment

Antithyroid drugs

T3 toxicosis

T3 binding autoantibodies

Hyperthyroidism

Excess T4 ingestion

Hormone resistance

TBG excess #

* Excludes short term changes related to initiation or cessation of therapy

# Effect on total hormone concentration; free hormone concentration remains normal

TBG, thyroxine binding globulin


Indications for TRH Testing


The development of high-sensitivity TSH assays has almost eliminated the need for TRH testing in clinical practice. With intact hypothalamic-pituitary function, there is a close correlation between the TSH response to TRH and the basal level of serum TSH, when measured by a highly sensitive assay (261,262). Hence, TRH testing now offers little diagnostic advantage over accurate measurement of the basal serum TSH concentration in the detection of hyperthyroidism (263). However, measurement of serum TSH 20 to 30 minutes after intravenous injection of 200 to 500 µg TRH remains useful for several purposes:

  1. To assess patients whose basal serum TSH values are out of context, in order to identify assay artefacts. For example, a detectable serum TSH concentration that is unresponsive to TRH in a thyrotoxic patient suggests either non-specific assay interference (263), or the presence of a TSH-secreting pituitary tumor where serum TSH is often unresponsive to TRH (250).
  2. To distinguish between cases of thyroid hormone resistance and pituitary-dependent hyperthyroidism. In most instances of hyperthyroidism caused by TSH-secreting pituitary tumors there is no increase in serum TSH in response to TRH (250), while an increased serum TSH response to TRH is seen in the thyroid hormone resistance (227).


Serum Thyroglobulin


This iodinated 660 kDa dimeric glycoprotein, which is the scaffold for thyroid hormone synthesis, is normally detectable in serum and is released in excess in a wide variety of situations where thyroid tissue is overactive, inflamed, or proliferating (264). Undetectable serum levels suggest absence or suppression of thyroid tissue. In the past decade functional assay sensitivity has improved almost ten-fold from about 1 µg/L to around 0.1 µg/L. As a consequence, thyroglobulin (Tg) is now detectable in serum without TSH stimulation in a larger proportion of patients and has greater diagnostic sensitivity during continuing T4 therapy (265). Nevertheless, undetectable serum Tg in the presence of high TSH remains the benchmark for proof of successful ablation after treatment of differentiated thyroid cancer.

Standard indications for measurement of serum Tg are as follows:

  1. Follow-up of treatment for differentiated thyroid cancer to identify or rule out the presence of residual thyroid tissue, whether normal or metastatic. An undetectable serum thyroglobulin concentration in the presence of high TSH, whether achieved by thyroxine withdrawal, or injection of recombinant TSH, is presumptive evidence that differentiated thyroid tissue has been ablated (266). In contrast, the level of serum Tg that persists when serum TSH is suppressed, can give a useful index of tumor burden (201). In a 16-year follow-up study in differentiated carcinoma, post-ablative Tg concentration was a strong predictor of disease recurrence (267). However, serum Tg measurement is a technically challenging assay and criteria to define a 'highly sensitive' assay may be different, a good knowledge of the technical difficulties and interpretation criteria is of paramount importance for both clinical thyroidologists, laboratory physicians, and scientists involved in the care of differentiated thyroid cancer patients (268). Concurrent measurement of serum TSH and Tg antibody is always required for interpretation of serum Tg values.
  2. Investigation of atypical hyperthyroidism, where there is a suspicion of thyrotoxicosis factitia in which serum Tg is generally very low or undetectable (269).
  3. Assay of Tg in the needle washes after biopsy of extrathyroidal neck masses is useful in identifying metastatic thyroid tissue (270). This technique has higher specificity and sensitivity than cytology from suspect lymph nodes (271).
  4. Serum Tg may serve as a sensitive if non-specific marker of iodine deficiency or ineffective synthesis of thyroid hormone (272).


Because elevation of serum Tg concentration occurs in a wide range of thyroid disorders, interpretation of results always requires a knowledge of (i) the clinical context, (ii) the serum TSH concentration and (iii) whether Tg antibodies are present.


Interactions between serum Tg and circulating antibodies have the potential to cause false-negative assay results, as discussed below. However, measurement of Tg antibodies in the follow up protocol of treated differentiated thyroid carcinoma can also function as surrogate biomarkers for relapse of the thyroid carcinoma (273-275).


Thyroglobulin Antibodies (TgAb)


Assessment of thyroglobulin antibodies (TgAb) in serum is indicated:

  1. As an essential component of the interpretation of assays for serum Tg, to establish whether endogenous antibodies could be responsible for spuriously low Tg values by interfering with assay separation, particularly in immunometric assays. It is cause for concern that current assays for TgAb may not give congruent results when cross-matched in the assessment of Tg in antibody-positive samples (178,276,277) (See below).
  2. As secondary follow-up criterion in differentiated thyroid cancer, where a progressive decline in antibody concentration may follow successful ablation (273,274).
  3. In pregnant populations where positive anti-thyroperoxidase antibodies may not reflect the woman’s autoimmune status in all situations (278), perhaps in particular in iodine fortification programs. It may, however, turn out to be more important in future practice than previously thought (278), when previous advice of routine measurements of both thyroperoxidase/microsomal antibodies and TgAb were abandoned (279).


Thyroid Peroxidase Antibodies


This entity, previously termed antimicrosomal antibody, is closely linked with autoimmune thyroid disease, in particular Hashimoto’s thyroiditis. Measurement of thyroid peroxidase antibody is indicated as follows (278):

  1. To identify an autoimmune cause for primary hypothyroidism.
  2. In individuals with the TSH excess of mild thyroid failure, in whom a positive thyroperoxidase antibody indicates an approximately two-fold increase in risk of progression to overt hypothyroidism (280). A strongly positive result in the presence of mild thyroid failure may influence the decision to commence replacement.
  3. In screening for immune thyroid dysfunction or potential hypothyroidism before or early in pregnancy, especially in high-risk groups and as a predictor of the potential postpartum thyroid dysfunction (see below).
  4. In order to establish whether there is an immune basis for euthyroid goiter, and to evaluate the risk of future hypothyroidism at a stage before there is any increase in serum TSH
  5. In cases suspected of polyautoimmunity, where thyroid autoimmunity is by far the most prevalent autoimmune manifestation (16)


TSH Receptor Antibodies (TRAb)


Antibodies that interact with the TSH receptor can be measured either by bioassay, or competitive binding techniques. Bioassays that use thyroid cells of human or animal origin, or cells with transfected TSH receptor, generally depend on tissue production of adenylate cyclase for quantitation. These assays allow a distinction to be made between antibodies with thyroid stimulating (TSAb) and blocking (TBAb) activity. Radioreceptor (thyroid binding inhibitor immunoglobulin, TBII) assays that measure competition by circulating immunoglobulin for specific binding of labelled TSH, are widely available, but do not distinguish between blocking and stimulating activity.


A competitive binding assay using a recombinant human TSH receptor, showed 98-99% positivity in active Graves’ disease, with positive results in <1% of subjects with nonautoimmune thyroid diseases (281). Impressive sensitivity and specificity have been reported with an assay that uses solubilized native porcine TSH receptor with a biotinylated anti-porcine TSH receptor monoclonal capture antibody (282).


Indications for the measurement of TRAb vary in different practice environments, but are clearly applicable to the following situations:

  1. During pregnancy in women with active or previous autoimmune thyroid disease, to assess the risk of neonatal thyroid dysfunction due to transplacental passage of TRAb. Guidelines from the European Thyroid Association (ETA) (283) suggest that TRAb measurements should be made early in pregnancy in women who have received previous ablative treatment, and in the last trimester in women receiving drug treatment for active Graves’ disease. Antibody measurement during pregnancy was not considered necessary for Graves’ disease in remission. Recent guidelines from ETA, however, state that all patients with a history of autoimmune thyroid disease should have their TRAb serum concentrations measured at the first presentation of pregnancy using either a sensitive binding or a functional cell-based bio-assay and if they are elevated, again at 18-22 weeks of gestation (284).
  2. In the differential diagnosis of atypical hyperthyroidism that may be due to Graves’ disease.
  3. In atypical eye disease that may be due to Graves’ orbitopathy.
  4. In Graves’ orbitopathy for risk assessment of deterioration after radioiodine therapy for the hyperthyroidism.
  5. To assess the chance of achieving a drug-induced remission of Graves’ disease and to predict whether an apparent remission of Graves’ disease is likely to be sustained, or whether relapse should be anticipated, although this is still controversial (see below)(285-287).


TSH Alpha Subunit


Assay of the TSH alpha subunit is indicated where hyperthyroidism appears to be the result of central autonomous TSH excess to distinguish this entity from thyroid hormone resistance (250). Most TSH producing pituitary adenomas show an increase in alpha subunit (250), and this assay may serve as a useful tumor marker after treatment. By contrast, levels generally remain normal in thyroid hormone resistance (227). Values are also high in postmenopausal women, in men with hypogonadism, and in gonadotrophin-producing pituitary tumors; both thyrotrophs and gonadotrophs secrete this subunit.


Serum Reverse T3

rT3 levels are altered in some rare forms of impaired sensitivity to thyroid hormone: it is significantly reduced in patients with SBP2 mutations, and substantially increased in patients with MCT8 mutations. However, these syndromes are rare (288). Previous suggestions that it might be useful in distinguishing true hypothyroidism from the hypothyroxinemia of severe illness have not been confirmed (289). 

Urinary Iodine Estimation


Both iodine deficiency and excess can lead to important abnormalities of thyroid function. In contrast to the wide-reaching effects of iodine deficiency, especially in relation to pregnancy and the neonate (see below), possible iodine excess should be considered as a precipitating cause of hyperthyroidism in the following situations (290):

  1. Atypical hyperthyroidism with blocked isotope thyroid uptake, with features similar to those of excess thyroid hormone ingestion, or subacute thyroiditis without the expected systemic features.
  2. High dose requirement for antithyroid drug, or failure to respond to these medications. (In some instances, iodine-induced thyrotoxicosis may be extremely resistant to standard therapy, sufficient to require emergency thyroidectomy (291)).
  3. Rapid progression from subclinical to overt hyperthyroidism, especially in patients with autonomous multinodular goiter.


Thyrotoxicosis due to iodine excess, which may ultimately be self-limiting, may result from iodine-containing radiographic contrast media or medications, alternative or “natural” health care products and contaminated food products, as observed with soy milk preparations (292). In contrast to subtleties related to urine volume and concentration that are important in assessing urinary iodine excretion in population studies of iodine deficiency, the possibility of marked iodine excess can be assessed from a single urine sample (293). The urinary iodine concentration that can be regarded as excessive is ill-defined and may vary in different populations. Urinary iodine concentrations >1000 ug/l are certainly abnormal, but iodine-induced thyrotoxicosis may also occur at lower levels.


THYROID TESTING STRATEGIES IN SPECIAL SITUATIONS


Subclinical Dysfunction


Follow-up studies suggest that it is inappropriate to commence treatment for subclinical thyroid dysfunction on the basis of a single laboratory result, or even a confirmed assay result within a short period of time (87,103,168,294) (see above). Because both free T4 and TSH show spontaneous fluctuation, it has been suggested that frequent testing may increase the likelihood of an apparent change (295).


Hyperthyroidism


INITIAL DIAGNOSIS


The initial diagnosis of hyperthyroidism is securely established when excess of free T4 and free T3 is associated with an undetectable serum TSH concentration in an assay of appropriate sensitivity. However, the condition can be present without any one of these three criteria. T3-thyrotoxicosis, in which serum T4 remains normal, is more prevalent in iodine deficient regions (296) and can be a premonitory stage of typical hyperthyroidism (297). When hyperthyroidism coexists with another severe illness, serum T3 may be transiently normal or even subnormal (298). Detectable or increased serum TSH concentrations in the face of hyperthyroidism can be due to laboratory artefacts (263), or to autonomous over-secretion of TSH (250). The increase in free T4 and free T3 estimates is usually more marked than the increase in total hormone concentration. Progressive increases in serum total T4, will approach and eventually exceed the limited T4 binding capacity of thyroxine binding globulin (about 300 nmol/l or 24 ug/dl), leading to disproportionate increases in the free serum concentrations of T4 (299) and T3 (300), relative to their total concentrations.


TREATED HYPERTHYROIDISM 


In the early drug treatment of hyperthyroidism, measurements of serum T4 and T3 are required for dose adjustment because suppression of TSH may persist for months after correction of longstanding hyperthyroidism (298). Hence, failure to decrease thionamide dosage while TSH suppression persists, can result in serious over-treatment during the early phase of therapy. During thionamide therapy, hyperthyroidism may persist due solely to T3 excess (253); assessment of therapy based on serum T4 alone can then result in under-treatment. A daily dose of 15 mg methimazole can result in hypothyroxinemia in about 10 % of previously thyrotoxic subjects within 4 weeks (301); hence a reassessment of both serum free T3 and free T4 is timely after about 3 weeks to allow appropriate dose-adjustment. In contrast to these discrepancies during early treatment, serum TSH generally gives a reliable index of therapy during the long-term drug treatment of hyperthyroidism. The rate of change in serum free T4 and free T3 during treatment of hyperthyroidism with thionamide gives a valuable guide to dose adjustment, even while levels remain increased and serum TSH is still undetectable. For example, if serum T4 decreases by half in the first four weeks of treatment, it is appropriate to decrease the initial thionamide dosage by about half to minimize the possibility of over-treatment.


Davies et al. (302) assessed the prognostic significance of various serum TSH levels in a large cohort of patients treated with radioiodine 2-35 years previously, who were receiving no other treatment. After a further two years of follow-up, 83% of those with normal TSH had not changed their diagnostic category, although there was a trend for TSH to increase. An increased TSH was associated with a 14.5 % incidence of hypothyroidism after one year. Notably, spontaneous normalization of subnormal or undetectable TSH values during the follow-up period was more common than recurrence of overt hyperthyroidism (302). Hence, while an increased TSH value might be a pointer towards T4 treatment, there appears to be no basis for further radioiodine therapy solely because TSH remains suppressed. These treatment issues have also been described in guidelines from the ATA (303) and ETA (304).


Hypothyroidism


INITIAL DIAGNOSIS


The initial diagnosis of overt primary hypothyroidism is established by an increase in serum TSH with subnormal free T4; serum free T3 may remain normal except in severe cases. Subclinical hypothyroidism or mild thyroid failure is defined by persistent elevation of serum TSH, while free T4 remains normal (see above). The precise upper limit of the reference range for TSH is difficult to define, because of the approximately logarithmic distribution of this variable. The upper “tail” of normal TSH in the range 2-4 mU/l is thin and subjects with TSH concentrations in this range have an increased likelihood of future hypothyroidism, especially if thyroperoxidase antibodies are positive (280).


Serum TSH is the key to the distinction between primary and secondary hypothyroidism. A low serum free T4 in the absence of TSH elevation should always raise the possibility of a pituitary or hypothalamic abnormality, although this combination of findings is also frequent in a number of other situations (Table 8), especially during critical illness (190). It should be noted also that immunoreactive serum TSH is often detectable in secondary or central thyroid deficiency, a phenomenon that appears to result from dissociation between biological and immunological TSH activity (249). Hence, normal or even elevated serum TSH should not be interpreted as conclusive evidence againsthypopituitarism (305).


Table 8. Causes of Subnormal Free T4 without TSH Excess

Secondary or central hypothyroidism

Impaired biological activity of TSH

Critical illness

Falsely low free T4 estimate (method-dependent)

Dilution-dependent artefact (see below)

Effect of medications that compete for T4 binding

Impaired TSH response to hypothyroxinemia

Effect of severe illness

Medications e.g. dopamine, glucocorticoids


RESPONSE TO TREATMENT


A serum TSH value in the low-normal range between 0.5 and 1.5 mU/l, close to the geometric mean, is probably the best single indicator of appropriate thyroxine dosage during standard replacement therapy. In a study of ambulatory patients attending a thyroid clinic, hypothyroid patients taking T4 replacement seldom needed a serum free T4 measurement if the serum TSH was greater than 0.05 mU/L, although at lower TSH values, the magnitude of T4 excess did influence management (306). Numerous studies show that patients taking exogenous thyroxine show higher levels of serum total and free T4 for equivalent levels of serum TSH and T3 when compared with untreated euthyroid control subjects (307,308).


It should be noted that in some situations, for example patients with both ischemic heart disease and hypothyroidism, or in very old subjects, the appropriate dose of T4 should be influenced by clinical judgment as well as laboratory findings. The assessment of optimal levothyroxine dosage in patients with secondary or central hypothyroidism remains a challenge because serum TSH does not serve as a reliable marker of under-replacement. Serum TSH may in this context diminish during thyroxine replacement in hypopituitarism (309); while not of primary diagnostic value, the concentration may serve as an index of individual progressive response (186,310)). Since there is no readily available alternative variable of thyroid hormone action, it is generally appropriate to assess replacement clinically and on the basis of both serum T4 and T3. Measured levels of free and total T4 are influenced by the interval between tablet ingestion and blood sampling. In athyreotic subjects who took 0.15-0.2 mg T4 orally, the serum free and total T4 concentrations were increased by about 20% one to four hours later, with return to baseline about nine hours after T4 ingestion; serum TSH and T3 levels showed no time-dependent variation in relation to timing of thyroxine dosage (310).


In some situations, the regulation of T4 replacement is both unreliable, unpredictable and very variable. Excluding low patient compliance, this is often due to variable absorption of T4 from the gastrointestinal tract due to e.g. gastric or bowel disease (311), pernicious anemia with achlorhydria (312), a variety of over the counter medications such as antacids (313), laxatives (313), calcium (314), coffee (315), and many other substances. This untoward situation for the patient who is most often very negatively affected by the variable and irregular thyroid function can sometimes be alleviated by changing treatment formulation to a soluble form or soft gel capsules rather than tablets (312).


SUPPRESSIVE TREATMENT WITH T4


In line with recent guidelines for the stratification of risk in patients with differentiated thyroid cancer (316), there is no single TSH target during long-term postoperative thyroxine therapy (317,318). In high risk patients there may be benefit from adjusting T4 dosage to suppress TSH to undetectable levels (e.g. <0.03 mU/l). However, in many situations it may be appropriate to aim for a TSH target in the lower normal range in order to minimize adverse effects on bone and cardiovascular system. It is also worth noting that the initial ablative treatment of differentiated thyroid carcinoma tends to be less radical with classification into low and high-risk groups according to the guidelines. This may influence the long-term outcome which however remains to be seen in future long-term follow-up studies. When the aim of T4 suppressive therapy is regression of benign thyroid tissue, it may be adequate to give sufficient T4 to reduce serum TSH to 0.1 to 0.3 mU/L (319).


TREATMENT WITH T3


If currently available T3 formulations are used for replacement, it is difficult to monitor the effectiveness of treatment. Owing to its short plasma half-life, the serum concentration is highly dependent on the interval between dosage and sampling (320). There is also doubt as to whether TSH serves as an accurate index of thyroid hormone action during continuing T3 therapy, with the suggestion that doses of T3 required to normalize TSH could produce tissue hyperthyroidism (321). The difficulty of monitoring T3 replacement by currently available techniques is one of the arguments against the routine use of T3 or thyroid extract (321-323).


If the suggestion is confirmed that some genetically-identifiable individuals within the hypothyroid population are better served by combined T4-T3 therapy on the basis of polymorphism of type 2 deiodinase (324,325), or other variations in T4 transport and metabolism, the use of T4-T3 combination therapy will increase. That will require re-evaluation and refinement of monitoring strategies for combined replacement. The development of sustained-release T3 formulations will be advantageous, so that the interval between dosage and sampling can be minimized as a variable (326,327), and the treatment can thereby become more stable.


REPLACEMENT WITH UNCERTAIN INDICATION


The recent demonstration that fertility and pregnancy outcome may be adversely affected by minor degrees of thyroid dysfunction (see below) has led to the initiation of thyroxine treatment in women of reproductive age, who may lack conclusive criteria for lifelong therapy. It may later be questioned whether continuing replacement is required. Positive thyroperoxidase antibodies may be a basis for continuing therapy, but in the absence of this marker, measurement of serum TSH after 3-4 weeks withdrawal of treatment is likely to be definitive. The alternative of following the TSH response during partial replacement with T4, 50 ug daily, may be preferred. Similar approaches apply where no documented indication exists. Because of the difficulty in establishing the need for treatment during optimal replacement, it is an advantage for hypothyroid patients to retain a permanent record of pre-treatment documentation.


Assessment of Thyroid Function During Non-Thyroidal Illness (NTI)


Several distinct issues need to be considered when assessing thyroid function during critical illness. First, there is the possibility that an underlying thyroid abnormality might be missed, and second, prolonged severe illness per se may be associated with an abnormality of thyroid hormone secretion or action that may benefit from treatment (328,329). Third, some of the observed abnormalities will reflect the effect of medications or may be methodological artefacts.


It is difficult to rule out previously unrecognized or recent thyroid dysfunction by clinical assessment in critically ill patients; current laboratory tests often do little to resolve the problem. During severe illness, one or more of the assumptions that underpin the diagnostic use of the TSH-T4 relationship (see above) may not be valid. For example, acute fluctuations from the steady-state can lead to an anomalous T4-TSH relationship simply because of the marked difference in the plasma half-lives of T4 and TSH.


In general, the same sample assayed for TSH by various methods will give similar results during critical illness, while various estimates of free T4 may give widely divergent results (see below). When TSH and T4 changes are considered together, the abnormal results rarely correspond to standard criteria for diagnosis of primary hypothyroidism or hyperthyroidism. In contrast, persistent hypothyroxinemia without the corresponding anticipated rise in serum TSH is a common finding that suggests secondary or central hypothyroidism. These changes appear to be part of a broad neuroendocrine response that also involves the pituitary-adrenal axis, the pituitary-gonadal axis and the IGF binding proteins (329,330). Further study of these responses may eventually lead to therapy that could extend beyond thyroid hormone replacement, for example to substitution of hypothalamic releasing hormones (330).


The only reasonably robust method for distinguishing central hypothyroidism from thyroid function variables during critical illness is measurement of the T3 uptake test, which will be high (as opposite to low in central hypothyroidism) (331) and independent of the free T4 estimate which can be affected by a number of drugs used in intensive care patients (see below), and are anyway most often ‘false’ in the extreme situations (here low) where the automated methods for free thyroid hormones are unable to correct properly for binding protein abnormalities, or for abnormal binding to the binding proteins (331) (Figure 7).


EFFECTS OF MEDICATION

Interpretation of thyroid function tests during critical illness can be influenced by multiple medications (Table 3) (45), in particular dopaminergics and glucocorticoids, which inhibit TSH secretion, and a wide range of inhibitors of T4 and T3 binding to circulating thyroxine binding globulin (332). Thus, dopamine, dobutamine, glucocorticoids, octreotide, bexarotene, and metformin all inhibit pituitary TSH secretion, while an iodine load such as by using contrast agents, amiodarone or topical iodine preparations modifies hormone synthesis and release in a dual fashion. Lithium, glucocorticoids, and aminoglutethimide are inhibitors of both synthesis and release. Both amiodarone, glucocorticoids and beta-blockers, as well as hepatic contrast agents, inhibit T4-T3 5′ deiodination, and immune function modifications are seen by use of interleukin 1, interferon alpha, interferon beta and monoclonal antibody therapies.

Figure 7. Plots of peripheral thyroid hormone measurements (here T4) in various situations of thyroid dysfunction, protein binding abnormalities and drugs displacing the thyroid hormone from the binding proteins. The degree of distortion of the free T4 estimate depends on the assay methods (measurement platforms) as well as the degree of binding protein abnormalities. T3-test is able to distinguish central hypothyroidism from the effects of critical illness and displacement of the hormone by medicaments.

A number of drugs modify the binding of T4 and T3 to plasma proteins. e.g. estrogen, heroin, methadone, clofibrate, 5-fluouracil, perphenazine, tamoxifen, raloxifene, 5-fluouracil, and perphenazine, increase the concentration of thyroid hormone binding globulin, while glucocorticoids, androgens and l-asparaginase decrease the concentration. A number of drugs may displace T4 and T3 from binding proteins or displace T4 from the tissue pool and others increase the clearance of T4 and T3. A major issue in the serum free T4 measurement is drug and other interference in T4 replacement when absorption of T4 is impaired (333,334). This can happen in cases with impaired gastric activity (311), and coffee intake (315), but also any pharmaceutical drugs (335), many of them sold over the counter (313).

METHODOLOGICAL DISCREPANCIES IN NON-THYROIDAL ILLNESS


The Heparin Artifact and Free T4


The effect of heparin to increase serum free T4 is an important in vitro phenomenon that can lead to spuriously high estimates of circulating free T4 (236). In the presence of a normal serum albumin concentration, non-esterified fatty acid concentrations >3 mmol/l are required to increase free T4 by displacement from thyroxine binding globulin, but these concentrations are uncommon in vivo. However, in samples from heparin-treated patients, serum non-esterified fatty acids may increase to these levels during in vitro sample storage or incubation as a result of heparin-induced lipase activity (236) (Figure 8). This effect is accentuated by incubation of serum at 37ºC and by increased serum triglyceride or low serum albumin concentrations, particularly if the sample is pre-diluted. If heparin is given in vivo and the sample is then incubated at 37ºC, doses of heparin as low as 10 units may result in non-esterified fatty acid-induced increases in the apparent concentration of serum free T4 (235,237,336). The assay result is analytically correct but does not reflect the in vivo concentration of free T4. Low molecular weight heparin preparations have a similar effect (336).

Figure 8. Heparin-induced release of lipase in vivo can lead to in vitro generation of non-esterified fatty acids during sample incubation or storage. An increase in serum non-esterified fatty acid (NEFA) concentrations to >3 mmol/l is sufficient to displace T4 from thyroxine binding globulin, but such values are uncommon in vivo. This artefact is accentuated by high triglyceride or by low albumin concentrations.

Competitors for Plasma Protein Binding  


The accuracy of virtually all methods of free T4 estimation is compromised by medications that displace T4 and T3 from thyroxine binding globulin. Current methods tend to underestimate the concentration of free T4 in the presence of binding competitors because of dilution-related artefacts. Binding competitors are usually less protein-bound than T4 itself so that progressive sample dilution leads to a fall in the free concentration of competitor before the free T4 concentration alters (235). (For a hormone such as T4, with a free fraction in serum of about 1:4000, progressive dissociation will sustain the free T4 concentration up to at least 1:100 dilution. In contrast, 1:10 dilution of serum will result in a marked decrease in the free concentration of a drug that is 98% bound, i.e. has a free fraction in serum of 1:50). Because displacement depends on the relative free concentrations of primary ligand and competitor, the underestimate of free T4 will be greatest in assays with the highest sample dilution. This important dilution-dependent difference between various free T4 methods was shown by the relative ability of three commercial free T4 assays to detect the T4-displacing effect of therapeutic concentrations of furosemide (Figure 9) (337).


Similarly, therapeutic concentrations of phenytoin and carbamazepine increase the free concentration of T4 by 40-50% using ultrafiltration of serum that had not been diluted, while the free hormone estimate was spuriously low using a commercial single-step free T4 assay after 1:5 serum dilution (245).

Figure 9. Influence of increasing serum concentrations of added furosemide on estimates of serum free T4 using three commercial free T4 methods that involve varying degrees of sample dilution. The effect of the competitor is progressively obscured with increasing sample dilution (redrawn from (337)).

It is possible that methodologic artefacts have influenced previous descriptions of free T4 changes during critical illness. On the one hand, an apparent increase in free T4 may arise from heparin-induced in vitro generation of free fatty acids during sample incubation (236). On the other hand, estimates of free T4 may be spuriously low in assays that use diluted serum (235,245).


Divergent Estimates of Free T4 


That estimates of free T4 may show opposite discrepancies by different methods was shown by Sapin et al. (338) in a prospective study of bone marrow transplant recipients. Twenty previously euthyroid subjects were studied on the seventh day after bone marrow transplantation using six commercial free T4 kits, during multiple drug therapy, including heparin and glucocorticoids (Figure 10). Free T4 methods that involved sample incubation at 37ºC showed supranormal free T4 values in 20-40% of these subjects (see heparin effect above), while analog tracer methods that are influenced by tracer binding to albumin gave subnormal estimates of free T4 in 20-30%. By contrast, total T4 was normal in 19 of these 20 subjects. Serum TSH was <0.1 mU/l in half the subjects, independent of the method that was used. Thus, there was the possibility that an erroneous diagnosis of either hyperthyroidism or secondary or central hypothyroidism could be considered, solely as a result of variations in free T4 methodology.

Figure 10. Free T4 estimated by six different kit methods in 20 previously euthyroid patients on the seventh day after bone marrow transplantation. There was a high proportion of abnormal values, either increased or decreased, depending on the type of free T4 method used (see text). Therapy included heparin and glucocorticoids at the time of sampling. The mean for each method has been normalized to 100%, with the limits of the range shown by the box. Serum total T4 remained normal in 19 of the 20 study subjects, while serum TSH was subnormal in 11, independent of assay method (redrawn from (338))

SERUM TSH IN CRITICAL ILLNESS


Serum TSH assessment in severe non-thyroidal illness depends on the sensitivity of the particular method. The “third generation” assays with a functional sensitivity below 0.01 mU/L are generally sufficiently sensitive to distinguish the very low values in most thyrotoxic patients from the subnormal but somewhat higher TSH levels of non-thyroidal illness (59,339). Among a group of patients with low serum TSH values (<0.1 mU/L), almost all thyrotoxic patients had values less than 0.01 mU/L, when assessed with a highly sensitive assay, whereas most critically ill euthyroid patients had values between 0.01 and 0.1 mU/L (59). However, in another study, about 4% of patients with non-thyroidal illness had values below the functional sensitivity of a “third generation” assay, indicating that an absolute distinction cannot be made on the basis of TSH alone (339).


Differentiated Thyroid Cancer


There is now consensus that not all patients with differentiated thyroid cancer require T4 treatment in doses that achieve complete TSH suppression. Thus, based on a general assessment of risk (316,317,340), a TSH target should be determined as a guide to T4 dosage. In the follow-up of differentiated thyroid cancer the interpretation of TSH and serum Tg is inter-dependent. For studies done after initial near-total thyroidectomy, following withdrawal or temporary reduction of suppressive therapy (341) (or with the use of recombinant human TSH (342), serum TSH levels in excess of 30 mU/l appear to achieve adequate stimulation of potential Tg production (343). The failure of endogenous TSH to increase into this range suggests too short a period of T4 withdrawal, a compliance problem, or the presence of a substantial amount of active thyroid tissue.


Serum Tg measurement and whole body radioiodine scanning have generally been used in a complementary fashion, but there is now good evidence that current assays for Tg have greater sensitivity than follow-up whole body scanning with 2mCi 131I (316). There has been a clear trend to place greater emphasis on measurements of Tg and to move away from repeated low dose diagnostic whole-body radioiodine scanning, a procedure that has limited sensitivity (344,345). Management of low risk patients now tends to be based on assessment of serum Tg after recombinant TSH stimulation, without the need for diagnostic scanning (345). However, based on reported data the current fashion of obviating RAI based on a negative post-operative US and low serum Tg value is not yet supported by the literature and should be investigated using well designed prospective studies with clear-cut endpoints (346). In the opinion of these authors, the evolution of thyroid cancer management cannot pass through a substitution of RAI by serum Tg measurement and neck US but by an appropriate use of radioiodine theranostics. This will also need to develop basic and clinical research programs that bring together physicians from various specialties.


Undetectable serum Tg in the years after ablative treatment has been shown to be a reliable index in ruling out persistent or recurrent disease that requires further evaluation and treatment. Detectable serum Tg, together with detailed ultrasonography for localization has become the mainstay of further investigation (347). There has also been a tendency to deescalate serum Tg measurements by using only unstimulated sensitive serum Tg measurement and not rTSH stimulated assessments (348). Based on ATA’s most recent 2015 guidelines (316), Sunny et al. (349)performed a systematic study of 650 patients followed for papillary thyroid carcinoma who had total thyroidectomy performed and compared the evolution of stimulated and unstimulated serum Tg concentrations. The concentrations were corroborated with tumor burden as determined by additional clinical, ultrasonography neck, and whole-body scintigraphy. The study highlighted the superiority of sSTg over uSTg in the follow-up of papillary thyroid cancerpatients. Follow-up with uSTg alone may result in underestimating the tumor burden.


It should not be forgotten, that serum Tg can only be reliably measured in TgAb negative samples, even if measured by high sensitive Tg assays (268,269) so they need to be assessed each time a serum Tg is measured, even if the patient has previously been negative for the antibodies (268,269,350). It also should not be forgotten that measurement of serum TgAb can themselves be used as surrogate markers of relapse/metastases from differentiated thyroid carcinoma (274-276,351).


Assay of thyroglobulin on needle washes of suspect lymph nodes has a high degree of sensitivity and specificity, apparently superior to cytological examination (271,272). During long-term follow-up, it is crucial that clinicians are kept informed of changes in serum thyroglobulin methodology that may give a false impression of remission or recurrence (see above).


Psychiatric Illness


An unusual variety of euthyroid hyperthyroxinemia occurs in some patients hospitalized with acute psychiatric illness (195). Serum T4 is increased, but serum T3 is less frequently elevated; serum TSH is generally normal or slightly high (352). These abnormalities, presumed to be due to central activation of the hypothalamic-pituitary-thyroid axis, often resolve in several weeks (195).


Assessment of Thyroid Function Before, During and After Pregnancy


Recent advances in the understanding of the importance of optimal maternal thyroid function for fetal brain development in early pregnancy, as well as the influence of thyroid immunity, or thyroid status, on numerous pregnancy outcomes, has greatly increased the frequency of thyroid testing before, during, and after pregnancy. Several guidelines have been published from The Endocrine Society (353), American Thyroid Association (8) – and for subclinical hypothyroidism from European Thyroid Association (9). Projecting this to fertility issues even complicate matters further, and no consensus can currently be obtained (354). There is thus also still controversy regarding whether to treat subtle abnormalities of thyroid dysfunction in the infertile female patient. This guideline document reviews the risks and benefits of treating subclinical hypothyroidism in female patients with a history of infertility andmiscarriage, as well as obstetrical and neonatal outcomes in this population.


Clinical guidelines from The Endocrine Society (353) suggest consensus, but significant controversies remain (355). Evidence exists that obstetricians struggle with the diagnosis and treatment of hypothyroidism. According to recent surveys, the management of hypothyroidism during pregnancy is the number 1 endocrine topic of interest for obstetricians. A synopsis of recently published subspecialty guidelines is timely but has not really been done yet. The reproductive effects of abnormal thyroid function and its immune associations are considered in other Endotext chapters. This section will consider the issues from the point of view of testing strategy and assay methodology. From studies of pregnancy outcome, some evidence has become persuasive that miscarriage rate and prematurity (6,356-358) are favorably influenced by maternal thyroid hormone replacement, even when hypothyroidism would be regarded as “subclinical” by standard criteria. Some clinicians advocate early and liberal screening and treatment (356,358), but a recent Cochrane review, however, did not find any clear benefit for universal screening rather than case finding (6).They found based on the existing evidence, that though universal screening for thyroid dysfunction in pregnancy increases the number of women diagnosed with hypothyroidism who can be subsequently treated, it does not clearly impact (benefit or harm) maternal and infant outcomes. While universal screening versus case finding for thyroid dysfunction increased diagnosis and subsequent treatment, they found no clear differences for the primary outcomes: pre-eclampsia or preterm birth. No clear differences were seen for secondary outcomes, including miscarriage and fetal or neonatal death; data were lacking for the primary outcome: neurosensory disability for the infant as a child, and for many secondary outcomes. Though universal screening versus no screening for hypothyroidism similarly increased diagnosis and subsequent treatment, no clear difference was seen for the primary outcome: neurosensory disability for the infant as a child (IQ <85 at three years); data were lacking for the other primary outcomes: pre-eclampsia and preterm birth, and for the majority of secondary outcomes. For outcomes assessed using the GRADE approach the evidence was considered to be moderate or high quality, with any downgrading of the evidence based on the presence of wide confidence intervals crossing the line of no effect. More evidence is needed to assess the benefits or harms of different screening methods for thyroid dysfunction in pregnancy, on maternal, infant and child health outcomes. Future trials should assess impacts on use of health services and costs and be adequately powered to evaluate the effects on short- and long-term outcomes (6).

A key consideration is therefore still whether thyroid function should be universally tested (357) and if so whether it should be done before or early in pregnancy, in view of the fact that women at risk of adverse outcome cannot be identified reliably from their clinical history, even if this is assessed in full detail (359). A recent review (358) has concluded that current guidelines agree that overt hyperthyroidism and hypothyroidism need to be promptly treated and that as potential benefits outweigh potential harm, subclinical hypothyroidism also requires substitutive treatment. The chance that women with thyroid autoimmunity may benefit from levothyroxine treatment to improve obstetric outcome is intriguing, but adequately powered randomized controlled trials are needed. The issue of universal thyroid screening at the beginning of pregnancy is still a matter of debate, and aggressive case-finding is supported. Careful discussion between the physician and patient concerning benefits on the one hand and unnecessary disease burden should be carried out (359).


METHODOLOGICAL ISSUES


Some methodological issues are relevant before the application of tests is considered (360). There has been almost universal acceptance of free T4 estimates in preference to total T4 measurement in pregnancy because of the well-known estrogen effect to increase thyroxine binding globulin and hence total T4. It is clear that normal pregnancy is associated with a marked increase of about 40% in total T4 concentration, but free T4 is maintained close to normal non-pregnant levels (360). Previous suggestions that free T4 actually declines significantly in late pregnancy (361) are uncertain because of wide method-dependent variations, with strong negative bias in some methods (362-364). In a comparative study of free T4 by seven commercial methods in 23 euthyroid women at term, Roti et al. found that albumin-dependent methods show marked negative bias, with up to 50% subnormal values, while other methods gave values above their non-pregnant reference interval (362). Notably, particularly during pregnancy, methods of free T4 estimation fall far short of desirable assay standardization criteria that aim to minimize between-assay variation (171).


A study by Lee et al. confirmed marked negative bias in free T4 estimates during pregnancy and questioned the basis for continuing to rely on free thyroxine estimates during pregnancy (365). In contrast to two kit free T4 methods, totalserum T4 and its derivative, the free T4 index, showed the anticipated inverse relationship with serum TSH, with historically consistent results in numerous reports (365). Thus, because of consistency between methods, total T4 measurement may be superior to free T4 estimation as a guide to therapy during pregnancy, provided that reference values take account of the normal estrogen-induced increase in thyroxine binding globulin during pregnancy (360,366).


Serum TSH is generally analytically reliable during pregnancy, but the reference interval is lower at the end of the first trimester, associated with the effect of human choriogonadotropin as a surrogate thyroid stimulator (360). Hence, the general advice that tests of thyroid function during pregnancy should relate to trimester-specific reference intervals (360,367). In the case of free T4, ranges also need to be method-specific (362-365,367). The magnitude of method-dependent variations between non-pregnant and third trimester free T4 estimates is shown in Figure 11.


Figure 11. Free T4 estimates in the third trimester of pregnancy show large method-dependent differences from the reference intervals for non-pregnant subjects. Redrawn from ref. (363) and (364) which identify each method studied. The left panel shows values measured by equilibrium dialysis (ED). The solid bars indicate third trimester free T4 estimates, the grey bars, non-pregnant results.

It has recently been demonstrated that mass spectrometry measurement of free thyroid hormones  may alleviate the problems of flaws in the usual free thyroid hormone measurements in pregnancy (368), although these results need to be confirmed on the one hand, and a solution to the must higher costs of this type of methodology has to be solved on the other hand. Until then a pragmatic approach is to use total thyroid hormone measurements multiplied by 1.5 as useful reference interval during pregnancy.


There is also during pregnancy, as in the non-pregnant state, a very high individuality index i.e. the intraindividual variability of pregnant women is much higher than the interindividual population- and even trimester-based reference range (369), which further complicates thyroid function assessment in cross sectional measurements. The function variables become much more clinically significant when measurements are used in longitudinal assessments e.g. during pregnancy.


BEFORE PREGNANCY OR WHEN PREGNANCY IS CONFIRMED


Because of the adverse effects of maternal thyroid deficiency, there is agreement that pre-pregnancy testing is now mandatory to optimize thyroxine replacement and to assess thyroid status in women who have an increased risk of thyroid dysfunction (8,9,353,370-372), for example a history of recurrent miscarriage, impaired fertility requiring assisted reproductive technology, type 1 diabetes, or any other factors known to be associated with increased risk of thyroid dysfunction (Table 2). Notably, in one key study, about a third of women with subclinical or overt hypothyroidism in the first trimester would have been missed if testing had been confined to those assessed as being at higher risk, based on detailed questioning about potential risk factors, in particular a personal or family history of thyroid or other autoimmune disorder, or previous thyroid-related treatment (373). A further study confirms that about half of the women at risk for pregnancy-related thyroid dysfunction would be missed by testing confined to the group assessed to be at high risk (374). Hence, the view that routine testing may now be warranted (14). Because the major influence of thyroid hormone on fetal brain development is early in pregnancy and the onset of thyroid hormone action is slow, effective testing needs to be done earlier than would follow the first routine obstetric visit at 10-12 weeks.


While there is now good evidence that any level of TSH elevation that suggests maternal hypothyroidism should be treated, there is currently no consensus about responses to other test abnormalities. An important finding is that thyroxine treatment of peroxidase antibody-positive euthyroid women from about the end of the first trimester may improve obstetrical outcome, as judged by rates of miscarriage and premature delivery (375). A recent meta-analysis confirms that thyroid autoantibodies are associated with miscarriage and preterm delivery and suggests that thyroxine treatment diminishes these risks (376). Pre-partum assessment of antibody status may also provide information that improves prediction of post-partum thyroid dysfunction (377).


A different aspect is related to women already on thyroxine replacement therapy before pregnancy. It has been shown that almost 50% of thyroxine treated women were not optimally replaced in early pregnancy (TSH <0.4 or >4.0 mU/l) with the potential for significant adverse effect on pregnancy outcome (370). In thyroxine-treated women it should now be standard practice to assess optimal replacement prior to pregnancy and to re-evaluate this when pregnancy is confirmed, with a prompt 25-30% increase in replacement dosage (371), with two extra daily doses per week as an approximation. The required increase is larger in women who have had thyroid ablation than in those with spontaneous hypothyroidism (371).


A special situation arises in thyroxine-treated women who have in vitro fertilization. Ovulation-induction cycles, even in the absence of ongoing pregnancy, can be associated with 2-10 fold increases in serum TSH (378), indicating that previously adequate replacement may not accommodate estrogen-induced thyroxine requirements induced by a very rapid increase of thyroid hormone binding proteins. This suggests that women who lack endogenous thyroxine should receive increased dosage from the time of ovulation induction, to accommodate increased thyroxine requirement, whether associated with a subsequent pregnancy, or not. The need to routinely test thyroid function before in vitro fertilization and institute or increase thyroxine treatment seems self-evident.


ASSESSMENT DURING PREGNANCY


In women treated for hypothyroidism, some guidelines still recommend that replacement thyroxine dosage should be progressively adjusted in pregnancy in response to increasing serum TSH, a response that is likely to be too late to assure optimal first trimester maternal T4 levels for optimal fetal brain development. Hence, the advice to increase dosage by two daily doses per week as soon as pregnancy is confirmed, followed by a check of serum TSH about 4 weeks later (353,371).


In women treated for Graves’ disease with antithyroid drug, dose reduction should be the aim, keeping TSH in the lower normal range. In contrast to the adverse effects of even the mildest grades of hypothyroidism, an extensive study has shown no adverse effect of mild overactivity during pregnancy (379). It is thus often possible to cease antithyroid drug late in pregnancy, with prospective follow-up to detect post-partum recurrence. In contrast to immune thyroid disorders, nodular thyroid disorders do not appear to show marked fluctuation during and after pregnancy. Recent guidelines recommend the use of propyluracil in the first trimester (380), and thiamazole (methimazole) thereafter due to the risk of birth defects by thiamazole (380,381), and general side effects to propylthiouracil (382,383).


In the event of uncontrolled or severe maternal hyperthyroidism, careful assessment should be made of fetal growth and thyroid size followed by fetal blood sampling in some cases as a guide to optimal therapy (384,385). Guidelines for the assessment of TRAb to gauge the likelihood of neonatal thyrotoxicosis have been discussed above (283).


POSTPARTUM ASSESSMENT


Among women who were euthyroid prior to pregnancy, autoimmune thyroid dysfunction not due to Graves' disease occurs in approximately 5–8% in the first year post-partum (386). Postpartum thyroiditis is an autoimmune disorder that causes lymphocytic inflammation of the thyroid. It is more frequent in women with elevated first-trimester serum thyroperoxidase antibody concentrations (387) and in women with other autoimmune disorders, such as type 1 diabetes mellitus (388,389).


The thyroid inflammation in postpartum thyroiditis initially leads to transient thyrotoxicosis as preformed thyroid hormones are released from the damaged gland. This phase usually occurs 1–3 months post-partum and lasts for 6–9 weeks. Symptoms are typically mild, but rarely florid, transient thyrotoxicosis can be seen. Serum T4 levels are proportionally higher than T3 levels, reflecting the ratio of stored hormone in the thyroid gland (in contrast to Graves' disease where T3 is often preferentially elevated) (390).


In prospective studies there is a high prevalence of thyroid dysfunction during the post-partum period (8,353), and a high percentage of those women with subclinical postpartum thyroiditis proceeded to permanent thyroid failure (391,392). In an Australian study, this effect was most pronounced in women with low iodine intake (393). Hence, women with postpartum hypothyroidism should be treated on the basis of confirmed TSH elevation even if the indication for lifelong replacement has not been firmly established. This strategy is especially important because untreated maternal hypothyroidism has critical implications for fetal development in subsequent pregnancies. Also, recent findings of psychiatric disorders coinciding with autoimmune thyroid disorders in the postpartum period (394)indicates that these women should be screened for thyroid dysfunction, and very likely both conditions should be followed on a longer term basis if significant in the postpartum period. By contrast, almost all women with suppressed or subnormal TSH values 6 months postpartum, showed normal TSH 12 and 18 months later, indicating that postpartum hyperthyroidism is likely to be a temporary phenomenon (8,353).


In women with established hypothyroidism, replacement dosage of thyroxine can generally be decreased to the pre-pregnancy dose with testing deferred for several months to review dosage. In Graves’ hyperthyroidism, where antithyroid drug has been ceased during pregnancy, resumption of treatment is generally deferred, based on symptoms and the results of testing at two-three monthly intervals. Where thyroperoxidase antibody testing early in pregnancy has been positive in the absence of frank thyroid dysfunction, prospective testing may be warranted in the 12 months post-partum.


Knowledge of maternal thyroid status should be taken into account in assessing the significance of neonatal screening for congenital hypothyroidism, because of reports of temporary effects of maternal blocking antibody in the infant.


IODINE STATUS  


The critical importance of adequate iodine nutrition during pregnancy is widely acknowledged. The increased pool of thyroxine that follows from the increase in serum thyroxine binding globulin, as well as increase in urinary iodine excretion that will aggravate any degree of iodine deficiency, with potential for adverse effects on fetal development. While assessment of iodine status by measurement of urinary iodine excretion in individual women does not have wide support, data on iodine nutrition within each geographical area should be an important public health issue, with appropriate supplementation to achieve estimated urinary iodine excretion in the range 150-300 microgram daily in pregnant women.


THE PHYSICIAN-LABORATORY INTERFACE


Because of the diverse clinical presentations of thyroid dysfunction, initial requests for assessment of thyroid function are often made by clinicians who, while alert to the possibility of thyroid dysfunction, may not be familiar with the limitations of current assays, or with medication effects. Clinical decisions can be assisted by comments from the laboratory, based on detailed knowledge of current immunoassay limitations (263,395-398). The quality of this assistance will depend on two key components: the training and experience of the reporter and the available clinical information. It is therefore paramount that clinicians and clinical biochemistry specialist communicate, since a practical and useful approach to optimal patient management can only be achieved by collaboration (178).


Historical


The competitive binding assays that are used for thyroid diagnosis were initially developed 30-35 years ago by clinical investigators who used ‘in house’ assay reagents and were often closely involved in patient care. This nexus between laboratory and clinical investigation allowed deficiencies in early assays to be readily appreciated, but advanced diagnostic technology was available to only a few practitioners, with results sometimes available only after long delay. In recent decades there has been a strong trend away from ‘in house’ reagents which have been replaced by kits that incorporate highly sophisticated standardized reagents and automated instrumentation (e.g. solid phase antibodies, magnetic separation systems, chemiluminescent detection systems). Assay turnaround is much faster and up-to-date techniques are widely available to almost all practitioners, most of whom are inexperienced in endocrinology or laboratory methodology. Non-specialist users of endocrine assays are most likely to benefit from laboratory assistance in the interpretation of results, but as assay automation has increased, laboratory professionals have become more distant from the bedside. As clinicians receive less assistance, they tend to provide less relevant information and vice versa. Laboratory personnel in turn, see results that are uninterpretable or ambiguous without the relevant clinical background. Potential assay imperfections may be ignored simply because clinical correlation is not possible (see below).


Diagnostic Approach to Discordant or Apparently Anomalous Results


The relationship between laboratory results and clinical findings may be either concordant or discordant. With discordant results, a distinction needs to be made between a previously unsuspected diagnosis, subclinical disease, and anomalous assay results. If the assay result is confirmed, the fundamental assumptions that underpin the diagnostic use of tropic-target hormone relationships should be considered (see above).


The following steps may be helpful in evaluating anomalous assay results:

  1. Re-evaluation of the clinical context, with particular attention to pre-diagnostic probability, long-term features suggestive of thyroid disease and medication history.
  2. Assessment of whether serum TSH is markedly suppressed (<0.05 mU/l) or simply in the subnormal-detectable range.
  3. Further sampling to establish whether the anomalous result is persistent or transient.
  4. Estimation of serum free T4 by an alternative method, preferably a two-step technique that removes binding proteins from the assay system before quantitation.
  5. If hyperthyroidism is suspected, measurement of the serum free T3, or total T3 with appropriate binding correction.
  6. Measurement of serum total T4 to establish whether the serum free T4 is disproportionately high or low, possibly due to a preanalytical or method-dependent artefact.
  7. Possible evaluation of propositus and family members for evidence of unusual binding abnormalities or hormone resistance.


In some circumstances, the cause of an apparently anomalous or unusual laboratory result may become obvious from the clinical context (table 10). By taking account of drug therapy, or acute perturbation of the pituitary-thyroid axis, assay validity can be affirmed and unnecessary further investigation may be avoided.


Table 10.  Situations in Which Interpretation of Unusual Laboratory Results Depends on Relevant Clinical Information

Clinical background

Assay Results

fT4

fT3

TSH

Pregnancy

L*

L,N

N

Antithyroid drug treatment, initial months

H,N,L

H,N,L

U

Recent T4 commencement for hypothyroidism

N

N

H

Hypothyroidism, appropriate T4 dose

H

N

N

Hypothyroidism, intermittent compliance

H,N


H

Appropriate T4 suppressive therapy

H

N

U,L

Recombinant TSH, suppressive T4

H

N

H

Hypopituitarism

L


L,N

Phenytoin

L*


L,N

Critical illness

L*

L

L

Heparin effect in critical illness

L,N,H*

L

L

Recovery phase of critical illness

L,N


H

Drugs that inhibit T4/T3 binding to TBG

L*

L*

L,N

Amiodarone effect in euthyroid subject

H

L

N

Acute T4 overdose

HH

H,N

N

Rheumatoid arthritis

N

N

H

U undetectable; L low; N normal; H high; * effect dependent on assay method


Clinical Feedback, Quality Assurance, and Cost Effectiveness


Clinical feedback will remain a key aspect of quality assurance in laboratory testing. While assay precision or reproducibility can be evaluated solely in the laboratory, diagnostic accuracy requires clinical correlation. As with any diagnostic test, the non-specificity of a procedure may not become apparent until the full diversity of the non-diseased population is appreciated. Premarketing evaluation of assays may fail to include the critical samples that probe the diagnostic accuracy of an assay, so that non-specific interference is not appreciated until procedures have been in use for some time.


In studies of “cost effectiveness” it is hard to evaluate the human and financial costs that result from needless duplication, unnecessary testing and inappropriate management. Diagnostic inaccuracy of immunoassays may account for substantial unnecessary expenditure on laboratory resources (263,397,398). Dilution effects and binding protein abnormalities that affect free T4 estimation, the multiple effects of medications in non-thyroidal illness and the problems associated with thyroglobulin autoantibodies will continue to challenge both clinical chemists and clinicians; further technological development will not substitute for collaboration between these two groups.


Clinical issues may influence the selection of thyroid tests that will best serve a particular population. For example, the effects of severe illness on free T4 estimates may be of minor importance for a laboratory that serves predominantly ambulatory patients. A different assay profile, with emphasis on measurement of total hormone as the “gold standard” for T4 assessment may be required in a laboratory that evaluates thyroid function during critical illness (328-330) or in obstetric practice (8,353). In the future, hopefully a more sophisticated methodology such as tandem mass spectrometry may be able to eliminate the many confounders in thyroid hormone measurements.


ACKNOWLEDGEMENTS


The chapter was updated from a previous comprehensive version by the late Jim Stockigt M.D., FRACP, FRCPA, Monash University and Alfred and Epworth Hospitals, Melbourne, Australia.


REFERENCES


  1. Clinical guideline, part 1. Screening for thyroid disease. American College of Physicians. Annals of internal medicine 1998; 129:141-143
  2. Helfand M, Redfern CC. Clinical guideline, part 2. Screening for thyroid disease: an update. American College of Physicians. Annals of internal medicine 1998; 129:144-158
  3. Danese MD, Powe NR, Sawin CT, Ladenson PW. Screening for mild thyroid failure at the periodic health examination: a decision and cost-effectiveness analysis. Jama 1996; 276:285-292
  4. Casey B, de Veciana M. Thyroid screening in pregnancy. American journal of obstetrics and gynecology 2014; 211:351-353.e351
  5. Velasco I, Taylor P. Identifying and treating subclinical thyroid dysfunction in pregnancy: emerging controversies. European journal of endocrinology 2018; 178:D1-d12
  6. Spencer L, Bubner T, Bain E, Middleton P. Screening and subsequent management for thyroid dysfunction pre-pregnancy and during pregnancy for improving maternal and infant health. The Cochrane database of systematic reviews 2015:Cd011263
  7. Stagnaro-Green A. Clinical guidelines: Thyroid and pregnancy - time for universal screening? Nature reviews Endocrinology 2017; 13:192-194
  8. Alexander EK, Pearce EN, Brent GA, Brown RS, Chen H, Dosiou C, Grobman WA, Laurberg P, Lazarus JH, Mandel SJ, Peeters RP, Sullivan S. 2017 Guidelines of the American Thyroid Association for the Diagnosis and Management of Thyroid Disease During Pregnancy and the Postpartum. Thyroid 2017; 27:315-389
  9. Lazarus J, Brown RS, Daumerie C, Hubalewska-Dydejczyk A, Negro R, Vaidya B. 2014 European thyroid association guidelines for the management of subclinical hypothyroidism in pregnancy and in children. European thyroid journal 2014; 3:76-94
  10. LaFranchi S. Congenital hypothyroidism: etiologies, diagnosis, and management. Thyroid 1999; 9:735-740
  11. Delange F. Neonatal screening for congenital hypothyroidism: results and perspectives. Hormone research 1997; 48:51-61
  12. Bhatara V, Sankar R, Unutzer J, Peabody J. A review of the case for neonatal thyrotropin screening in developing countries: the example of India. Thyroid 2002; 12:591-598
  13. Gupta R. Nobody's children. The lancet Diabetes & endocrinology 2015; 3:486
  14. Alexander EK. Here's to you, baby! A step forward in support of universal screening of thyroid function during pregnancy. The Journal of clinical endocrinology and metabolism 2010; 95:1575-1577
  15. Selmer C, Faber J. Mild Thyroid Dysfunction: A Potential Target in Prevention of Atrial Fibrillation? Circulation 2017; 136:2117-2118
  16. Bliddal S, Nielsen CH, Feldt-Rasmussen U. Recent advances in understanding autoimmune thyroid disease: the tallest tree in the forest of polyautoimmunity. F1000Research 2017; 6:1776
  17. Jenkins RC, Weetman AP. Disease associations with autoimmune thyroid disease. Thyroid 2002; 12:977-988
  18. Wiebolt J, Achterbergh R, den Boer A, van der Leij S, Marsch E, Suelmann B, de Vries R, van Haeften TW. Clustering of additional autoimmunity behaves differently in Hashimoto's patients compared with Graves' patients. European journal of endocrinology 2011; 164:789-794
  19. Schaub RL, Hale DE, Rose SR, Leach RJ, Cody JD. The spectrum of thyroid abnormalities in individuals with 18q deletions. The Journal of clinical endocrinology and metabolism 2005; 90:2259-2263
  20. Kaptein EM. Thyroid hormone metabolism and thyroid diseases in chronic renal failure. Endocrine reviews 1996; 17:45-63
  21. Stagi S, Bindi G, Neri AS, Lapi E, Losi S, Jenuso R, Salti R, Chiarelli F. Thyroid function and morphology in patients affected by Williams syndrome. Clinical endocrinology 2005; 63:456-460
  22. Faggiano A, Pisani A, Milone F, Gaccione M, Filippella M, Santoro A, Vallone G, Tortora F, Sabbatini M, Spinelli L, Lombardi G, Cianciaruso B, Colao A. Endocrine dysfunction in patients with Fabry disease. The Journal of clinical endocrinology and metabolism 2006; 91:4319-4325
  23. Sinard RJ, Tobin EJ, Mazzaferri EL, Hodgson SE, Young DC, Kunz AL, Malhotra PS, Fritz MA, Schuller DE. Hypothyroidism after treatment for nonthyroid head and neck cancer. Archives of otolaryngology--head & neck surgery 2000; 126:652-657
  24. Sklar C, Whitton J, Mertens A, Stovall M, Green D, Marina N, Greffe B, Wolden S, Robison L. Abnormalities of the thyroid in survivors of Hodgkin's disease: data from the Childhood Cancer Survivor Study. The Journal of clinical endocrinology and metabolism 2000; 85:3227-3232
  25. Schmiegelow M, Feldt-Rasmussen U, Rasmussen AK, Poulsen HS, Muller J. A population-based study of thyroid function after radiotherapy and chemotherapy for a childhood brain tumor. JClinEndocrinolMetab 2003; 88:136-140
  26. Colao A, Pivonello R, Faggiano A, Filippella M, Ferone D, Di Somma C, Cerbone G, Marzullo P, Fenzi G, Lombardi G. Increased prevalence of thyroid autoimmunity in patients successfully treated for Cushing's disease. Clinical endocrinology 2000; 53:13-19
  27. Niepomniszcze H, Pitoia F, Katz SB, Chervin R, Bruno OD. Primary thyroid disorders in endogenous Cushing's syndrome. European journal of endocrinology 2002; 147:305-311
  28. Erickson AR, Enzenauer RJ, Nordstrom DM, Merenich JA. The prevalence of hypothyroidism in gout. The American journal of medicine 1994; 97:231-234
  29. Eheman CR, Garbe P, Tuttle RM. Autoimmune thyroid disease associated with environmental thyroidal irradiation. Thyroid 2003; 13:453-464
  30. Agate L, Mariotti S, Elisei R, Mossa P, Pacini F, Molinaro E, Grasso L, Masserini L, Mokhort T, Vorontsova T, Arynchyn A, Tronko MD, Tsyb A, Feldt-Rasmussen U, Juul A, Pinchera A. Thyroid autoantibodies and thyroid function in subjects exposed to Chernobyl fallout during childhood: evidence for a transient radiation-induced elevation of serum thyroid antibodies without an increase in thyroid autoimmune disease. The Journal of clinical endocrinology and metabolism 2008; 93:2729-2736
  31. Zervas A, Katopodi A, Protonotariou A, Livadas S, Karagiorga M, Politis C, Tolis G. Assessment of thyroid function in two hundred patients with beta-thalassemia major. Thyroid 2002; 12:151-154
  32. Chu JW, Kao PN, Faul JL, Doyle RL. High prevalence of autoimmune thyroid disease in pulmonary arterial hypertension. Chest 2002; 122:1668-1673
  33. Janssen OE, Mehlmauer N, Hahn S, Offner AH, Gartner R. High prevalence of autoimmune thyroiditis in patients with polycystic ovary syndrome. European journal of endocrinology 2004; 150:363-369
  34. Rotondi M, Leporati P, La Manna A, Pirali B, Mondello T, Fonte R, Magri F, Chiovato L. Raised serum TSH levels in patients with morbid obesity: is it enough to diagnose subclinical hypothyroidism? European journal of endocrinology 2009; 160:403-408
  35. Rasmusson B, Feldt-Rasmussen U, Hegedus L, Perrild H, Bech K, Hoier-Madsen M. Thyroid function in patients with breast cancer. European journal of cancer & clinical oncology 1987; 23:553-556
  36. Giustarini E, Pinchera A, Fierabracci P, Roncella M, Fustaino L, Mammoli C, Giani C. Thyroid autoimmunity in patients with malignant and benign breast diseases before surgery. European journal of endocrinology 2006; 154:645-649
  37. Antonelli A, Ferri C, Fallahi P, Ferrari SM, Ghinoi A, Rotondi M, Ferrannini E. Thyroid disorders in chronic hepatitis C virus infection. Thyroid 2006; 16:563-572
  38. Goday-Arno A, Cerda-Esteva M, Flores-Le-Roux JA, Chillaron-Jordan JJ, Corretger JM, Cano-Perez JF. Hyperthyroidism in a population with Down syndrome (DS). Clinical endocrinology 2009; 71:110-114
  39. Elsheikh M, Wass JA, Conway GS. Autoimmune thyroid syndrome in women with Turner's syndrome--the association with karyotype. Clinical endocrinology 2001; 55:223-226
  40. Garrahy A, Sherlock M, Thompson CJ. MANAGEMENT OF ENDOCRINE DISEASE: Neuroendocrine surveillance and management of neurosurgical patients. EurJEndocrinol 2017; 176:R217-R233
  41. Schneider HJ, Kreitschmann-Andermahr I, Ghigo E, Stalla GK, Agha A. Hypothalamopituitary dysfunction following traumatic brain injury and aneurysmal subarachnoid hemorrhage: a systematic review. JAMA 2007; 298:1429-1438
  42. Klose M, Feldt-Rasmussen U. Chronic endocrine consequences of traumatic brain injury - what is the evidence? NatRevEndocrinol 2018; 14:57-62
  43. Rooman RP, Du Caju MV, De Beeck LO, Docx M, Van Reempts P, Van Acker KJ. Low thyroxinaemia occurs in the majority of very preterm newborns. European journal of pediatrics 1996; 155:211-215
  44. Fisher DA. The hypothyroxinemia [corrected] of prematurity. The Journal of clinical endocrinology and metabolism 1997; 82:1701-1703
  45. Feldt-Rasmussen U, Rasmussen AK. Drug effects and thyroid function. In: Huhtaniemi I, ed. Encyclopedia of Endocrine Diseases. 2nd ed: Academic Press; 2018.
  46. Figaro MK, Clayton W, Jr., Usoh C, Brown K, Kassim A, Lakhani VT, Jagasia S. Thyroid abnormalities in patients treated with lenalidomide for hematological malignancies: results of a retrospective case review. American journal of hematology 2011; 86:467-470
  47. Clement SC, Schoot RA, Slater O, Chisholm JC, Abela C, Balm AJM, van den Brekel MW, Breunis WB, Chang YC, Davila Fajardo R, Dunaway D, Gajdosova E, Gaze MN, Gupta S, Hartley B, Kremer LCM, van Lennep M, Levitt GA, Mandeville HC, Pieters BR, Saeed P, Smeele LE, Strackee SD, Ronckers CM, Caron HN, van Santen HM, Merks JHM. Endocrine disorders among long-term survivors of childhood head and neck rhabdomyosarcoma. European journal of cancer (Oxford, England : 1990) 2016; 54:1-10
  48. Jarlov AE, Nygaard B, Hegedus L, Hartling SG, Hansen JM. Observer variation in the clinical and laboratory evaluation of patients with thyroid dysfunction and goiter. Thyroid 1998; 8:393-398
  49. Zulewski H, Muller B, Exer P, Miserez AR, Staub JJ. Estimation of tissue hypothyroidism by a new clinical score: evaluation of patients with various grades of hypothyroidism and controls. JClinEndocrinolMetab 1997; 82:771-776
  50. Boelaert K, Torlinska B, Holder RL, Franklyn JA. Older subjects with hyperthyroidism present with a paucity of symptoms and signs: a large cross-sectional study. The Journal of clinical endocrinology and metabolism 2010; 95:2715-2726
  51. Toubert ME, Chevret S, Cassinat B, Schlageter MH, Beressi JP, Rain JD. From guidelines to hospital practice: reducing inappropriate ordering of thyroid hormone and antibody tests. European journal of endocrinology 2000; 142:605-610
  52. Schectman JM, Elinsky EG, Pawlson LG. Effect of education and feedback on thyroid function testing strategies of primary care clinicians. Archives of internal medicine 1991; 151:2163-2166
  53. Lopez-Achigar E, Collazo C, Blanco R, Raymondo S. Suporting the cost-effectiveness of a thyroid testing algorithm. Clinica chimica acta; international journal of clinical chemistry 2000; 296:213-215
  54. Sheehan MT. Biochemical Testing of the Thyroid: TSH is the Best and, Oftentimes, Only Test Needed - A Review for Primary Care. Clinical medicine & research 2016; 14:83-92
  55. McDermott MT, Ridgway EC. Subclinical hypothyroidism is mild thyroid failure and should be treated. The Journal of clinical endocrinology and metabolism 2001; 86:4585-4590
  56. Biondi B. Natural history, diagnosis and management of subclinical thyroid dysfunction. Best practice & research Clinical endocrinology & metabolism 2012; 26:431-446
  57. Nicoloff JT, Spencer CA. Clinical review 12: The use and misuse of the sensitive thyrotropin assays. The Journal of clinical endocrinology and metabolism 1990; 71:553-558
  58. Ercan-Fang S, Schwartz HL, Mariash CN, Oppenheimer JH. Quantitative assessment of pituitary resistance to thyroid hormone from plots of the logarithm of thyrotropin versus serum free thyroxine index. The Journal of clinical endocrinology and metabolism 2000; 85:2299-2303
  59. Spencer CA, LoPresti JS, Patel A, Guttler RB, Eigen A, Shen D, Gray D, Nicoloff JT. Applications of a new chemiluminometric thyrotropin assay to subnormal measurement. The Journal of clinical endocrinology and metabolism 1990; 70:453-460
  60. Hershman JM, Pekary AE, Berg L, Solomon DH, Sawin CT. Serum thyrotropin and thyroid hormone levels in elderly and middle-aged euthyroid persons. Journal of the American Geriatrics Society 1993; 41:823-828
  61. Morley JE. Neuroendocrine control of thyrotropin secretion. Endocrine reviews 1981; 2:396-436
  62. Vanderpump MP, Tunbridge WM, French JM, Appleton D, Bates D, Clark F, Grimley EJ, Hasan DM, Rodgers H, Tunbridge F. The incidence of thyroid disorders in the community: a twenty-year follow-up of the Whickham Survey. ClinEndocrinol(Oxf) 1995; 43:55-68
  63. Hollowell JG, Staehling NW, Flanders WD, Hannon WH, Gunter EW, Spencer CA, Braverman LE. Serum TSH, T(4), and thyroid antibodies in the United States population (1988 to 1994): National Health and Nutrition Examination Survey (NHANES III). The Journal of clinical endocrinology and metabolism 2002; 87:489-499
  64. Canaris GJ, Manowitz NR, Mayor G, Ridgway EC. The Colorado thyroid disease prevalence study. Archives of internal medicine 2000; 160:526-534
  65. Kung AW, Janus ED. Thyroid dysfunction in ambulatory elderly Chinese subjects in an area of borderline iodine intake. Thyroid 1996; 6:111-114
  66. Szabolcs I, Podoba J, Feldkamp J, Dohan O, Farkas I, Sajgo M, Takats KI, Goth M, Kovacs L, Kressinszky K, Hnilica P, Szilagyi G. Comparative screening for thyroid disorders in old age in areas of iodine deficiency, long-term iodine prophylaxis and abundant iodine intake. Clinical endocrinology 1997; 47:87-92
  67. Aghini-Lombardi F, Antonangeli L, Martino E, Vitti P, Maccherini D, Leoli F, Rago T, Grasso L, Valeriano R, Balestrieri A, Pinchera A. The spectrum of thyroid disorders in an iodine-deficient community: the Pescopagano survey. The Journal of clinical endocrinology and metabolism 1999; 84:561-566
  68. Knudsen N, Bulow I, Jorgensen T, Laurberg P, Ovesen L, Perrild H. Comparative study of thyroid function and types of thyroid dysfunction in two areas in Denmark with slightly different iodine status. European journal of endocrinology 2000; 143:485-491
  69. Laurberg P, Pedersen KM, Hreidarsson A, Sigfusson N, Iversen E, Knudsen PR. Iodine intake and the pattern of thyroid disorders: a comparative epidemiological study of thyroid abnormalities in the elderly in Iceland and in Jutland, Denmark. The Journal of clinical endocrinology and metabolism 1998; 83:765-769
  70. Gharib H, Tuttle RM, Baskin HJ, Fish LH, Singer PA, McDermott MT. Subclinical thyroid dysfunction: a joint statement on management from the American Association of Clinical Endocrinologists, the American Thyroid Association, and the Endocrine Society. The Journal of clinical endocrinology and metabolism 2005; 90:581-585; discussion 586-587
  71. Surks MI, Ortiz E, Daniels GH, Sawin CT, Col NF, Cobin RH, Franklyn JA, Hershman JM, Burman KD, Denke MA, Gorman C, Cooper RS, Weissman NJ. Subclinical thyroid disease: scientific review and guidelines for diagnosis and management. Jama 2004; 291:228-238
  72. Wartofsky L, Dickey RA. The evidence for a narrower thyrotropin reference range is compelling. The Journal of clinical endocrinology and metabolism 2005; 90:5483-5488
  73. Klein I, Ojamaa K. Thyroid hormone and the cardiovascular system. NEnglJMed 2001; 344:501-509
  74. Faber J, Jensen IW, Petersen L, Nygaard B, Hegedus L, Siersbaek-Nielsen K. Normalization of serum thyrotrophin by means of radioiodine treatment in subclinical hyperthyroidism: effect on bone loss in postmenopausal women. Clinical endocrinology 1998; 48:285-290
  75. Rosario PW, Calsolari MR. How selective are the new guidelines for treatment of subclinical hypothyroidism for patients with thyrotropin levels at or below 10 mIU/L? Thyroid 2013; 23:562-565
  76. Kahaly GJ. Cardiovascular and atherogenic aspects of subclinical hypothyroidism. Thyroid 2000; 10:665-679
  77. Bauer DC, Rodondi N, Stone KL, Hillier TA. Thyroid hormone use, hyperthyroidism and mortality in older women. The American journal of medicine 2007; 120:343-349
  78. Parle JV, Maisonneuve P, Sheppard MC, Boyle P, Franklyn JA. Prediction of all-cause and cardiovascular mortality in elderly people from one low serum thyrotropin result: a 10-year cohort study. Lancet 2001; 358:861-865
  79. Flynn RW, Bonellie SR, Jung RT, MacDonald TM, Morris AD, Leese GP. Serum thyroid-stimulating hormone concentration and morbidity from cardiovascular disease and fractures in patients on long-term thyroxine therapy. The Journal of clinical endocrinology and metabolism 2010; 95:186-193
  80. Razvi S, Weaver JU, Vanderpump MP, Pearce SH. The incidence of ischemic heart disease and mortality in people with subclinical hypothyroidism: reanalysis of the Whickham Survey cohort. The Journal of clinical endocrinology and metabolism 2010; 95:1734-1740
  81. Martin FI, Tress BW, Colman PG, Deam DR. Iodine-induced hyperthyroidism due to nonionic contrast radiography in the elderly. The American journal of medicine 1993; 95:78-82
  82. Sawin CT, Geller A, Wolf PA, Belanger AJ, Baker E, Bacharach P, Wilson PW, Benjamin EJ, D'Agostino RB. Low serum thyrotropin concentrations as a risk factor for atrial fibrillation in older persons. The New England journal of medicine 1994; 331:1249-1252
  83. Biondi B, Fazio S, Carella C, Amato G, Cittadini A, Lupoli G, Sacca L, Bellastella A, Lombardi G. Cardiac effects of long term thyrotropin-suppressive therapy with levothyroxine. The Journal of clinical endocrinology and metabolism 1993; 77:334-338
  84. Wesche MF, Tiel VBMM, Lips P, Smits NJ, Wiersinga WM. A randomized trial comparing levothyroxine with radioactive iodine in the treatment of sporadic nontoxic goiter. The Journal of clinical endocrinology and metabolism 2001; 86:998-1005
  85. Bauer DC, Ettinger B, Nevitt MC, Stone KL. Risk for fracture in women with low serum levels of thyroid-stimulating hormone. Annals of internal medicine 2001; 134:561-568
  86. Stott DJ, McLellan AR, Finlayson J, Chu P, Alexander WD. Elderly patients with suppressed serum TSH but normal free thyroid hormone levels usually have mild thyroid overactivity and are at increased risk of developing overt hyperthyroidism. The Quarterly journal of medicine 1991; 78:77-84
  87. Parle JV, Franklyn JA, Cross KW, Jones SC, Sheppard MC. Prevalence and follow-up of abnormal thyrotrophin (TSH) concentrations in the elderly in the United Kingdom. Clinical endocrinology 1991; 34:77-83
  88. Nystrom E, Caidahl K, Fager G, Wikkelso C, Lundberg PA, Lindstedt G. A double-blind cross-over 12-month study of L-thyroxine treatment of women with 'subclinical' hypothyroidism. Clinical endocrinology 1988; 29:63-75
  89. Huber G, Staub JJ, Meier C, Mitrache C, Guglielmetti M, Huber P, Braverman LE. Prospective study of the spontaneous course of subclinical hypothyroidism: prognostic value of thyrotropin, thyroid reserve, and thyroid antibodies. The Journal of clinical endocrinology and metabolism 2002; 87:3221-3226
  90. Hak AE, Pols HA, Visser TJ, Drexhage HA, Hofman A, Witteman JC. Subclinical hypothyroidism is an independent risk factor for atherosclerosis and myocardial infarction in elderly women: the Rotterdam Study. Annals of internal medicine 2000; 132:270-278
  91. Rodondi N, Newman AB, Vittinghoff E, de Rekeneire N, Satterfield S, Harris TB, Bauer DC. Subclinical hypothyroidism and the risk of heart failure, other cardiovascular events, and death. Archives of internal medicine 2005; 165:2460-2466
  92. Volzke H, Schwahn C, Wallaschofski H, Dorr M. Review: The association of thyroid dysfunction with all-cause and circulatory mortality: is there a causal relationship? The Journal of clinical endocrinology and metabolism 2007; 92:2421-2429
  93. Rodondi N, Aujesky D, Vittinghoff E, Cornuz J, Bauer DC. Subclinical hypothyroidism and the risk of coronary heart disease: a meta-analysis. The American journal of medicine 2006; 119:541-551
  94. Cappola AR, Fried LP, Arnold AM, Danese MD, Kuller LH, Burke GL, Tracy RP, Ladenson PW. Thyroid status, cardiovascular risk, and mortality in older adults. Jama 2006; 295:1033-1041
  95. Lekakis J, Papamichael C, Alevizaki M, Piperingos G, Marafelia P, Mantzos J, Stamatelopoulos S, Koutras DA. Flow-mediated, endothelium-dependent vasodilation is impaired in subjects with hypothyroidism, borderline hypothyroidism, and high-normal serum thyrotropin (TSH) values. Thyroid 1997; 7:411-414
  96. Nagasaki T, Inaba M, Yamada S, Shirakawa K, Nagata Y, Kumeda Y, Hiura Y, Tahara H, Ishimura E, Nishizawa Y. Decrease of brachial-ankle pulse wave velocity in female subclinical hypothyroid patients during normalization of thyroid function: a double-blind, placebo-controlled study. European journal of endocrinology 2009; 160:409-415
  97. Owen PJ, Rajiv C, Vinereanu D, Mathew T, Fraser AG, Lazarus JH. Subclinical hypothyroidism, arterial stiffness, and myocardial reserve. The Journal of clinical endocrinology and metabolism 2006; 91:2126-2132
  98. Monzani F, Di Bello V, Caraccio N, Bertini A, Giorgi D, Giusti C, Ferrannini E. Effect of levothyroxine on cardiac function and structure in subclinical hypothyroidism: a double blind, placebo-controlled study. The Journal of clinical endocrinology and metabolism 2001; 86:1110-1115
  99. Danese MD, Ladenson PW, Meinert CL, Powe NR. Clinical review 115: effect of thyroxine therapy on serum lipoproteins in patients with mild thyroid failure: a quantitative review of the literature. The Journal of clinical endocrinology and metabolism 2000; 85:2993-3001
  100. Meier C, Staub JJ, Roth CB, Guglielmetti M, Kunz M, Miserez AR, Drewe J, Huber P, Herzog R, Muller B. TSH-controlled L-thyroxine therapy reduces cholesterol levels and clinical symptoms in subclinical hypothyroidism: a double blind, placebo-controlled trial (Basel Thyroid Study). The Journal of clinical endocrinology and metabolism 2001; 86:4860-4866
  101. Haggerty JJ, Jr., Stern RA, Mason GA, Beckwith J, Morey CE, Prange AJ, Jr. Subclinical hypothyroidism: a modifiable risk factor for depression? The American journal of psychiatry 1993; 150:508-510
  102. Chadarevian R, Bruckert E, Leenhardt L, Giral P, Ankri A, Turpin G. Components of the fibrinolytic system are differently altered in moderate and severe hypothyroidism. The Journal of clinical endocrinology and metabolism 2001; 86:732-737
  103. Meyerovitch J, Rotman-Pikielny P, Sherf M, Battat E, Levy Y, Surks MI. Serum thyrotropin measurements in the community: five-year follow-up in a large network of primary care physicians. Archives of internal medicine 2007; 167:1533-1538
  104. Woeber KA. Observations concerning the natural history of subclinical hyperthyroidism. Thyroid 2005; 15:687-691
  105. Zhyzhneuskaya S, Addison C, Tsatlidis V, Weaver JU, Razvi S. The Natural History of Subclinical Hyperthyroidism in Graves' Disease: The Rule of Thirds. Thyroid 2016; 26:765-769
  106. Abdul Shakoor SA, Hawkins R, Kua SY, Ching ME, Dalan R. Natural history and comorbidities of subjects with subclinical hyperthyroidism: analysis at a tertiary hospital setting. Annals of the Academy of Medicine, Singapore 2014; 43:506-510
  107. Effraimidis G, Strieder TG, Tijssen JG, Wiersinga WM. Natural history of the transition from euthyroidism to overt autoimmune hypo- or hyperthyroidism: a prospective study. European journal of endocrinology 2011; 164:107-113
  108. Faber J, Selmer C. Cardiovascular disease and thyroid function. Frontiers of hormone research 2014; 43:45-56
  109. Benjamin EJ, Wolf PA, D'Agostino RB, Silbershatz H, Kannel WB, Levy D. Impact of atrial fibrillation on the risk of death: the Framingham Heart Study. Circulation 1998; 98:946-952
  110. Collet TH, Gussekloo J, Bauer DC, den Elzen WP, Cappola AR, Balmer P, Iervasi G, Asvold BO, Sgarbi JA, Volzke H, Gencer B, Maciel RM, Molinaro S, Bremner A, Luben RN, Maisonneuve P, Cornuz J, Newman AB, Khaw KT, Westendorp RG, Franklyn JA, Vittinghoff E, Walsh JP, Rodondi N. Subclinical hyperthyroidism and the risk of coronary heart disease and mortality. ArchInternMed 2012; 172:799-809
  111. Sun J, Yao L, Fang Y, Yang R, Chen Y, Yang K, Tian L. Relationship between Subclinical Thyroid Dysfunction and the Risk of Cardiovascular Outcomes: A Systematic Review and Meta-Analysis of Prospective Cohort Studies. International journal of endocrinology 2017; 2017:8130796
  112. Baumgartner C, da Costa BR, Collet TH, Feller M, Floriani C, Bauer DC, Cappola AR, Heckbert SR, Ceresini G, Gussekloo J, den Elzen WPJ, Peeters RP, Luben R, Volzke H, Dorr M, Walsh JP, Bremner A, Iacoviello M, Macfarlane P, Heeringa J, Stott DJ, Westendorp RGJ, Khaw KT, Magnani JW, Aujesky D, Rodondi N. Thyroid Function Within the Normal Range, Subclinical Hypothyroidism, and the Risk of Atrial Fibrillation. Circulation 2017; 136:2100-2116
  113. Biondi B, Fazio S, Cuocolo A, Sabatini D, Nicolai E, Lombardi G, Salvatore M, Sacca L. Impaired cardiac reserve and exercise capacity in patients receiving long-term thyrotropin suppressive therapy with levothyroxine. The Journal of clinical endocrinology and metabolism 1996; 81:4224-4228
  114. Dunn JT, Semigran MJ, Delange F. The prevention and management of iodine-induced hyperthyroidism and its cardiac features. Thyroid 1998; 8:101-106
  115. Iakovou I, Zapandiotis A, Mpalaris V, Goulis DG. Radio-contrast agent-induced hyperthyroidism: case report and review of the literature. Archives of endocrinology and metabolism 2016; 60:287-289
  116. Basaria S, Cooper DS. Amiodarone and the thyroid. The American journal of medicine 2005; 118:706-714
  117. Ross DS. Hyperthyroidism, thyroid hormone therapy, and bone. Thyroid 1994; 4:319-326
  118. Ding B, Zhang Y, Li Q, Hu Y, Tao XJ, Liu BL, Ma JH, Li DM. Low Thyroid Stimulating Hormone Levels Are Associated with Low Bone Mineral Density in Femoral Neck in Elderly Women. Archives of medical research 2016; 47:310-314
  119. Tunbridge WM, Evered DC, Hall R, Appleton D, Brewis M, Clark F, Evans JG, Young E, Bird T, Smith PA. The spectrum of thyroid disease in a community: the Whickham survey. Clinical endocrinology 1977; 7:481-493
  120. Diez JJ, Iglesias P, Burman KD. Spontaneous normalization of thyrotropin concentrations in patients with subclinical hypothyroidism. The Journal of clinical endocrinology and metabolism 2005; 90:4124-4127
  121. Somwaru LL, Rariy CM, Arnold AM, Cappola AR. The natural history of subclinical hypothyroidism in the elderly: the cardiovascular health study. The Journal of clinical endocrinology and metabolism 2012; 97:1962-1969
  122. Rosario PW, Carvalho M, Calsolari MR. Natural history of subclinical hypothyroidism with TSH </=10 mIU/l: a prospective study. Clinical endocrinology 2016; 84:878-881
  123. Li X, Zhen D, Zhao M, Liu L, Guan Q, Zhang H, Ge S, Tang X, Gao L. Natural history of mild subclinical hypothyroidism in a middle-aged and elderly Chinese population: a prospective study. Endocrine journal 2017; 64:437-447
  124. Kim H, Kim TH, Kim HI, Park SY, Kim YN, Kim S, Kim MJ, Jin SM, Hur KY, Kim JH, Lee MK, Min YK, Chung JH, Kang M, Kim SW. Subclinical thyroid dysfunction and risk of carotid atherosclerosis. PloS one 2017; 12:e0182090
  125. Yao K, Zhao T, Zeng L, Yang J, Liu Y, He Q, Zou X. Non-invasive markers of cardiovascular risk in patients with subclinical hypothyroidism: A systematic review and meta-analysis of 27 case control studies. Scientific reports 2018; 8:4579
  126. Kim SK, Kim SH, Park KS, Park SW, Cho YW. Regression of the increased common carotid artery-intima media thickness in subclinical hypothyroidism after thyroid hormone replacement. Endocrine journal 2009; 56:753-758
  127. Monzani F, Caraccio N, Kozakowa M, Dardano A, Vittone F, Virdis A, Taddei S, Palombo C, Ferrannini E. Effect of levothyroxine replacement on lipid profile and intima-media thickness in subclinical hypothyroidism: a double-blind, placebo- controlled study. The Journal of clinical endocrinology and metabolism 2004; 89:2099-2106
  128. Clausen P, Mersebach H, Nielsen B, Feldt-Rasmussen B, Feldt-Rasmussen U. Hypothyroidism is associated with signs of endothelial dysfunction despite 1-year replacement therapy with levothyroxine. ClinEndocrinol(Oxf) 2009; 70:932-937
  129. Adrees M, Gibney J, El-Saeity N, Boran G. Effects of 18 months of L-T4 replacement in women with subclinical hypothyroidism. Clinical endocrinology 2009; 71:298-303
  130. Blum MR, Gencer B, Adam L, Feller M, Collet TH, da Costa BR, Moutzouri E, Dopheide J, Depairon M, Sykiotis GP, Kearney P, Gussekloo J, Westendorp R, Stott DJ, Bauer DC, Rodondi N. Impact of Thyroid Hormone Therapy on Atherosclerosis in the Elderly With Subclinical Hypothyroidism: A Randomized Trial. The Journal of clinical endocrinology and metabolism 2018; 103:2988-2997
  131. Aziz M, Kandimalla Y, Machavarapu A, Saxena A, Das S, Younus A, Nguyen M, Malik R, Anugula D, Latif MA, Humayun C, Khan IM, Adus A, Rasool A, Veledar E, Nasir K. Effect of Thyroxin Treatment on Carotid Intima-Media Thickness (CIMT) Reduction in Patients with Subclinical Hypothyroidism (SCH): a Meta-Analysis of Clinical Trials. Journal of atherosclerosis and thrombosis 2017; 24:643-659
  132. Zhao T, Chen B, Zhou Y, Wang X, Zhang Y, Wang H, Shan Z. Effect of levothyroxine on the progression of carotid intima-media thickness in subclinical hypothyroidism patients: a meta-analysis. BMJ open 2017; 7:e016053
  133. Friis T, Pedersen LR. Serum lipids in hyper- and hypothyroidism before and after treatment. ClinChimActa 1987; 162:155-163
  134. Delitala AP, Fanciulli G, Maioli M, Delitala G. Subclinical hypothyroidism, lipid metabolism and cardiovascular disease. European journal of internal medicine 2017; 38:17-24
  135. Franklyn JA. Metabolic changes in hypothyroidism. In: Braverman LE, Utiger RG, eds. The Thyroid. Philadelphia: Lippincott, Williams & Wilkens; 2000:833-836.
  136. Thompson GR, Soutar AK, Spengel FA, Jadhav A, Gavigan SJ, Myant NB. Defects of receptor-mediated low density lipoprotein catabolism in homozygous familial hypercholesterolemia and hypothyroidism in vivo. Proceedings of the National Academy of Sciences of the United States of America 1981; 78:2591-2595
  137. Asvold BO, Vatten LJ, Nilsen TI, Bjoro T. The association between TSH within the reference range and serum lipid concentrations in a population-based study. The HUNT Study. European journal of endocrinology 2007; 156:181-186
  138. Waterhouse DF, McLaughlin AM, Walsh CD, Sheehan F, O'Shea D. An examination of the relationship between normal range thyrotropin and cardiovascular risk parameters: a study in healthy women. Thyroid 2007; 17:243-248
  139. de Bruin TW, van Barlingen H, van Linde-Sibenius Trip M, van Vuurst de Vries AR, Akveld MJ, Erkelens DW. Lipoprotein(a) and apolipoprotein B plasma concentrations in hypothyroid, euthyroid, and hyperthyroid subjects. The Journal of clinical endocrinology and metabolism 1993; 76:121-126
  140. Tzotzas T, Krassas GE, Konstantinidis T, Bougoulia M. Changes in lipoprotein(a) levels in overt and subclinical hypothyroidism before and during treatment. Thyroid 2000; 10:803-808
  141. Klausen IC, Nielsen FE, Hegedus L, Gerdes LU, Charles P, Faergeman O. Treatment of hypothyroidism reduces low-density lipoproteins but not lipoprotein(a). Metabolism: clinical and experimental 1992; 41:911-914
  142. Arem R, Escalante DA, Arem N, Morrisett JD, Patsch W. Effect of L-thyroxine therapy on lipoprotein fractions in overt and subclinical hypothyroidism, with special reference to lipoprotein(a). Metabolism: clinical and experimental 1995; 44:1559-1563
  143. Adamarczuk-Janczyszyn M, Zdrojowy-Welna A, Rogala N, Zatonska K, Bednarek-Tupikowska G. Evaluation of Selected Atherosclerosis Risk Factors in Women with Subclinical Hypothyroidism Treated with L-Thyroxine. Advances in clinical and experimental medicine : official organ Wroclaw Medical University 2016; 25:457-463
  144. Biondi B, Kahaly GJ. Heart in Hypothyroidism. In: Luster M, Duntas L, Wartofsky L, eds. The Thyroid and Its Diseases. A Comprehensive Guide for the Clinician. : Springer International Publishing AG, part of Springer Nature; 2019:129-160.
  145. Karabulut A, Dogan A, Tuzcu AK. Myocardial Performance Index for Patients with Overt and Subclinical Hypothyroidism. Medical science monitor : international medical journal of experimental and clinical research 2017; 23:2519-2526
  146. Yao Z, Gao X, Liu M, Chen Z, Yang N, Jia YM, Feng XM, Xu Y, Yang XC, Wang G. Diffuse Myocardial Injuries are Present in Subclinical Hypothyroidism: A Clinical Study Using Myocardial T1-mapping Quantification. Scientific reports 2018; 8:4999
  147. Bakker SJ, ter Maaten JC, Popp-Snijders C, Slaets JP, Heine RJ, Gans RO. The relationship between thyrotropin and low density lipoprotein cholesterol is modified by insulin sensitivity in healthy euthyroid subjects. The Journal of clinical endocrinology and metabolism 2001; 86:1206-1211
  148. Roos A, Bakker SJ, Links TP, Gans RO, Wolffenbuttel BH. Thyroid function is associated with components of the metabolic syndrome in euthyroid subjects. The Journal of clinical endocrinology and metabolism 2007; 92:491-496
  149. Uzunlulu M, Yorulmaz E, Oguz A. Prevalence of subclinical hypothyroidism in patients with metabolic syndrome. Endocrine journal 2007; 54:71-76
  150. Iacobellis G, Ribaudo MC, Zappaterreno A, Iannucci CV, Leonetti F. Relationship of thyroid function with body mass index, leptin, insulin sensitivity and adiponectin in euthyroid obese women. Clinical endocrinology 2005; 62:487-491
  151. Knudsen N, Laurberg P, Rasmussen LB, Bulow I, Perrild H, Ovesen L, Jorgensen T. Small differences in thyroid function may be important for body mass index and the occurrence of obesity in the population. The Journal of clinical endocrinology and metabolism 2005; 90:4019-4024
  152. Posadas-Romero C, Jorge-Galarza E, Posadas-Sanchez R, Acuna-Valerio J, Juarez-Rojas JG, Kimura-Hayama E, Medina-Urrutia A, Cardoso-Saldana GC. Fatty liver largely explains associations of subclinical hypothyroidism with insulin resistance, metabolic syndrome, and subclinical coronary atherosclerosis. European journal of endocrinology 2014; 171:319-325
  153. Pergialiotis V, Konstantopoulos P, Prodromidou A, Florou V, Papantoniou N, Perrea DN. MANAGEMENT OF ENDOCRINE DISEASE: The impact of subclinical hypothyroidism on anthropometric characteristics, lipid, glucose and hormonal profile of PCOS patients: a systematic review and meta-analysis. European journal of endocrinology 2017; 176:R159-r166
  154. Franca MM, Nogueira CR, Hueb JC, Mendes AL, Padovani CR, Mazeto GM. Higher Carotid Intima-Media Thickness in Subclinical Hypothyroidism Associated with the Metabolic Syndrome. Metabolic syndrome and related disorders 2016; 14:381-385
  155. Bonora BM, Fadini GP. Subclinical Hypothyroidism and Metabolic Syndrome: A Common Association by Chance or a Cardiovascular Risk Driver? Metabolic syndrome and related disorders 2016; 14:378-380
  156. Cheserek MJ, Wu G, Shen L, Shi Y, Le G. Evaluation of the relationship between subclinical hypothyroidism and metabolic syndrome components among workers. International journal of occupational medicine and environmental health 2014; 27:175-187
  157. Monzani F, Del Guerra P, Caraccio N, Pruneti CA, Pucci E, Luisi M, Baschieri L. Subclinical hypothyroidism: neurobehavioral features and beneficial effect of L-thyroxine treatment. The Clinical investigator 1993; 71:367-371
  158. Bell RJ, Rivera-Woll L, Davison SL, Topliss DJ, Donath S, Davis SR. Well-being, health-related quality of life and cardiovascular disease risk profile in women with subclinical thyroid disease - a community-based study. Clinical endocrinology 2007; 66:548-556
  159. Jorde R, Waterloo K, Storhaug H, Nyrnes A, Sundsfjord J, Jenssen TG. Neuropsychological function and symptoms in subjects with subclinical hypothyroidism and the effect of thyroxine treatment. The Journal of clinical endocrinology and metabolism 2006; 91:145-153
  160. Stott DJ, Rodondi N, Kearney PM, Ford I, Westendorp RGJ, Mooijaart SP, Sattar N, Aubert CE, Aujesky D, Bauer DC, Baumgartner C, Blum MR, Browne JP, Byrne S, Collet TH, Dekkers OM, den Elzen WPJ, Du Puy RS, Ellis G, Feller M, Floriani C, Hendry K, Hurley C, Jukema JW, Kean S, Kelly M, Krebs D, Langhorne P, McCarthy G, McCarthy V, McConnachie A, McDade M, Messow M, O'Flynn A, O'Riordan D, Poortvliet RKE, Quinn TJ, Russell A, Sinnott C, Smit JWA, Van Dorland HA, Walsh KA, Walsh EK, Watt T, Wilson R, Gussekloo J. Thyroid Hormone Therapy for Older Adults with Subclinical Hypothyroidism. The New England journal of medicine 2017; 376:2534-2544
  161. Cerbone M, Bravaccio C, Capalbo D, Polizzi M, Wasniewska M, Cioffi D, Improda N, Valenzise M, Bruzzese D, De Luca F, Salerno M. Linear growth and intellectual outcome in children with long-term idiopathic subclinical hypothyroidism. European journal of endocrinology 2011; 164:591-597
  162. Monzani A, Prodam F, Rapa A, Moia S, Agarla V, Bellone S, Bona G. Endocrine disorders in childhood and adolescence. Natural history of subclinical hypothyroidism in children and adolescents and potential effects of replacement therapy: a review. European journal of endocrinology 2013; 168:R1-r11
  163. Aversa T, Valenzise M, Corrias A, Salerno M, De Luca F, Mussa A, Rezzuto M, Lombardo F, Wasniewska M. Underlying Hashimoto's thyroiditis negatively affects the evolution of subclinical hypothyroidism in children irrespective of other concomitant risk factors. Thyroid 2015; 25:183-187
  164. Feldt-Rasmussen U, Emerson CH. Further thoughts on the diagnosis and diagnostic criteria for thyroid storm. Thyroid 2012; 22:1094-1095
  165. Salomo LH, Laursen AH, Reiter N, Feldt-Rasmussen U. Myxoedema coma: an almost forgotten, yet still existing cause of multiorgan failure. BMJ CaseRep 2014; 2014
  166. Weetman AP. Hypothyroidism: screening and subclinical disease. BMJ 1997; 314:1175-1178
  167. Hennessey JV, Espaillat R. Diagnosis and Management of Subclinical Hypothyroidism in Elderly Adults: A Review of the Literature. Journal of the American Geriatrics Society 2015; 63:1663-1673
  168. Pearce SH, Brabant G, Duntas LH, Monzani F, Peeters RP, Razvi S, Wemeau JL. 2013 ETA Guideline: Management of Subclinical Hypothyroidism. European thyroid journal 2013; 2:215-228
  169. Pearce SH, Vaisman M, Wemeau JL. Management of subclinical hypothyroidism: the thyroidologists' view. European thyroid journal 2012; 1:45-50
  170. Pandrc MS, Ristic A, Kostovski V, Stankovic M, Antic V, Milin-Lazovic J, Ciric J. The Effect of Early Substitution of Subclinical Hypothyroidism on Biochemical Blood Parameters and the Quality of Life. Journal of medical biochemistry 2017; 36:127-136
  171. Wartofsky L, Handelsman DJ. Standardization of hormonal assays for the 21st century. The Journal of clinical endocrinology and metabolism 2010; 95:5141-5143
  172. Feldt-Rasmussen U, Hyltoft PP, Blaabjerg O, Horder M. Long-term variability in serum thyroglobulin and thyroid related hormones in healthy subjects. Acta Endocrinol(Copenh) 1980; 95:328-334
  173. Andersen S, Pedersen KM, Bruun NH, Laurberg P. Narrow individual variations in serum T(4) and T(3) in normal subjects: a clue to the understanding of subclinical thyroid disease. JClinEndocrinolMetab 2002; 87:1068-1072
  174. Brabant G, Beck-Peccoz P, Jarzab B, Laurberg P, Orgiazzi J, Szabolcs I, Weetman AP, Wiersinga WM. Is there a need to redefine the upper normal limit of TSH? European journal of endocrinology 2006; 154:633-637
  175. Surks MI, Goswami G, Daniels GH. The thyrotropin reference range should remain unchanged. The Journal of clinical endocrinology and metabolism 2005; 90:5489-5496
  176. Hamilton TE, Davis S, Onstad L, Kopecky KJ. Thyrotropin levels in a population with no clinical, autoantibody, or ultrasonographic evidence of thyroid disease: implications for the diagnosis of subclinical hypothyroidism. The Journal of clinical endocrinology and metabolism 2008; 93:1224-1230
  177. Spencer CA, Hollowell JG, Kazarosyan M, Braverman LE. National Health and Nutrition Examination Survey III thyroid-stimulating hormone (TSH)-thyroperoxidase antibody relationships demonstrate that TSH upper reference limits may be skewed by occult thyroid dysfunction. The Journal of clinical endocrinology and metabolism 2007; 92:4236-4240
  178. Baloch Z, Carayon P, Conte-Devolx B, Demers LM, Feldt-Rasmussen U, Henry JF, LiVosli VA, Niccoli-Sire P, John R, Ruf J, Smyth PP, Spencer CA, Stockigt JR. Laboratory medicine practice guidelines. Laboratory support for the diagnosis and monitoring of thyroid disease. Thyroid 2003; 13:3-126
  179. Surks MI, Boucai L. Age- and race-based serum thyrotropin reference limits. The Journal of clinical endocrinology and metabolism 2010; 95:496-502
  180. Cooper DS. Subclinical thyroid disease: consensus or conundrum? Clinical endocrinology 2004; 60:410-412
  181. Lazarus JH. Aspects of treatment of subclinical hypothyroidism. Thyroid 2007; 17:313-316
  182. Nordyke RA, Reppun TS, Madanay LD, Woods JC, Goldstein AP, Miyamoto LA. Alternative sequences of thyrotropin and free thyroxine assays for routine thyroid function testing. Quality and cost. Archives of internal medicine 1998; 158:266-272
  183. Wardle CA, Fraser WD, Squire CR. Pitfalls in the use of thyrotropin concentration as a first-line thyroid-function test. Lancet 2001; 357:1013-1014
  184. Beckett GJ, Toft AD. First-line thyroid function tests -- TSH alone is not enough. ClinEndocrinol(Oxf) 2003; 58:20-21
  185. Feldt-Rasmussen U, Klose M. Central hypothyroidism and its role for cardiovascular risk factors in hypopituitary patients. Endocrine 2016; 54:15-23
  186. Persani L, Brabant G, Dattani M, Bonomi M, Feldt-Rasmussen U, Fliers E, Gruters A, Maiter D, Schoenmakers N, van Trotsenburg AS. 2018 European Thyroid Association (ETA) Guidelines on the Diagnosis and Management of Central Hypothyroidism. European thyroid journal 2018;
  187. Surks MI, Sievert R. Drugs and thyroid function. The New England journal of medicine 1995; 333:1688-1694
  188. Borst GC, Osburne RC, O'Brian JT, Georges LP, Burman KD. Fasting decreases thyrotropin responsiveness to thyrotropin-releasing hormone: a potential cause of misinterpretation of thyroid function tests in the critically ill. The Journal of clinical endocrinology and metabolism 1983; 57:380-383
  189. Hamblin PS, Dyer SA, Mohr VS, Le Grand BA, Lim CF, Tuxen DV, Topliss DJ, Stockigt JR. Relationship between thyrotropin and thyroxine changes during recovery from severe hypothyroxinemia of critical illness. The Journal of clinical endocrinology and metabolism 1986; 62:717-722
  190. Van den Berghe G. Non-thyroidal illness in the ICU: a syndrome with different faces. Thyroid 2014; 24:1456-1465
  191. Van den Berghe G. The 2016 ESPEN Sir David Cuthbertson lecture: Interfering with neuroendocrine and metabolic responses to critical illness: From acute to long-term consequences. Clinical nutrition (Edinburgh, Scotland) 2017; 36:348-354
  192. Spencer C, Eigen A, Shen D, Duda M, Qualls S, Weiss S, Nicoloff J. Specificity of sensitive assays of thyrotropin (TSH) used to screen for thyroid disease in hospitalized patients. Clinical chemistry 1987; 33:1391-1396
  193. Stockigt JR. Free thyroid hormone measurement. A critical appraisal. Endocrinology and metabolism clinics of North America 2001; 30:265-289
  194. Stockigt JR. Guidelines for diagnosis and monitoring of thyroid disease: nonthyroidal illness. Clinical chemistry 1996; 42:188-192
  195. Hein MD, Jackson IM. Review: thyroid function in psychiatric illness. General hospital psychiatry 1990; 12:232-244
  196. White AJ, Barraclough B. Thyroid disease and mental illness: a study of thyroid disease in psychiatric admissions. Journal of psychosomatic research 1988; 32:99-106
  197. Tikhonoff V, Hardy R, Deanfield J, Friberg P, Muniz G, Kuh D, Pariante CM, Hotopf M, Richards M. The relationship between affective symptoms and hypertension-role of the labelling effect: the 1946 British birth cohort. Open heart 2016; 3:e000341
  198. Hyltoft Petersen P, Klee GG. Influence of analytical bias and imprecision on the number of false positive results using Guideline-Driven Medical Decision Limits. Clinica chimica acta; international journal of clinical chemistry 2014; 430:1-8
  199. Meier C, Trittibach P, Guglielmetti M, Staub JJ, Muller B. Serum thyroid stimulating hormone in assessment of severity of tissue hypothyroidism in patients with overt primary thyroid failure: cross sectional survey. Bmj 2003; 326:311-312
  200. Hoermann R, Eckl W, Hoermann C, Larisch R. Complex relationship between free thyroxine and TSH in the regulation of thyroid function. European journal of endocrinology 2010; 162:1123-1129
  201. Fitzgerald SP, Bean NG. The Relationship between Population T4/TSH Set Point Data and T4/TSH Physiology. Journal of thyroid research 2016; 2016:6351473
  202. Brown SJ, Bremner AP, Hadlow NC, Feddema P, Leedman PJ, O'Leary PC, Walsh JP. The log TSH-free T4 relationship in a community-based cohort is nonlinear and is influenced by age, smoking and thyroid peroxidase antibody status. Clinical endocrinology 2016; 85:789-796
  203. Hadlow NC, Rothacker KM, Wardrop R, Brown SJ, Lim EM, Walsh JP. The relationship between TSH and free T(4) in a large population is complex and nonlinear and differs by age and sex. The Journal of clinical endocrinology and metabolism 2013; 98:2936-2943
  204. Roelfsema F, Pereira AM, Adriaanse R, Endert E, Fliers E, Romijn JA, Veldhuis JD. Thyrotropin secretion in mild and severe primary hypothyroidism is distinguished by amplified burst mass and Basal secretion with increased spikiness and approximate entropy. The Journal of clinical endocrinology and metabolism 2010; 95:928-934
  205. Snyder PJ, Utiger RD. Inhibition of thyrotropin response to thyrotropin-releasing hormone by small quantities of thyroid hormones. The Journal of clinical investigation 1972; 51:2077-2084
  206. Vagenakis AG, Rapoport B, Azizi F, Portnay GI, Braverman LE, Ingbar SH. Hyperresponse to thyrotropin-releasing hormone accompanying small decreases in serum thyroid hormone concentrations. The Journal of clinical investigation 1974; 54:913-918
  207. Meier CA, Maisey MN, Lowry A, Muller J, Smith MA. Interindividual differences in the pituitary-thyroid axis influence the interpretation of thyroid function tests. Clinical endocrinology 1993; 39:101-107
  208. Meikle AW, Stringham JD, Woodward MG, Nelson JC. Hereditary and environmental influences on the variation of thyroid hormones in normal male twins. The Journal of clinical endocrinology and metabolism 1988; 66:588-592
  209. Hansen PS, Brix TH, Sorensen TI, Kyvik KO, Hegedus L. Major genetic influence on the regulation of the pituitary-thyroid axis: a study of healthy Danish twins. The Journal of clinical endocrinology and metabolism 2004; 89:1181-1187
  210. Panicker V, Wilson SG, Spector TD, Brown SJ, Falchi M, Richards JB, Surdulescu GL, Lim EM, Fletcher SJ, Walsh JP. Heritability of serum TSH, free T4 and free T3 concentrations: a study of a large UK twin cohort. ClinEndocrinol(Oxf) 2008; 68:652-659
  211. Medici M, Visser TJ, Peeters RP. Genetics of thyroid function. Best practice & research Clinical endocrinology & metabolism 2017; 31:129-142
  212. Medici M, Visser WE, Visser TJ, Peeters RP. Genetic determination of the hypothalamic-pituitary-thyroid axis: where do we stand? Endocrine reviews 2015; 36:214-244
  213. Medici M, van der Deure WM, Verbiest M, Vermeulen SH, Hansen PS, Kiemeney LA, Hermus AR, Breteler MM, Hofman A, Hegedus L, Kyvik KO, den Heijer M, Uitterlinden AG, Visser TJ, Peeters RP. A large-scale association analysis of 68 thyroid hormone pathway genes with serum TSH and FT4 levels. European journal of endocrinology 2011; 164:781-788
  214. Eisenberg MC, Santini F, Marsili A, Pinchera A, DiStefano JJ, 3rd. TSH regulation dynamics in central and extreme primary hypothyroidism. Thyroid 2010; 20:1215-1228
  215. Lewis GF, Alessi CA, Imperial JG, Refetoff S. Low serum free thyroxine index in ambulating elderly is due to a resetting of the threshold of thyrotropin feedback suppression. The Journal of clinical endocrinology and metabolism 1991; 73:843-849
  216. Carle A, Laurberg P, Pedersen IB, Perrild H, Ovesen L, Rasmussen LB, Jorgensen T, Knudsen N. Age modifies the pituitary TSH response to thyroid failure. Thyroid 2007; 17:139-144
  217. Kempers MJ, van Trotsenburg AS, van Tijn DA, Bakker E, Wiedijk BM, Endert E, de Vijlder JJ, Vulsma T. Disturbance of the fetal thyroid hormone state has long-term consequences for treatment of thyroidal and central congenital hypothyroidism. The Journal of clinical endocrinology and metabolism 2005; 90:4094-4100
  218. Fischer HR, Hackeng WH, Schopman W, Silberbusch J. Analysis of factors in hyperthyroidism, which determine the duration of suppressive treatment before recovery of thyroid stimulating hormone secretion. Clinical endocrinology 1982; 16:575-585
  219. Orgiazzi J. Anti-TSH receptor antibodies in clinical practice. Endocrinology and metabolism clinics of North America 2000; 29:339-355, vii
  220. Pekary AE, Jackson IM, Goodwin TM, Pang XP, Hein MD, Hershman JM. Increased in vitro thyrotropic activity of partially sialated human chorionic gonadotropin extracted from hydatidiform moles of patients with hyperthyroidism. The Journal of clinical endocrinology and metabolism 1993; 76:70-74
  221. Brenta G, Schnitman M, Fretes O, Facco E, Gurfinkel M, Damilano S, Pacenza N, Blanco A, Gonzalez E, Pisarev MA. Comparative efficacy and side effects of the treatment of euthyroid goiter with levo-thyroxine or triiodothyroacetic acid. The Journal of clinical endocrinology and metabolism 2003; 88:5287-5292
  222. Ladenson PW. Thyroid hormone analogues: ready for prime time. Thyroid 2011; 21:101-102
  223. Re RN, Kourides IA, Ridgway EC, Weintraub BD, Maloof F. The effect of glucocorticoid administration on human pituitary secretion of thyrotropin and prolactin. The Journal of clinical endocrinology and metabolism 1976; 43:338-346
  224. Van den Berghe G, de Zegher F, Lauwers P. Dopamine and the sick euthyroid syndrome in critical illness. Clinical endocrinology 1994; 41:731-737
  225. Sato T, Suzuki Y, Taketani T, Ishiguro K, Nakajima H. Age-related change in pituitary threshold for TSH release during thyroxine replacement therapy for cretinism. The Journal of clinical endocrinology and metabolism 1977; 44:553-559
  226. Van Sande J, Parma J, Tonacchera M, Swillens S, Dumont J, Vassart G. Somatic and germline mutations of the TSH receptor gene in thyroid diseases. The Journal of clinical endocrinology and metabolism 1995; 80:2577-2585
  227. Refetoff S, Dumitrescu AM. Syndromes of reduced sensitivity to thyroid hormone: genetic defects in hormone receptors, cell transporters and deiodination. Best practice & research Clinical endocrinology & metabolism 2007; 21:277-305
  228. Smith PJ, Surks MI. Multiple effects of 5,5'-diphenylhydantoin on the thyroid hormone system. Endocrine reviews 1984; 5:514-524
  229. Bonomi M, Proverbio MC, Weber G, Chiumello G, Beck-Peccoz P, Persani L. Hyperplastic pituitary gland, high serum glycoprotein hormone alpha-subunit, and variable circulating thyrotropin (TSH) levels as hallmark of central hypothyroidism due to mutations of the TSH beta gene. The Journal of clinical endocrinology and metabolism 2001; 86:1600-1604
  230. Oliveira JH, Persani L, Beck-Peccoz P, Abucham J. Investigating the paradox of hypothyroidism and increased serum thyrotropin (TSH) levels in Sheehan's syndrome: characterization of TSH carbohydrate content and bioactivity. JClinEndocrinolMetab 2001; 86:1694-1699
  231. Bjerner J, Nustad K, Norum LF, Olsen KH, Bormer OP. Immunometric assay interference: incidence and prevention. Clinical chemistry 2002; 48:613-621
  232. Monchamp T, Chopra IJ, Wah DT, Butch AW. Falsely elevated thyroid hormone levels due to anti-sheep antibody interference in an automated electrochemiluminescent immunoassay. Thyroid 2007; 17:271-275
  233. Stockigt JR. Thyroid hormone binding and variants of transport proteins. In: DeGroot L, L. JJ, eds. Endocrinology. 6th ed. Philadelphia: Saunders; 2010:392-402.
  234. Sakata S, Nakamura S, Miura K. Autoantibodies against thyroid hormones or iodothyronine. Implications in diagnosis, thyroid function, treatment, and pathogenesis. Annals of internal medicine 1985; 103:579-589
  235. Stockigt JR, Lim CF. Medications that distort in vitro tests of thyroid function, with particular reference to estimates of serum free thyroxine. Best practice & research Clinical endocrinology & metabolism 2009; 23:753-767
  236. Mendel CM, Frost PH, Kunitake ST, Cavalieri RR. Mechanism of the heparin-induced increase in the concentration of free thyroxine in plasma. The Journal of clinical endocrinology and metabolism 1987; 65:1259-1264
  237. Jaume JC, Mendel CM, Frost PH, Greenspan FS, Laughton CW. Extremely low doses of heparin release lipase activity into the plasma and can thereby cause artifactual elevations in the serum-free thyroxine concentration as measured by equilibrium dialysis. Thyroid 1996; 6:79-83
  238. Spencer CA, Takeuchi M, Kazarosyan M. Current status and performance goals for serum thyrotropin (TSH) assays. Clinical chemistry 1996; 42:140-145
  239. Verheecke P. Free triiodothyronine concentration in serum of 1050 euthyroid children is inversely related to their age. Clinical chemistry 1997; 43:963-967
  240. Mariotti S, Barbesino G, Caturegli P, Bartalena L, Sansoni P, Fagnoni F, Monti D, Fagiolo U, Franceschi C, Pinchera A. Complex alteration of thyroid function in healthy centenarians. The Journal of clinical endocrinology and metabolism 1993; 77:1130-1134
  241. Kim B. Thyroid hormone as a determinant of energy expenditure and the basal metabolic rate. Thyroid 2008; 18:141-144
  242. Thaler MA, Seifert-Klauss V, Luppa PB. The biomarker sex hormone-binding globulin - from established applications to emerging trends in clinical medicine. Best practice & research Clinical endocrinology & metabolism 2015; 29:749-760
  243. Gronhagen-Riska C, Fyhrquist F, Valimaki M, Lamberg BA. Thyroid hormones affect serum angiotensin I converting enzyme levels. Acta medica Scandinavica 1985; 217:259-264
  244. Stockigt JR, Stevens V, White EL, Barlow JW. "Unbound analog" radioimmunoassays for free thyroxin measure the albumin-bound hormone fraction. Clinical chemistry 1983; 29:1408-1410
  245. Surks MI, DeFesi CR. Normal serum free thyroid hormone concentrations in patients treated with phenytoin or carbamazepine. A paradox resolved. Jama 1996; 275:1495-1498
  246. Beck-Peccoz P, Romelli PB, Cattaneo MG, Faglia G, White EL, Barlow JW, Stockigt JR. Evaluation of free thyroxine methods in the presence of iodothyronine-binding autoantibodies. The Journal of clinical endocrinology and metabolism 1984; 58:736-739
  247. Despres N, Grant AM. Antibody interference in thyroid assays: a potential for clinical misinformation. Clinical chemistry 1998; 44:440-454
  248. Norden AG, Jackson RA, Norden LE, Griffin AJ, Barnes MA, Little JA. Misleading results from immunoassays of serum free thyroxine in the presence of rheumatoid factor. Clinical chemistry 1997; 43:957-962
  249. Beck-Peccoz P, Persani L. Variable biological activity of thyroid-stimulating hormone. EurJEndocrinol 1994; 131:331-340
  250. Beck-Peccoz P, Brucker-Davis F, Persani L, Smallridge RC, Weintraub BD. Thyrotropin-secreting pituitary tumors. Endocrine reviews 1996; 17:610-638
  251. Ekins R. Measurement of free hormones in blood. Endocrine reviews 1990; 11:5-46
  252. Grebe S. Laboratory testing in thyroid disorders. In: Luster M, Duntas L, Wartofsky L, eds. The Thyroid and Its Diseases. A Comprehensive Guide for the Clinician: Springer International Publishing AG, part of Springer Nature; 2019:129-160.
  253. Braverman LE. Evaluation of thyroid status in patients with thyrotoxicosis. Clinical chemistry 1996; 42:174-178
  254. Martino E, Bartalena L, Bogazzi F, Braverman LE. The effects of amiodarone on the thyroid. Endocrine reviews 2001; 22:240-254
  255. Bartalena L, Bogazzi F, Chiovato L, Hubalewska-Dydejczyk A, Links TP, Vanderpump M. 2018 European Thyroid Association (ETA) Guidelines for the Management of Amiodarone-Associated Thyroid Dysfunction. European thyroid journal 2018; 7:55-66
  256. Dalan R, Kon W, K LM. Phenotypic expression and challenges of a distinct form of thyrotoxicosis. Triiodothyronine-predominant Graves’ disease – aggressive, refractory and anything but banal. The Endocrinologist 2008; 18:90-94
  257. Takamatsu J, Hosoya T, Naito N, Yoshimura H, Kohno Y, Tarutani O, Kuma K, Sakane S, Takeda K, Mozai T. Enhanced thyroid iodine metabolism in patients with triiodothyronine-predominant Graves' disease. The Journal of clinical endocrinology and metabolism 1988; 66:147-152
  258. Takamatsu J, Kuma K, Mozai T. Serum triiodothyronine to thyroxine ratio: a newly recognized predictor of the outcome of hyperthyroidism due to Graves' disease. The Journal of clinical endocrinology and metabolism 1986; 62:980-983
  259. Sobrinho LG, Limbert ES, Santos MA. Thyroxine toxicosis in patients with iodine induced thyrotoxicosis. The Journal of clinical endocrinology and metabolism 1977; 45:25-29
  260. Amino N, Yabu Y, Miki T, Morimoto S, Kumahara Y, Mori H, Iwatani Y, Nishi K, Nakatani K, Miyai K. Serum ratio of triiodothyronine to thyroxine, and thyroxine-binding globulin and calcitonin concentrations in Graves' disease and destruction-induced thyrotoxicosis. The Journal of clinical endocrinology and metabolism 1981; 53:113-116
  261. Spencer CA, Schwarzbein D, Guttler RB, LoPresti JS, Nicoloff JT. Thyrotropin (TSH)-releasing hormone stimulation test responses employing third and fourth generation TSH assays. The Journal of clinical endocrinology and metabolism 1993; 76:494-498
  262. Hartoft-Nielsen ML, Lange M, Rasmussen AK, Scherer S, Zimmermann-Belsing T, Feldt-Rasmussen U. Thyrotropin-releasing hormone stimulation test in patients with pituitary pathology. HormRes 2004; 61:53-57
  263. Laurberg P. Persistent problems with the specificity of immunometric TSH assays. Thyroid 1993; 3:279-283
  264. Feldt-Rasmussen U. Serum thyroglobulin and thyroglobulin autoantibodies in thyroid diseases. Pathogenic and diagnostic aspects. Allergy 1983; 38:369-387
  265. Schlumberger M, Hitzel A, Toubert ME, Corone C, Troalen F, Schlageter MH, Claustrat F, Koscielny S, Taieb D, Toubeau M, Bonichon F, Borson-Chazot F, Leenhardt L, Schvartz C, Dejax C, Brenot-Rossi I, Torlontano M, Tenenbaum F, Bardet S, Bussiere F, Girard JJ, Morel O, Schneegans O, Schlienger JL, Prost A, So D, Archambeaud F, Ricard M, Benhamou E. Comparison of seven serum thyroglobulin assays in the follow-up of papillary and follicular thyroid cancer patients. The Journal of clinical endocrinology and metabolism 2007; 92:2487-2495
  266. Mazzaferri EL, Kloos RT. Clinical review 128: Current approaches to primary therapy for papillary and follicular thyroid cancer. The Journal of clinical endocrinology and metabolism 2001; 86:1447-1463
  267. Pelttari H, Valimaki MJ, Loyttyniemi E, Schalin-Jantti C. Post-ablative serum thyroglobulin is an independent predictor of recurrence in low-risk differentiated thyroid carcinoma: a 16-year follow-up study. European journal of endocrinology 2010; 163:757-763
  268. Giovanella L, Feldt-Rasmussen U, Verburg FA, Grebe SK, Plebani M, Clark PM. Thyroglobulin measurement by highly sensitive assays: focus on laboratory challenges. Clinical chemistry and laboratory medicine 2015; 53:1301-1314
  269. Giovanella L, Clark PM, Chiovato L, Duntas L, Elisei R, Feldt-Rasmussen U, Leenhardt L, Luster M, Schalin-Jantti C, Schott M, Seregni E, Rimmele H, Smit J, Verburg FA. Thyroglobulin measurement using highly sensitive assays in patients with differentiated thyroid cancer: a clinical position paper. European journal of endocrinology 2014; 171:R33-46
  270. Cohen JH, 3rd, Ingbar SH, Braverman LE. Thyrotoxicosis due to ingestion of excess thyroid hormone. Endocrine reviews 1989; 10:113-124
  271. Pacini F, Fugazzola L, Lippi F, Ceccarelli C, Centoni R, Miccoli P, Elisei R, Pinchera A. Detection of thyroglobulin in fine needle aspirates of nonthyroidal neck masses: a clue to the diagnosis of metastatic differentiated thyroid cancer. The Journal of clinical endocrinology and metabolism 1992; 74:1401-1404
  272. Kim MJ, Kim EK, Kim BM, Kwak JY, Lee EJ, Park CS, Cheong WY, Nam KH. Thyroglobulin measurement in fine-needle aspirate washouts: the criteria for neck node dissection for patients with thyroid cancer. Clinical endocrinology 2009; 70:145-151
  273. Knudsen N, Bulow I, Jorgensen T, Perrild H, Ovesen L, Laurberg P. Serum Tg--a sensitive marker of thyroid abnormalities and iodine deficiency in epidemiological studies. The Journal of clinical endocrinology and metabolism 2001; 86:3599-3603
  274. Verburg FA, Luster M, Cupini C, Chiovato L, Duntas L, Elisei R, Feldt-Rasmussen U, Rimmele H, Seregni E, Smit JW, Theimer C, Giovanella L. Implications of thyroglobulin antibody positivity in patients with differentiated thyroid cancer: a clinical position statement. Thyroid 2013; 23:1211-1225
  275. Feldt-Rasmussen U, Giovanella L. Thyroglobulin and Tg antibodies. In: Luster M, Duntas L, Wartofsky L, eds. The Thyroid and Its Diseases. A Comprehensive Guide for the Clinician: Springer International Publishing AG, part of Springer Nature; 2019:655-672.
  276. Feldt-Rasmussen U, Verburg FA, Luster M, Cupini C, Chiovato L, Duntas L, Elisei R, Rimmele H, Seregni E, Smit JW, Theimer C, Giovanella L. Thyroglobulin autoantibodies as surrogate biomarkers in the management of patients with differentiated thyroid carcinoma. Current medicinal chemistry 2014; 21:3687-3692
  277. Feldt-Rasmussen U, Rasmussen AK. Serum thyroglobulin (Tg) in presence of thyroglobulin autoantibodies (TgAb). Clinical and methodological relevance of the interaction between Tg and TgAb in vitro and in vivo. Journal of endocrinological investigation 1985; 8:571-576
  278. Bliddal S, Boas M, Hilsted L, Friis-Hansen L, Juul A, Larsen T, Tabor A, Faber J, Precht DH, Feldt-Rasmussen U. Increase in thyroglobulin antibody and thyroid peroxidase antibody levels, but not preterm birth-rate, in pregnant Danish women upon iodine fortification. European journal of endocrinology 2017; 176:603-612
  279. Feldt-Rasmussen U. Analytical and clinical performance goals for testing autoantibodies to thyroperoxidase, thyroglobulin, and thyrotropin receptor. Clinical chemistry 1996; 42:160-163
  280. Vanderpump MP, Tunbridge WM, French JM, Appleton D, Bates D, Clark F, Grimley Evans J, Hasan DM, Rodgers H, Tunbridge F, et al. The incidence of thyroid disorders in the community: a twenty-year follow-up of the Whickham Survey. Clinical endocrinology 1995; 43:55-68
  281. Costagliola S, Morgenthaler NG, Hoermann R, Badenhoop K, Struck J, Freitag D, Poertl S, Weglohner W, Hollidt JM, Quadbeck B, Dumont JE, Schumm-Draeger PM, Bergmann A, Mann K, Vassart G, Usadel KH. Second generation assay for thyrotropin receptor antibodies has superior diagnostic sensitivity for Graves' disease. The Journal of clinical endocrinology and metabolism 1999; 84:90-97
  282. Schott M, Hermsen D, Broecker-Preuss M, Casati M, Mas JC, Eckstein A, Gassner D, Golla R, Graeber C, van Helden J, Inomata K, Jarausch J, Kratzsch J, Miyazaki N, Moreno MA, Murakami T, Roth HJ, Stock W, Noh JY, Scherbaum WA, Mann K. Clinical value of the first automated TSH receptor autoantibody assay for the diagnosis of Graves' disease (GD): an international multicentre trial. Clinical endocrinology 2009; 71:566-573
  283. Laurberg P, Nygaard B, Glinoer D, Grussendorf M, Orgiazzi J. Guidelines for TSH-receptor antibody measurements in pregnancy: results of an evidence-based symposium organized by the European Thyroid Association. European journal of endocrinology 1998; 139:584-586
  284. Kahaly GJ, Bartalena L, Hegedüs L, Leenhardt L, Poppe K, Pearce SH. 2018 European Thyroid Association Guideline for the Management of Graves’ Hyperthyroidism. European thyroid journal 2018:167–186
  285. Hesarghatta Shyamasunder A, Abraham P. Measuring TSH receptor antibody to influence treatment choices in Graves' disease. Clinical endocrinology 2017; 86:652-657
  286. Massart C, Gibassier J, d'Herbomez M. Clinical value of M22-based assays for TSH-receptor antibody (TRAb) in the follow-up of antithyroid drug treated Graves' disease: comparison with the second generation human TRAb assay. Clinica chimica acta; international journal of clinical chemistry 2009; 407:62-66
  287. Barbesino G, Tomer Y. Clinical review: Clinical utility of TSH receptor antibodies. The Journal of clinical endocrinology and metabolism 2013; 98:2247-2255
  288. Dumitrescu AM, Korwutthikulrangsri M, Refetoff S. Impaired sensitivity to thyroid hormone: defects of transport, metabolism, and action. In: Braverman LE, Cooper DS, Kopp P, eds. Werner and Ingbar's the thyroid: a fundamental and clinical text. 11th ed. Philadelphia: Lippincott, Williams & Wilkins; 2020:868-907.
  289. Burmeister LA. Reverse T3 does not reliably differentiate hypothyroid sick syndrome from euthyroid sick syndrome. Thyroid 1995; 5:435-441
  290. Roti E, Uberti ED. Iodine excess and hyperthyroidism. Thyroid 2001; 11:493-500
  291. Weber C, Scholz GH, Lamesch P, Paschke R. Thyroidectomy in iodine induced thyrotoxic storm. Experimental and clinical endocrinology & diabetes : official journal, German Society of Endocrinology [and] German Diabetes Association 1999; 107:468-472
  292. O'Connell R, Parkin L, Manning P, Bell D, Herbison P, Holmes J. A cluster of thyrotoxicosis associated with consumption of a soy milk product. Australian and New Zealand journal of public health 2005; 29:511-512
  293. Vejbjerg P, Knudsen N, Perrild H, Laurberg P, Andersen S, Rasmussen LB, Ovesen L, Jorgensen T. Estimation of iodine intake from various urinary iodine measurements in population studies. Thyroid 2009; 19:1281-1286
  294. Carle A, Andersen SL, Boelaert K, Laurberg P. MANAGEMENT OF ENDOCRINE DISEASE: Subclinical thyrotoxicosis: prevalence, causes and choice of therapy. European journal of endocrinology 2017; 176:R325-r337
  295. Karmisholt J, Andersen S, Laurberg P. Interval between tests and thyroxine estimation method influence outcome of monitoring of subclinical hypothyroidism. The Journal of clinical endocrinology and metabolism 2008; 93:1634-1640
  296. Hollander CS, Mitsuma T, Nihei N, Shenkman L, Burday SZ, Blum M. Clinical and laboratory observations in cases of triiodothyronine toxicosis confirmed by radioimmunoassay. Lancet 1972; 1:609-611
  297. Sterling K, Refetoff S, Selenkow HA. T3 thyrotoxicosis. Thyrotoxicosis due to elevated serum triiodothyronine levels. Jama 1970; 213:571-575
  298. Lum SM, Kaptein EM, Nicoloff JT. Influence of nonthyroidal illnesses on serum thyroid hormone indices in hyperthyroidism. The Western journal of medicine 1983; 138:670-675
  299. Inada M, Sterling K. Thyroxine transport in thyrotoxicosis and hypothyroidism. The Journal of clinical investigation 1967; 46:1442-1450
  300. Nauman JA, Nauman A, Werner SC. Total and free triiodothyronine in human serum. The Journal of clinical investigation 1967; 46:1346-1355
  301. Homsanit M, Sriussadaporn S, Vannasaeng S, Peerapatdit T, Nitiyanant W, Vichayanrat A. Efficacy of single daily dosage of methimazole vs. propylthiouracil in the induction of euthyroidism. Clinical endocrinology 2001; 54:385-390
  302. Davies PH, Franklyn JA, Daykin J, Sheppard MC. The significance of TSH values measured in a sensitive assay in the follow-up of hyperthyroid patients treated with radioiodine. The Journal of clinical endocrinology and metabolism 1992; 74:1189-1194
  303. Ross DS, Burch HB, Cooper DS, Greenlee MC, Laurberg P, Maia AL, Rivkees SA, Samuels M, Sosa JA, Stan MN, Walter MA. 2016 American Thyroid Association Guidelines for Diagnosis and Management of Hyperthyroidism and Other Causes of Thyrotoxicosis. Thyroid 2016; 26:1343-1421
  304. Biondi B, Bartalena L, Cooper DS, Hegedus L, Laurberg P, Kahaly GJ. The 2015 European Thyroid Association Guidelines on Diagnosis and Treatment of Endogenous Subclinical Hyperthyroidism. European thyroid journal 2015; 4:149-163
  305. Persani L, Brabant G, Dattani M, Bonomi M, Feldt-Rasmussen U, Fliers E, Gruters A, Maiter D, Schoenmakers N, van Trotsenburg ASP. 2018 European Thyroid Association (ETA) Guidelines on the Diagnosis and Management of Central Hypothyroidism. European thyroid journal 2018; 7:225-237
  306. Ross DS, Daniels GH, Gouveia D. The use and limitations of a chemiluminescent thyrotropin assay as a single thyroid function test in an out-patient endocrine clinic. The Journal of clinical endocrinology and metabolism 1990; 71:764-769
  307. Fish LH, Schwartz HL, Cavanaugh J, Steffes MW, Bantle JP, Oppenheimer JH. Replacement dose, metabolism, and bioavailability of levothyroxine in the treatment of hypothyroidism. Role of triiodothyronine in pituitary feedback in humans. The New England journal of medicine 1987; 316:764-770
  308. Shimon I, Cohen O, Lubetsky A, Olchovsky D. Thyrotropin suppression by thyroid hormone replacement is correlated with thyroxine level normalization in central hypothyroidism. Thyroid 2002; 12:823-827
  309. Ferretti E, Persani L, Jaffrain-Rea ML, Giambona S, Tamburrano G, Beck-Peccoz P. Evaluation of the adequacy of levothyroxine replacement therapy in patients with central hypothyroidism. JClinEndocrinolMetab 1999; 84:924-929
  310. Ain KB, Pucino F, Shiver TM, Banks SM. Thyroid hormone levels affected by time of blood sampling in thyroxine-treated patients. Thyroid 1993; 3:81-85
  311. Centanni M, Gargano L, Canettieri G, Viceconti N, Franchi A, Delle Fave G, Annibale B. Thyroxine in goiter, Helicobacter pylori infection, and chronic gastritis. The New England journal of medicine 2006; 354:1787-1795
  312. Ianiro G, Mangiola F, Di Rienzo TA, Bibbo S, Franceschi F, Greco AV, Gasbarrini A. Levothyroxine absorption in health and disease, and new therapeutic perspectives. European review for medical and pharmacological sciences 2014; 18:451-456
  313. Mersebach H, Rasmussen AK, Kirkegaard L, Feldt-Rasmussen U. Intestinal adsorption of levothyroxine by antacids and laxatives: case stories and in vitro experiments. Pharmacology & toxicology 1999; 84:107-109
  314. Singh N, Weisler SL, Hershman JM. The acute effect of calcium carbonate on the intestinal absorption of levothyroxine. Thyroid 2001; 11:967-971
  315. Benvenga S, Bartolone L, Pappalardo MA, Russo A, Lapa D, Giorgianni G, Saraceno G, Trimarchi F. Altered intestinal absorption of L-thyroxine caused by coffee. Thyroid 2008; 18:293-301
  316. Haugen BR, Alexander EK, Bible KC, Doherty GM, Mandel SJ, Nikiforov YE, Pacini F, Randolph GW, Sawka AM, Schlumberger M, Schuff KG, Sherman SI, Sosa JA, Steward DL, Tuttle RM, Wartofsky L. 2015 American Thyroid Association Management Guidelines for Adult Patients with Thyroid Nodules and Differentiated Thyroid Cancer: The American Thyroid Association Guidelines Task Force on Thyroid Nodules and Differentiated Thyroid Cancer. Thyroid 2016; 26:1-133
  317. Bartalena L, Pinchera A. Levothyroxine suppressive therapy: harmful and useless or harmless and useful? Journal of endocrinological investigation 1994; 17:675-677
  318. Leite V. The Importance of the 2015 American Thyroid Association Guidelines for Adults with Thyroid Nodules and Differentiated Thyroid Cancer in Minimising Overdiagnosis and Overtreatment of Thyroid Carcinoma. European endocrinology 2018; 14:13-14
  319. Surks MI, Schadlow AR, Oppenheimer JH. A new radioimmunoassay for plasma L-triiodothyronine: measurements in thyroid disease and in patients maintained on hormonal replacement. The Journal of clinical investigation 1972; 51:3104-3113
  320. Larsen PR. Thyroid-pituitary interaction: feedback regulation of thyrotropin secretion by thyroid hormones. The New England journal of medicine 1982; 306:23-32
  321. Roti E, Minelli R, Gardini E, Braverman LE. The use and misuse of thyroid hormone. Endocrine reviews 1993; 14:401-423
  322. Wiersinga WM, Duntas L, Fadeyev V, Nygaard B, Vanderpump MP. 2012 ETA Guidelines: The Use of L-T4 + L-T3 in the Treatment of Hypothyroidism. European thyroid journal 2012; 1:55-71
  323. Kim BW, Bianco AC. For some, L-thyroxine replacement might not be enough: a genetic rationale. The Journal of clinical endocrinology and metabolism 2009; 94:1521-1523
  324. Panicker V, Saravanan P, Vaidya B, Evans J, Hattersley AT, Frayling TM, Dayan CM. Common variation in the DIO2 gene predicts baseline psychological well-being and response to combination thyroxine plus triiodothyronine therapy in hypothyroid patients. The Journal of clinical endocrinology and metabolism 2009; 94:1623-1629
  325. De Groot LJ. Dangerous dogmas in medicine: the nonthyroidal illness syndrome. The Journal of clinical endocrinology and metabolism 1999; 84:151-164
  326. Medici BB, la Cour JL, Michaelsson LF, Faber JO, Nygaard B. Neither Baseline nor Changes in Serum Triiodothyronine during Levothyroxine/Liothyronine Combination Therapy Predict a Positive Response to This Treatment Modality in Hypothyroid Patients with Persistent Symptoms. European thyroid journal 2017; 6:89-93
  327. Michaelsson LF, Medici BB, la Cour JL, Selmer C, Roder M, Perrild H, Knudsen N, Faber J, Nygaard B. Treating Hypothyroidism with Thyroxine/Triiodothyronine Combination Therapy in Denmark: Following Guidelines or Following Trends? European thyroid journal 2015; 4:174-180
  328. Van den Berghe G. Novel insights into the neuroendocrinology of critical illness. European journal of endocrinology 2000; 143:1-13
  329. Mebis L, Debaveye Y, Visser TJ, Van den Berghe G. Changes within the thyroid axis during the course of critical illness. Endocrinology and metabolism clinics of North America 2006; 35:807-821, x
  330. Van den Berghe G, Wouters P, Weekers F, Mohan S, Baxter RC, Veldhuis JD, Bowers CY, Bouillon R. Reactivation of pituitary hormone release and metabolic improvement by infusion of growth hormone-releasing peptide and thyrotropin-releasing hormone in patients with protracted critical illness. The Journal of clinical endocrinology and metabolism 1999; 84:1311-1323
  331. Felicetta JV, Green WL, Haas LB, Kenny MA, Sherrard DJ, Brunzell JD. Thyroid function and lipids in patients with chronic renal disease treated by hemodialysis: with comments on the "free thyroxine index". Metabolism: clinical and experimental 1979; 28:756-763
  332. Feldt-Rasmussen U. Thyroid function tests and the effects og drugs. In: Wass J, Arlt W, Semple R, eds. Oxford Textbook of Endocrinology and Diabetes. 3rd ed: Oxford University Press; 2021:346-352.
  333. John-Kalarickal J, Pearlman G, Carlson HE. New medications which decrease levothyroxine absorption. Thyroid 2007; 17:763-765
  334. Liwanpo L, Hershman JM. Conditions and drugs interfering with thyroxine absorption. Best practice & research Clinical endocrinology & metabolism 2009; 23:781-792
  335. Siraj ES, Gupta MK, Reddy SS. Raloxifene causing malabsorption of levothyroxine. Archives of internal medicine 2003; 163:1367-1370
  336. Stevenson HP, Archbold GP, Johnston P, Young IS, Sheridan B. Misleading serum free thyroxine results during low molecular weight heparin treatment. Clinical chemistry 1998; 44:1002-1007
  337. Hawkins RC. Furosemide interference in newer free thyroxine assays. Clinical chemistry 1998; 44:2550-2551
  338. Sapin R, Schlienger JL, Gasser F, Noel E, Lioure B, Grunenberger F, Goichot B, Grucker D. Intermethod discordant free thyroxine measurements in bone marrow-transplanted patients. Clinical chemistry 2000; 46:418-422
  339. Franklyn JA, Black EG, Betteridge J, Sheppard MC. Comparison of second and third generation methods for measurement of serum thyrotropin in patients with overt hyperthyroidism, patients receiving thyroxine therapy, and those with nonthyroidal illness. The Journal of clinical endocrinology and metabolism 1994; 78:1368-1371
  340. Haymart MR, Esfandiari NH, Stang MT, Sosa JA. Controversies in the Management of Low-Risk Differentiated Thyroid Cancer. Endocrine reviews 2017; 38:351-378
  341. Guimaraes V, DeGroot LJ. Moderate hypothyroidism in preparation for whole body 131I scintiscans and thyroglobulin testing. Thyroid 1996; 6:69-73
  342. Ladenson PW, Braverman LE, Mazzaferri EL, Brucker-Davis F, Cooper DS, Garber JR, Wondisford FE, Davies TF, DeGroot LJ, Daniels GH, Ross DS, Weintraub BD. Comparison of administration of recombinant human thyrotropin with withdrawal of thyroid hormone for radioactive iodine scanning in patients with thyroid carcinoma. The New England journal of medicine 1997; 337:888-896
  343. Maxon HR, 3rd, Smith HS. Radioiodine-131 in the diagnosis and treatment of metastatic well differentiated thyroid cancer. Endocrinology and metabolism clinics of North America 1990; 19:685-718
  344. Cailleux AF, Baudin E, Travagli JP, Ricard M, Schlumberger M. Is diagnostic iodine-131 scanning useful after total thyroid ablation for differentiated thyroid cancer? The Journal of clinical endocrinology and metabolism 2000; 85:175-178
  345. Wartofsky L. Management of low-risk well-differentiated thyroid cancer based only on thyroglobulin measurement after recombinant human thyrotropin. Thyroid 2002; 12:583-590
  346. Giovanella L, Avram AM, Clerc J, Hindie E, Taieb D, Verburg FA. Postoperative serum thyroglobulin and neck ultrasound to drive decisions about iodine-131 therapy in patients with differentiated thyroid carcinoma: an evidence-based strategy? European journal of nuclear medicine and molecular imaging 2018;
  347. Pacini F, Molinaro E, Castagna MG, Agate L, Elisei R, Ceccarelli C, Lippi F, Taddei D, Grasso L, Pinchera A. Recombinant human thyrotropin-stimulated serum thyroglobulin combined with neck ultrasonography has the highest sensitivity in monitoring differentiated thyroid carcinoma. The Journal of clinical endocrinology and metabolism 2003; 88:3668-3673
  348. Brassard M, Borget I, Edet-Sanson A, Giraudet AL, Mundler O, Toubeau M, Bonichon F, Borson-Chazot F, Leenhardt L, Schvartz C, Dejax C, Brenot-Rossi I, Toubert ME, Torlontano M, Benhamou E, Schlumberger M. Long-term follow-up of patients with papillary and follicular thyroid cancer: a prospective study on 715 patients. The Journal of clinical endocrinology and metabolism 2011; 96:1352-1359
  349. Sunny SS, Hephzibah J, Mathew D, Bondu JD, Shanthly N, Oommen R. Stimulated Serum Thyroglobulin Levels versus Unstimulated Serum Thyroglobulin in the Follow-up of Patients with Papillary Thyroid Carcinoma. World journal of nuclear medicine 2018; 17:41-45
  350. Spencer CA, Lopresti JS. Measuring thyroglobulin and thyroglobulin autoantibody in patients with differentiated thyroid cancer. Nature clinical practice Endocrinology & metabolism 2008; 4:223-233
  351. Spencer CA. Clinical review: Clinical utility of thyroglobulin antibody (TgAb) measurements for patients with differentiated thyroid cancers (DTC). The Journal of clinical endocrinology and metabolism 2011; 96:3615-3627
  352. Chopra IJ, Solomon DH, Huang TS. Serum thyrotropin in hospitalized psychiatric patients: evidence for hyperthyrotropinemia as measured by an ultrasensitive thyrotropin assay. Metabolism: clinical and experimental 1990; 39:538-543
  353. De Groot L, Abalovich M, Alexander EK, Amino N, Barbour L, Cobin RH, Eastman CJ, Lazarus JH, Luton D, Mandel SJ, Mestman J, Rovet J, Sullivan S. Management of thyroid dysfunction during pregnancy and postpartum: an Endocrine Society clinical practice guideline. The Journal of clinical endocrinology and metabolism 2012; 97:2543-2565
  354. Subclinical hypothyroidism in the infertile female population: a guideline. Fertility and sterility 2015; 104:545-553
  355. Patton PE, Samuels MH, Trinidad R, Caughey AB. Controversies in the management of hypothyroidism during pregnancy. Obstetrical & gynecological survey 2014; 69:346-358
  356. Vila L, Velasco I, Gonzalez S, Morales F, Sanchez E, Torrejon S, Soldevila B, Stagnaro-Green A, Puig-Domingo M. Controversies in endocrinology: On the need for universal thyroid screening in pregnant women. European journal of endocrinology 2014; 170:R17-30
  357. Korevaar TI. Evidence-Based Tightrope Walking: The 2017 Guidelines of the American Thyroid Association for the Diagnosis and Management of Thyroid Disease During Pregnancy and the Postpartum. Thyroid 2017; 27:309-311
  358. Negro R, Stagnaro-Green A. Clinical aspects of hyperthyroidism, hypothyroidism, and thyroid screening in pregnancy. Endocrine practice : official journal of the American College of Endocrinology and the American Association of Clinical Endocrinologists 2014; 20:597-607
  359. Maraka S, Singh Ospina NM, Mastorakos G, O'Keeffe DT. Subclinical Hypothyroidism in Women Planning Conception and During Pregnancy: Who Should Be Treated and How? Journal of the Endocrine Society 2018; 2:533-546
  360. Feldt-Rasmussen U, Bliddal S, Rasmussen AK, Boas M, Hilsted L, Main K. Challenges in interpretation of thyroid function tests in pregnant women with autoimmune thyroid disease. Journal of thyroid research 2011; 2011:598712
  361. Ball R, Freedman DB, Holmes JC, Midgley JE, Sheehan CP. Low-normal concentrations of free thyroxin in serum in late pregnancy: physiological fact, not technical artefact. Clinical chemistry 1989; 35:1891-1896
  362. Roti E, Gardini E, Minelli R, Bianconi L, Flisi M. Thyroid function evaluation by different commercially available free thyroid hormone measurement kits in term pregnant women and their newborns. Journal of endocrinological investigation 1991; 14:1-9
  363. Sapin R, d'Herbomez M. Free thyroxine measured by equilibrium dialysis and nine immunoassays in sera with various serum thyroxine-binding capacities. Clinical chemistry 2003; 49:1531-1535
  364. d'Herbomez M, Forzy G, Gasser F, Massart C, Beaudonnet A, Sapin R. Clinical evaluation of nine free thyroxine assays: persistent problems in particular populations. Clinical chemistry and laboratory medicine 2003; 41:942-947
  365. Lee RH, Spencer CA, Mestman JH, Miller EA, Petrovic I, Braverman LE, Goodwin TM. Free T4 immunoassays are flawed during pregnancy. American journal of obstetrics and gynecology 2009; 200:260.e261-266
  366. Feldt-Rasmussen U. Laboratory measurement of thyroid-related hormones, proteins, and autoantibodies in serum. In: Braverman LE, Cooper DS, Kopp P, eds. Werner and Ingbar's the thyroid: a fundamental and clinical text. 11th ed. Philadelphia: Lippincott, Williams & Wilkins; 2020:868-907.
  367. Bliddal S, Feldt-Rasmussen U, Boas M, Faber J, Juul A, Larsen T, Precht DH. Gestational age-specific reference ranges from different laboratories misclassify pregnant women's thyroid status: comparison of two longitudinal prospective cohort studies. European journal of endocrinology 2014; 170:329-339
  368. Welsh KJ, Soldin SJ. DIAGNOSIS OF ENDOCRINE DISEASE: How reliable are free thyroid and total T3 hormone assays? EurJEndocrinol 2016; 175:R255-R263
  369. Boas M, Forman JL, Juul A, Feldt-Rasmussen U, Skakkebaek NE, Hilsted L, Chellakooty M, Larsen T, Larsen JF, Petersen JH, Main KM. Narrow intra-individual variation of maternal thyroid function in pregnancy based on a longitudinal study on 132 women. European journal of endocrinology 2009; 161:903-910
  370. Hallengren B, Lantz M, Andreasson B, Grennert L. Pregnant women on thyroxine substitution are often dysregulated in early pregnancy. Thyroid 2009; 19:391-394
  371. Alexander EK, Marqusee E, Lawrence J, Jarolim P, Fischer GA, Larsen PR. Timing and magnitude of increases in levothyroxine requirements during pregnancy in women with hypothyroidism. The New England journal of medicine 2004; 351:241-249
  372. Chan S, Boelaert K. Optimal management of hypothyroidism, hypothyroxinaemia and euthyroid TPO antibody positivity preconception and in pregnancy. Clinical endocrinology 2015; 82:313-326
  373. Vaidya B, Anthony S, Bilous M, Shields B, Drury J, Hutchison S, Bilous R. Detection of thyroid dysfunction in early pregnancy: Universal screening or targeted high-risk case finding? The Journal of clinical endocrinology and metabolism 2007; 92:203-207
  374. Horacek J, Spitalnikova S, Dlabalova B, Malirova E, Vizda J, Svilias I, Cepkova J, Mc Grath C, Maly J. Universal screening detects two-times more thyroid disorders in early pregnancy than targeted high-risk case finding. European journal of endocrinology 2010; 163:645-650
  375. Negro R, Formoso G, Mangieri T, Pezzarossa A, Dazzi D, Hassan H. Levothyroxine treatment in euthyroid pregnant women with autoimmune thyroid disease: effects on obstetrical complications. The Journal of clinical endocrinology and metabolism 2006; 91:2587-2591
  376. Thangaratinam S, Tan A, Knox E, Kilby MD, Franklyn J, Coomarasamy A. Association between thyroid autoantibodies and miscarriage and preterm birth: meta-analysis of evidence. Bmj 2011; 342:d2616
  377. Lazarus JH. The continuing saga of postpartum thyroiditis. The Journal of clinical endocrinology and metabolism 2011; 96:614-616
  378. Stuckey BG, Yeap D, Turner SR. Thyroxine replacement during super-ovulation for in vitro fertilization: a potential gap in management? Fertility and sterility 2010; 93:2414.e2411-2413
  379. Casey BM, Dashe JS, Wells CE, McIntire DD, Leveno KJ, Cunningham FG. Subclinical hyperthyroidism and pregnancy outcomes. Obstetrics and gynecology 2006; 107:337-341
  380. Khan I, Okosieme O, Lazarus J. Antithyroid drug therapy in pregnancy: a review of guideline recommendations. Expert review of endocrinology & metabolism 2017; 12:269-278
  381. Andersen SL, Olsen J, Wu CS, Laurberg P. Birth defects after early pregnancy use of antithyroid drugs: a Danish nationwide study. The Journal of clinical endocrinology and metabolism 2013; 98:4373-4381
  382. Yang J, Yao LP, Dong MJ, Xu Q, Zhang J, Weng WW, Chen F. Clinical Characteristics and Outcomes of Propylthiouracil-Induced Antineutrophil Cytoplasmic Antibody-Associated Vasculitis in Patients with Graves' Disease: A Median 38-Month Retrospective Cohort Study from a Single Institution in China. Thyroid 2017; 27:1469-1474
  383. Akmal A, Kung J. Propylthiouracil, and methimazole, and carbimazole-related hepatotoxicity. Expert opinion on drug safety 2014; 13:1397-1406
  384. Luton D, Le Gac I, Vuillard E, Castanet M, Guibourdenche J, Noel M, Toubert ME, Leger J, Boissinot C, Schlageter MH, Garel C, Tebeka B, Oury JF, Czernichow P, Polak M. Management of Graves' disease during pregnancy: the key role of fetal thyroid gland monitoring. The Journal of clinical endocrinology and metabolism 2005; 90:6093-6098
  385. Bliddal S, Rasmussen AK, Sundberg K, Feldt-Rasmussen U. Careful assessment of maternal thyroid function can prevent cases of fetal goitrous hypothyroidism. Fetal diagnosis and therapy 2013; 34:66-67
  386. Stagnaro-Green A. Approach to the patient with postpartum thyroiditis. The Journal of clinical endocrinology and metabolism 2012; 97:334-342
  387. Feldt-Rasmussen U, Hoier-Madsen M, Rasmussen NG, Hegedus L, Hornnes P. Anti-thyroid peroxidase antibodies during pregnancy and postpartum. Relation to postpartum thyroiditis. Autoimmunity 1990; 6:211-214
  388. Pearce EN, Andersson M, Zimmermann MB. Global iodine nutrition: Where do we stand in 2013? Thyroid 2013; 23:523-528
  389. Bech K, Hoier-Madsen M, Feldt-Rasmussen U, Jensen BM, Molsted-Pedersen L, Kuhl C. Thyroid function and autoimmune manifestations in insulin-dependent diabetes mellitus during and after pregnancy. Acta endocrinologica 1991; 124:534-539
  390. Pearce EN. Thyroid disorders during pregnancy and postpartum. Best practice & research Clinical obstetrics & gynaecology 2015; 29:700-706
  391. Azizi F. The occurrence of permanent thyroid failure in patients with subclinical postpartum thyroiditis. European journal of endocrinology 2005; 153:367-371
  392. Stagnaro-Green A, Schwartz A, Gismondi R, Tinelli A, Mangieri T, Negro R. High rate of persistent hypothyroidism in a large-scale prospective study of postpartum thyroiditis in southern Italy. The Journal of clinical endocrinology and metabolism 2011; 96:652-657
  393. Stuckey BG, Kent GN, Allen JR, Ward LC, Brown SJ, Walsh JP. Low urinary iodine postpartum is associated with hypothyroid postpartum thyroid dysfunction and predicts long-term hypothyroidism. Clinical endocrinology 2011; 74:631-635
  394. Bergink V, Pop VJM, Nielsen PR, Agerbo E, Munk-Olsen T, Liu X. Comorbidity of autoimmune thyroid disorders and psychiatric disorders during the postpartum period: a Danish nationwide register-based cohort study. Psychological medicine 2018; 48:1291-1298
  395. Covinsky M, Laterza O, Pfeifer JD, Farkas-Szallasi T, Scott MG. An IgM lambda antibody to Escherichia coli produces false-positive results in multiple immunometric assays. Clinical chemistry 2000; 46:1157-1161
  396. Kailajarvi M, Takala T, Gronroos P, Tryding N, Viikari J, Irjala K, Forsstrom J. Reminders of drug effects on laboratory test results. Clinical chemistry 2000; 46:1395-1400
  397. Ismail AA, Walker PL, Cawood ML, Barth JH. Interference in immunoassay is an underestimated problem. Annals of clinical biochemistry 2002; 39:366-373
  398. Kricka LJ. Interferences in immunoassay--still a threat. Clinical chemistry 2000; 46:1037-1038


Glucocorticoid Receptor

ABSTRACT


The glucocorticoid receptor (GR) is an evolutionally conserved nuclear receptor superfamily protein that mediates the diverse actions of glucocorticoids as a ligand-dependent transcription factor. This receptor is a protein that shuttles from the cytoplasm to the nucleus upon binding to its ligand glucocorticoid hormone, where it modulates the transcription rates of glucocorticoid-responsive genes positively or negatively. Tremendous efforts have been made to reveal the molecular signaling actions of the GR, including intracellular shuttling, transcriptional regulation and interaction with other intracellular signaling pathways. Glucocorticoids are essential for both maintenance of the resting state and the stress response, and are pivotal in the treatment of many disorders, including autoimmune, inflammatory, allergic, and lymphoproliferative diseases. Thus, pathologic or therapeutic implications of the GR, including genetic alterations in the human GR gene, disease-associated GR regulatory molecules, and development of GR ligands with selective GR actions, are of great importance. This chapter provides an overview on such GR-related research activities.


INTRODUCTION


Glucocorticoids are steroid hormones secreted by the adrenal glands. They are important for the maintenance of basal and stress-related homeostasis by acting as end products of the stress-responsive hypothalamic-pituitary-adrenal (HPA) axis (1). Glucocorticoids regulate a variety of biologic processes and exert profound influences on many physiologic functions (2,3). In pharmacologic doses, glucocorticoids are used as potent immunosuppressive agents in the therapeutic management of many inflammatory, autoimmune and lympho-proliferative diseases (4). At the cellular level, the actions of glucocorticoids are mediated by an intracellular receptor protein, the glucocorticoid receptor (GR) (its gene name is “nuclear receptor subfamily 3, group C, member 1: NR3C1”), which belongs to the steroid/sterol/thyroid/retinoid/orphan receptor superfamily of nuclear transactivating factors with over 200 members in general and over 40 in mammals currently cloned and characterized across species (5). Human GR consists of 777 amino acid residues (5). GR is ubiquitously expressed in almost all human tissues and organs including neural stem cells (6). GR functions as a hormone-dependent transcription factor that regulates the expression of glucocorticoid-responsive genes, which probably represent 3-10% of the human genome and can be influenced by the ligand-activated GR directly or indirectly (7).


EVOLUTION OF GR


Nuclear hormone receptors (NRs) form a highly conserved protein family observed even in simple metazoans. They are phylogenically differentiated into 7 subfamilies under the evolutional selection pressure, and are still active in the current human population (8). GR is a member of the steroid hormone receptor (SR) subfamily (subfamily 3) of NRs. This receptor family of vertebrates consists of six evolutionarily related SRs: two for estrogens (estrogen receptor (ER) a and ERβ) and one each for androgens (androgen receptor: AR), progestins (progesterone receptor: PR), glucocorticoids (GR), and mineralocorticoids (mineralocorticoid receptor: MR) (Figure 1). These steroid receptors are also categorized as type I receptors, based on their functional characteristics, such as cytoplasmic localization in the absence of ligand with association to the heat shock proteins, homo-dimerization and recognition of their target DNA sequence (see below), while the other NRs belong to type II to IV (5).

Figure 1. Steroid hormone receptors (SRs: class I receptors) and their homologies expressed as percent identity to the protein sequence of human GR. AR; androgen receptor, ER: estrogen receptor, ER: estrogen receptor, GR; glucocorticoid receptor, MR: mineralocorticoid receptor, PR-A: progesterone receptor-A. Modified from (9).

SRs evolved in the chordate lineage after the separation of deuterostomes and protostomes, prior to or at the base of the Cambrian explosion about 540 million years ago (10,11) (Figure 2A). The receptor phylogeny suggests that two serial gene duplications of an ancestral SR gene occurred before the divergence of lamprey and jawed vertebrates (Figure 2B). The first gene duplication (duplication #1 in Figure 2B) created an estrogen receptor (ER) and a 3-ketosteroid receptor, whereas the second duplication (duplication #2 in Figure 2B) of the latter gene produced a corticoid receptor and a receptor for 3-ketogonadal steroids (androgens, progestins, or both). Therefore, the ancestral vertebrates (e.g., lamprey) had three SRs: an estrogen receptor (ER), a receptor for corticoids (corticosteroid receptor: CR) and a receptor that bound androgens, progestins or both (ancestral PR). At some later time within the gnathostome lineage, each of these three receptor genes were duplicated again (duplications #3, #4 and #5 in Figure 2B) to yield the six SRs currently found in jawed vertebrates: the ER creating ERa and ERβ, CR yielding the GR and MR, and the 3-ketogonadal steroid receptor (ancestral PR) producing the PR and AR. Therefore, the genome of ‘higher’ vertebrates is thought to be the result of three genome duplication events that occurred early in chordate evolution (10,12). Although the timing of these events is not entirely clear, it is most likely that the first 2 duplications occurred before the lamprey-gnathostome divergence and one after (10,13).

Figure 2. Evolution of SRs including GR. A: Appearance of the SR member receptors through evolution of the chordate lineage. The first ancestral SR, which is close to the current ER, appeared ~540 million years ago. At lamprey, 3 receptors, ER, PR and CR, emerged. From the ray-finned fishes, all SR members, ER, PR, AR, GR and MR, appeared. Modified from (14). B: Phylogeny of the SR family genes. Current human SRs including GR were generated through several gene duplications (shown as orange squares). Appearance of the ancestral (Anc) SR1, SR2 and CR are shown with arrows in the phylogeny tree. Blue lines indicate the lamprey-gnathostome divergence. Modified from (10).

The GR and its closest family member MR, both descend from duplication of the ancestral CR (AncCR) gene, and emerged in the vertebrate lineage approximately 450 million years ago (12,15) (Figure 2B). The GR is activated by cortisol, while the MR is activated by aldosterone in tetrapods and by deoxycorticosterone (DOC) in teleosts. The MR is also sensitive to cortisol, though considerably less so than to aldosterone and DOC (12,15). Like the MR, the AncCR is sensitive to aldosterone, DOC and cortisol, indicating that the specificity of GR for cortisol is evolutionarily derived (12,15).


To determine how the preference of the GR for cortisol evolved, Ortlund et al. identified substitutions that occurred during the same period as the shift in GR function (16). Using maximum likelihood phylogenetics, he revealed that GR retained AncCR’s sensitivity to aldosterone, DOC and cortisol, from the common ancestor of all jawed vertebrates, but the GR from the common ancestor of bony vertebrates obtained a phenotype like that of the current GRs that respond only to cortisol. These findings indicate that the specificity of GR for cortisol evolved during the interval between these two speciation events, approximately 420 to 440 million years ago (16). Amino acid substitutions found in the modern GR compared to AncGR are not a consequence of the direct introduction of corresponding nucleotide changes, but supported by permissive mutations that enabled the intermediate receptor to tolerate insertion of the final substitutions (17).


Teleosts, one of the 3 subgroups of ray-finned fishes that covers most of the living fishes today, underwent an additional gene duplication event about 350 million years ago (18). Thus, all fishes that belong to this subclass, including carp and rainbow trout, have 2 GR genes (GR1 and 2 in rainbow trout). However, zebrafish has only one GR gene in contrast to the other teleost families, because this species lost the 2nd GR gene sometime during the last 33 million years (18).


STRUCTURE OF THE HUMAN GR GENE AND PROTEIN


All SRs including GR display a modular structure comprised of five to six regions (A-F): the amino-terminal A/B region, also called immunogenic or N-terminal domain (NTD), and the C and E regions, which correspond to the DNA- (DBD) and ligand-binding (LBD) domains, respectively (Figure 3). D region represents the hinge region (HR), while F region is located in the C-terminal end of the NRs with high variability. GR does not have a F region. The GR cDNA was isolated by expression cloning in 1985 (19). The human GR gene consists of 9 exons and is located in the long arm of the chromosome 5 (5q31.3) in an inverse orientation and spanning ~160 kbs. Alternative splicing of the human GR gene in exon 9 generates two highly homologous receptor isoforms, termed a and b. These are identical through amino acid 727, but then diverge, with human GRa having an additional 50 amino acids and human GRb having an additional, nonhomologous 15 amino acids (20). The molecular weights of these receptor isoforms are 97 and 94 kilo-Dalton, respectively. Human GRa is expressed virtually in all organs and tissues, resides primarily in the cytoplasm, and represents the classic glucocorticoid receptor that functions as a ligand-dependent transcription factor. Human GRb, also expressed ubiquitously, does not bind glucocorticoid agonists and functions as a dominant negative receptor for GRa-induced transcriptional activity (see Section 7. THE SPLICE VARIANT GR-beta ISOFORM) (21).

Figure 3. Genomic and complementary DNA and protein structures of the human (h) GR with its functional distribution, and the isoforms produced through alternative splicing.
The hGR (NR3C1) gene consists of 10 exons. Exon 1 is an untranslated region (UTR), exon 2 encodes for NTD (A/B), exon 3 and 4 for DBD (C), and exons 5-9 for the hinge region (D) and LBD (E). GR does not have an F region in contrast to the other steroid hormone receptors. The GR (NR3C1) gene contains two terminal exons 9 (exon 9 and 9) alternatively spliced to produce the classic GR and the nonligand-binding GR isoform. C-terminal gray-colored domains in GR and GR show their specific portions. Locations of several functional domains are also indicated. AF-1 and -2: activation function-1 and -2; DBD; DNA-binding domain; HD: hinge region; LBD: Ligand-binding domain; NTD: N-terminal domain, NL1 and 2: Nuclear translocation signal 1 and 2.

The N-terminal domain (NTD) of GRa contains a major transactivation domain, termed activation function (AF)-1, which is located between amino acids 77 and 262 of the human GRa (22,23). AF-1 belongs to a group of acidic activators, such as VP16, nuclear factor of kB (NF-kB), p65 and p53, contains four a-helices, and plays an important role in the communication between the receptor and molecules necessary for the initiation of transcription, including coactivators, chromatin modulators and basal transcription factors [RNA polymerase II, TATA-binding protein (TBP) and a host of TBP-associated proteins (TAFIIs)] (24). GRa AF-1 is relatively unfolded at the basal state, while it forms a significantly complex helical structure in response to binding to cofactors, such as TBP and p160 coactivators (25,26). TBP-induced conformational change in AF-1 facilitates association of this domain to a p160 coactivator (27).


The DNA-binding domain (DBD) of the human GRa corresponds to amino acids 420-480 and contains two C4-type zinc finger motifs through which GRa binds to specific DNA sequences, the glucocorticoid-responsive elements (GREs) (28,29). The DBD is the most highly conserved domain throughout the NR family. It has two similar zinc finger modules, each nucleated by a zinc ion coordination center held by four cysteine (C) residues and followed by a-helix (Figure 4A). The N-terminal’s first a-helix lies in the major groove of the double-stranded DNA, while the C-terminal part of the second a-helix is positioned over the minor groove (Figure 4B).

Figure 4. Structure of GR DBD and its interaction with DNA GRE. A: Zinc finger structures in DBD of hGR. Numbered eight cysteine (C) residues chelate Zn2+ to form two separate finger structures. Red-colored amino acid residues form -helical structures. Box with bold line indicates lever arm, while that with dashed line shows D-box. Modified from (30). B: 3-Dimensional model of the physical interaction between the GR DBD and DNA GRE. The N-terminal’s first -helix of the GR DBD lies in the major groove of the double-stranded DNA, while the C-terminal part of the second -helix is positioned over the minor groove. The image was created and donated by Dr. D.E. Hurt (National Institute of Allergy and Infectious Diseases, NIH, Bethesda, MD). Box with bold line indicates lever arm, while that with dashed line shows D-box. Modified from (30).

The ligand-binding domain (LBD) of the human GRa corresponds to amino acids 481-777, binds to glucocorticoids, and plays a critical role in the ligand-induced activation of GRalpha. The crystal structure of the GRalpha LBD was successfully analyzed by using a point mutant containing a single replacement of phenylalanine at amino acid 602 by serine, and is comprised of 12 a-helices and 4 small β-sheets that fold into a three-layer helical domain (31) (Figure 5). Helices 1 and 3 form one side of a helical sandwich, while helices 7 and 10 form the other side. The middle layer of the helices (helices 4, 5, 8, and 9) is present in the top but not the bottom half of the protein. This arrangement of helices creates a cavity in the bottom half of the LBD, which is surrounded by helices 3, 4, 11 and 12, and functions as a ligand-binding pocket (31-33). Interaction of the LBD with the heat shock protein (hsp) 90 contributes to the maintenance of the protein structure that allows LBD to associate with ligand. Ligand-binding induces a conformational change in the LBD and allows GRa to communicate with several molecules, such as importin a of the nuclear import system, components of the transcription initiation complexes and other transcription factors that mediate the ligand-dependent actions of GRa. The LBD also contains one transactivation domain, termed AF-2. The activity of AF-2 is ligand-dependent.

Figure 5. Structure of the GR LBD. The GR consists of 12 -helices and 4 small β-sheets that fold into a three-layer helical domain. Helices 1 and 3 form one side of a helical sandwich, while helices 7 and 10 form the other side. The middle layer of helices 4, 5, 8, and 9 are present in the top but not in the bottom half of the protein, thus creating a ligand-binding pocket (shown as yellow star) in the bottom half of the LBD, surrounded by helices 3, 4, 11 and 12. The image was created with the MacPyMOL software using 3K22 of the RCSB Protein Data Bank (PDB) (http://www.rcsb.org/pdb/home/home.do).

TRANSCRIPTIONAL AND TRANSLATIONAL REGULATION OF GR ISOFORMS


As described above, the human GR gene expresses two mRNAs through alternative use of exon 9a and 9b, and produces two splice variants. The human GRa mRNA further expresses multiple isoforms by using at least 8 alternative translation initiation sites (34) (Figure 6). Since human GRb shares a common mRNA domain that contains the same translation initiation sites with human GRa (19), the human GRb variant mRNA seems also to be translated through the same initiation sites to a similar host of b isoforms. They are produced by ribosomal leaky scanning and/or ribosomal shunting from their alternative translation initiation sites located at amino acids 27 (GRa-B), 86 (GRa-C1), 90 (GRa-C2), 98 (GRa-C3), 316 (GRa-D1), 331 (GRa-D2) and 336 (GRa-D3), C-terminally from the classic translation start site (1: for the GRa-A) (34). Thus, they have different lengths of NTDs but the same DBDs and LBDs. Compared to GRa-A, GRa-C2 and GRa-C3 isoforms have stronger transcriptional activities on a synthetic GRE-driven promoter, while GRa-D1, GRa-D2 and GRa-D3 demonstrate weaker activities (34). GRa-B and GRa-C1, however, possess transcriptional activities similar to that of GRa-A (34). Absence of AF-1 in GRa-D isoforms may explain their reduced transcriptional activity, while ~100 amino acids (particularly 3 polar amino acids) located in the N-terminal portion of AF-1 appear to support increased transcriptional activity of GRa-C isoforms (35). All human GRa isoforms translocate into the nucleus in response to ligand, while they are differentially distributed in the cytoplasm and/or the nucleus in the absence of ligand and display distinct transactivation or transrepression patterns on global gene expression examined by cDNA microarray analyses (34). Such isoform-specific transcriptional activity is in part explained by their distinct chromatin modulatory activity, which is evident in the different potencies of the translational isoforms to induce apoptosis in T-cell Jurkat cells (36).

Figure 6. GR isoforms produced through alternative splicing or use of different translational initiation sites. The human GR (NR3C1) gene contains two terminal exons 9 (9alpha and 9beta) alternatively spliced to produce the classic GR (GRalpha-A) and GRbeta-A. C-terminal dark yellow-colored domains in GRalpha-A and GRbeta-A show their specific portions. Using at least 8 different translation initiation sites located in NTD, the human GR (NR3C1) gene produces multiple GR isoforms termed A through D (A, B, C1-C3 and D1-D3) with distinct transcriptional activities on glucocorticoid-responsive genes. Since GRalpha and GRbeta share a common mRNA domain that contains the same translation initiation sites, the GRbeta variant mRNA appears to be also translated through the same initiation sites and to produce 8 isoforms with different lengths of NTD. Modified from (20,37). AF-1 and -2: activation function-1 and -2; DBD; DNA-binding domain; HD: hinge region; LBD: Ligand-binding domain

Translational Human GRa isoforms are differentially expressed in various cell lines, tissues and at different developmental stages (34). For example, GRa-D isoforms are predominant in immature bone marrow-derived dendritic cells (DCs), while GRa-A is a main isoform in mature DCs, and this characteristic expression explains maturation-specific alteration of glucocorticoid sensitivity in these cells (38). GRa-A is highly expressed in brains of toddlers to teenagers, whereas peak expression of GRa-D is observed in those of neonates (39). Thus, these N-terminal human GRa isoforms may differentially transduce glucocorticoid hormone signals to tissues, depending on their selective expression and inherent activities.


The human GR gene has eleven different promoters with their alternative first exons (1A1, 1A2, 1A3, 1B, 1C, 1D, 1E, 1F, 1H, 1I and 1J) (40,41) (Figure 7). Therefore, the human GR gene can produce eleven different transcripts from different promoters that encode the same GR proteins sharing a common exon 2 containing the translating ATG codon. 1A1, 1A2, 1A3 and 1I are located in the distal promoter region spanning ~32,000-36,000 bps upstream of the translation start site, while 1B, 1C, 1D, 1E, 1F, 1H and 1J position in the proximal promoter region located up to ~5,000 bps upstream of such a site (40). Through differential use of these promoters, expression levels of GR protein isoforms can vary considerably among tissues and disease states (40,42). DNA methylation of the human GR gene promoter area is one of the mechanisms that regulate the activity of specific GR gene promoters. Indeed, childhood trauma, which influences development of the borderline personality disorder by affecting the stress-responsive HPA axis, contributes to the alteration of DNA methylation levels of the human GR gene promoter in the brain (43). Elevated DNA methylation in the human GR gene promoter is also found in the brain hippocampus of the patients with major depression (44). Furthermore, the methylation status of the human GR gene promoter in the peripheral blood is highly altered during the perinatal period. Interestingly, preterm infants demonstrate significantly lower levels of the DNA methylation compared to full-term infants, explaining in part relative glucocorticoid insensitivity observed in preterm babies (45).


In addition to selective use/activation-inactivation of the specific GR gene promoters, alternative untranslated 1st exon transcripts differentially control stability and translational efficiency of their existing GR mRNA, and contribute to differential tissue expression of the GR proteins (46). By employing many splice/translational GR isoforms expressed from different promoters, human GR appears to form at least 256 different combinations of homo- and hetero-dimers with varying expression levels and transcriptional activities. This marked complexity in the transcription/translation of the human GR gene allows cells/tissues to respond differentially to the circulating concentrations of glucocorticoids depending on the needs of respective tissues (20).

Figure 7. The human (h) GR (NR3C1) gene has 11 different promoters with specific exon 1 sequences. The hGR (NR3C1) gene has 11 different promoters harboring specific exon 1 sequences. Alternative exon 1s are shown as yellow arrows or arrowheads. The 5’ flanking region of the hGR (NR3C1) gene has proximal and distal promoter regions, which respectively span from ~-37,000 to ~-32,000 and from ~-5,000 to ~0, upstream of the translation initiation site located in the exon 2 (shown as “ATG” and arrowhead), and contain exons 1A1, 1A2, 1A3, and 1I, and 1B, 1C, 1D, 1E, 1F and 1H, respectively. Modified from (40,41).

ACTIONS OF GR


Nucleocytoplasmic Shuttling of GRa


In the absence of ligand, GRa resides primarily in the cytoplasm of cells as part of a large multiprotein complex, which consists of the receptor polypeptide, two molecules of hsp90, and several other proteins (28,47-49) (Figure 8). Following ligand binding, the receptor dissociates from the hsps and translocates into the nucleus. The GRa contains two nuclear translocation signals (NL), NL1 and NL2 (Figure 3): NL1 contains a classic basic-type nuclear localization signal (NLS) structure that overlaps with and extends C-terminally from the DBD of GRa (50). The function of NL1 is dependent on importin a, a protein component of the nuclear translocation system, which is energy-dependent and facilitates the translocation of the activated receptor into the nucleus through the nuclear pore. NL2 spans over almost the entire LBD. In the absence of ligand, binding of hsps with the LBD of GRa masks/inactivates NL1 and NL2, thereby maintaining GRa in the cytoplasm. Inside the nucleus, GRa binds to GREs in the promoter regions of target genes. The interaction of GRa with GREs is dynamic, with the GRa binding to and dissociating from GREs in the order of seconds, while the GRE-bound receptor helps other GRas to bind DNA by increasing chromatin accessibility (the mechanism called “assisted loading”), and ultimately up-regulates their steady state association on glucocorticoid-responsive gene promoters (51,52). The above findings were obtained using the multi-copy GREs artificially inserted into the host cell chromatin, but a recent report confirmed them by examining endogenous GREs using a single molecule imaging technique (53). GRa also modulates transcriptional activity of other transcription factors by physically interacting with them. After modulating the transcription of its responsive genes, GRa dissociates from the ligand and slowly returns to the cytoplasm as a component of the heterocomplexes with hsps (54-56). The ubiquitin-proteasomal pathway degrades ligand-bound GRa in the nucleus, facilitating clearance of the receptor from GREs; thus, this system regulates the transcriptional activity of GRalpha in a negative fashion (57,58).

Figure 8. Intracellular circulation of GR. Circulation of GR between the cytoplasm and the nucleus, and its transcriptional regulation on the glucocorticoid-responsive genes in the nucleus are shown in the panel. GR translocates into mitochondria or lysosomes as well. GREs: glucocorticoid responsive elements; TFREs: transcription factor responsive elements; HSPs: heat shock proteins; TF: transcription factor. From (59).

Several mechanisms have been postulated for the regulation of GRa nuclear export [27]. The Ca2+-binding protein calreticulin plays a role in the nuclear export of GRa, directly binding to the DBD of this receptor (60-62). In contrast, the CRM1/exportin and the classic nuclear export signal (NES)-mediated nuclear export machinery does not appear to be functional directly on GR (50,60,63). Rather, NES-harboring and phospho-serine/threonine-binding protein 14-3-3s can bind the human GR phosphorylated at serine 134, and segregates the nuclear GRa into the cytoplasm (64,65) (see also Section FACTORS THAT MODULATE GR ACTIONS, B. Epigenetic Modulation of GRa, Phosphorylation).


In addition to translocating into the nucleus, GRa was reported to shuttle into mitochondria upon ligand activation and to stimulate mitochondrial gene expression by binding to their own DNA (66) (Figure 8). Exposure of rats to stress or corticosterone induces translocation of GRa to mitochondria and modulates mitochondrial mRNA expression (67), indicating that this activity of GRa is evident at an animal level. GRa was also shown to move into the lysosome, which leads to the negative regulation of its transcriptional activity (68).


Mechanisms of GRa-mediated Activation of Transcription


Classically, GRa exerts its transcriptional activity on glucocorticoid-responsive genes by binding to GREs located in the promoter region of these genes (69). The optimal tandem GREs is an inverted hexameric palindrome separated by 3 base pairs, PuGNACANNNTGTNCPy, on which each GRa molecule binds one of the palindromes, forming a homodimer on this binding site through multiple contacts between the 2 receptors (70,71). Recent research indicated that sequence variation of GREs, including 3 non-specific spacer nucleotides, influences the 3-dimensional structure of DBD and modulates the transcriptional activity of whole GRa molecule (72,73); Binding of GRa DBD to GRE DNA sequence induces conformational changes in the dimerization surface located in D-loop through the lever arm, which positions itself between the first a-helix and D-loop (Figure 4A). Two receptors bound on each GRE half site then communicate with each other with their GRE sequence-specific dimerization surfaces, and ultimately develop net transcriptional activity. These findings suggest that DNA GRE is a sequence-specific allosteric modulator of GRa transcriptional activity through alteration of its protein conformation, explaining in part gene-specific transcriptional effects of this receptor.

The GRE-bound GRa stimulates the transcription rates of glucocorticoid-responsive genes by facilitating formation of the transcription initiation complex on the GREs-containing promoter of these genes via its AF-1 and AF-2 transactivation domains (74) (Figure 3). Actions of AF-1 located in NTD of GRa is ligand-independent, while AF-2 is created on GRa LBD upon ligand-binding (75).


The transcription initiation complex attracted and formed on DNA-bound GRa is a mega protein structure that include over 100 proteins with different activities, such as RNA polymerase II and its ancillary factors, general transcription factors and numerous co-regulatory molecules with/without enzymatic activities (74). Research studies aimed to identify molecules interacting with GRa AF-2 have led to several proteins and protein complexes, called coactivators or cofactors, that form a bridge between DNA-bound GRa and the transcription initiation complex, and assist enzymatically with the transmission of the glucocorticoid signal to RNA synthesis promoted by the RNA polymerase II (76) (Figure 9). These include: (1) p300 and the homologous cAMP-responsive element-binding protein (CREB)-binding protein (CBP), which also serve as macromolecular docking “platforms” for transcription factors from several signal transduction cascades, including NRs, CREB, activator protein-1 (AP-1), NF-kB, p53, Ras-dependent growth factor, and signal transducers and stimulators of transcription (STATs) (77). Because of their central position in many signal transduction cascades, the p300/CBP coactivators are also called co-integrators; (2) p300/CBP-associated factor (p/CAF), originally reported as a human homologue of yeast Gcn5, which interacts with p300/CBP and is also a broad transcription coactivator (78,79); and (3) the p160 family of coactivators, which preferentially interact with SRs (80). These include the steroid receptor coactivator-1 (SRC-1), SRC-2, which consists of transcription intermediate factor-II (TIF-II) and the glucocorticoid receptor-interacting protein-1 (GRIP1), and SRC-3, which consists of the p300/CBP/co-integrator-associated protein (p/CIP), activator of thyroid receptor (ACTR) and the receptor-associated coactivator-3 (RAC3) (76,80,81). These 3 subclasses of p160 family coactivators are also called, respectively, as nuclear receptor coactivators (NCoA) 1, 2 and 3.

Figure 9. Schematic model demonstrating the interaction and activity of HAT coactivators and other chromatin modulators, which are attracted by GR to the promoter region of glucocorticoid-responsive genes. Promoter-associated GR is cleared by the ubiquitin-proteasomal pathway, which regulates turnover of GR on DNA. Modified from (82). AF-1 and -2: activation function-1 and -2; CBP: cAMP-responsive element-binding protein (CREB)-binding protein; DRIP: vitamin D receptor-interacting protein; GREs: glucocorticoid response elements; p/CAF: p300/CBP-associated factor; SWI/SNF: mating-type switching/sucrose non-fermenting; TRAP: thyroid hormone receptor-associated protein.

The p160 coactivators are the first to be attracted to the DNA-bound NRs and help accumulating p300/CBP and p/CAF proteins to the promoter region, indicating that p160 proteins play a pivotal role in NR-mediated transactivation. A study using the cryoelectron microscopy demonstrated detailed attraction modes of p160 proteins and p300/CBP to DNA-bound and ligand-activated ERa (83); Each of the tandem ER response elements (EREs)-bound receptors independently attracts one p160 molecule via the transactivation surface of the receptor created by their AF-1 and AF-2. Then, the two NCoAs attracted to the receptors recruits one p300/CBP molecule to the DNA/receptors/p160s complex through multiple contacts mediated by different portions of the p160 proteins.


In addition to physical interaction and subsequent formation of the transcriptional initiating complex on the DNA-bound receptors by these coactivators (that is assembly of transcriptional initiation complex), these molecules have intrinsic histone acetyltransferase (HAT) activity through which they acetylate specific lysine residues of chromatin-bound histones, loosen the tightly assembled chromatin structure and facilitate access of other transcription factors and transcriptional complexes to the promoter region (76). These HAT coactivators also acetylate specific lysine residues of their own molecules, NRs and other transcription factors, and modulate their mutual protein-protein interaction and/or association to attracted promoters (84-86). The p160 family coactivators and p300/CBP protein contain one or more copies of the coactivator signature motif sequence LxxLL, where L is leucine and x is any amino acid (80,87). LxxLL forms a helical structure, and develops multiple hydrophobic bonds with its leucine residues to the AF-2 surface, which is created by helixes 3, 4 and 12 of the GRa LBD upon binding to ligand glucocorticoid (Figure 10A). p160-type coactivators contain 3 LxxLL motifs in its nuclear receptor-binding box (NRB) located in their central portion (76) (Figure 10B). Each of these motifs demonstrates different affinity to various NRs, indicating that specific p160 proteins participate in the transcriptional activity of particular NRs through preferential use of LxxLL motifs (88). For example, GRa preferentially interacts with GRIP1 p160 protein through C-terminally located 3rd LxxLL motif of this coactivator (89).

Figure 10. p160 coactivators physically interact with its multiple LxxLL motifs to the AF-2 surface of GR. A: 3-dimensional interaction image of GR AF-2 and the LXXLL peptide. The GR AF-2 surface has three large pockets into which core leucines (L745, L748 and L749) of the LXXLL peptide deeply bury themselves. There are additional intermolecular contacts that are important for peptide binding, including the electrostatic bonds created between (i) R746 (LXXLL peptide) and D590 (receptor), (ii) D750 (LXXLL peptide) and R585 (receptor) and (iii) D752 (LXXLL peptide) and K579 (receptor). From (89). B: p160-type coactivators (NCoAs) have 3 LxxLL motifs in their NR-binding box (NRB). Linearlized GRIP1 (NCoA2) molecule with NRB located in the middle portion is shown as a representative of the p160-type coactivators (NCoAs). In addition to NRB, GRIP1 has the basic helix-loop-helix (bLHL) and the PAS domains in its N-terminal portion, and p300/CBP-binding domain and one transactivation domain containing the HAT domain in the C-terminus.

The AF-2 transactivation domain of GRa also attracts several other distinct chromatin modulators, such as the mating-type switching/sucrose non-fermenting (SWI/SNF) complex and components of the vitamin D receptor-interacting protein/thyroid hormone receptor-associated protein (DRIP/TRAP) complex (76). The SWI/SNF complex is an ATP-dependent chromatin remodeling factor with a multi-subunit structure in which the ATPase domain functions as the catalytic center (90). Depending on the energy of ATP hydrolysis, the SWI/SNF complex introduces superhelical torsion into DNA. One of its components, SNF2 binds to AF-2 of GRa directly, functioning as an interface between the GRa and the SWI/SNF complex (91). The DRIP/TRAP complex is also a multiprotein conglomerate, which consists of over 10 different proteins, including DRIP205/TRAP220/PBP and components of SMCC (76). The DRIP/TRAP complex may modulate transcription through interaction and modification of general transcription factors, such as TFIIH or the C-terminal tail of the RNA polymerase II. DRIP205/TRAP220 contains two LxxLL motifs through which it binds to the ligand-activated AF-2 directly (92). Since the DRIP/TRAP complex and p160 coactivators use the same motif for interaction with NRs, they may bind to the same site of these receptors and sequentially interact with them for full activation of transcription. Alternatively, they may interact with a particular set of NRs, or have a different effect on different tissues (76,81).


In contrast to the mechanisms of transactivation by AF-2, those of AF-1 are not as well elucidated yet. Using the yeast system, the Ada complex may act on AF-1-mediated transcriptional activation through direct interaction to this module (93). The SWI/SNF complex, TBP and the HAT coactivators, such as p160 and p300/CBP, also physically interact with AF-1 and mediate its transcriptional activity (94-97). In addition, DRIP150, a component of the DRIP/TRAP complex, and the tumor susceptibility gene 101 (TSG101) interact with the AF-1 of the GRa in a yeast two-hybrid screening (98). The RNA coactivator, steroid RNA activator (SRA), also interacts with AF-1 (99). Given that any of these molecules and complexes interact with both AF-1 and AF-2, it is likely that concurrent activation of AF-1 and AF-2 by their common and/or distinct binding partners may be necessary for optimal activation of GRa-mediated transcriptional activity (100).


Several coactivators supporting the particular actions of glucocorticoids have been identified for GRa. The PPARg coactivator-1a (PGC1a) is a ~800 amino acid single polypeptide molecule originally identified as a cofactor physically interacting with PPARg in the yeast two-hybrid screening using a brown adipocyte cDNA library (101). PGC1a has an essential role in thermogeneration and energy metabolism by controlling mitochondrial biogenesis (101). It also regulates gluconeogenesis and cholesterol metabolism, as well as blood pressure and muscle fiber determination through physical interaction with various NRs, transcriptional factors and coactivators, such as PPARa, hepatocyte nuclear factor 4, CREB, nuclear respiratory factors, and p160 and p300/CBP coactivators (101). GRa also interacts physically with PGC1a through the latter’s LxxLL motif and this interaction is important for stimulation of gluconeogenesis through transcriptional stimulation of the 2 key genes respectively encoding the glucose-6-phosphatase (G6P) and the phosphoenolpyruvate carboxykinase (PEPCK) (101). It is known that longevity-associated histone deacetylase Sirt1 regulates PGC1a activity through its deacetylase activity-dependent or -independent manner (102,103). Sirt1 is shown to interact physically with GRa as well, and PGC1a and Sirt1 cooperatively enhance GR-induced transcriptional activity of glucocorticoid-responsive genes (104).


The CREB-regulated transcription coactivator 2 (CRTC2) is a coactivator previously known to be specific to CREB, and plays a central role in the glucagon-mediated activation of gluconeogenesis in the early phase of fasting (105). This coactivator functions also as a coactivator of GRa by physically interacting with its LBD outside of AF-2, and is required for glucocorticoid-mediated early phase gluconeogenesis by supporting the transcriptional activity of GRa on the G6P and PEPCK genes, while PGC1a cooperates with GRa for maintaining a late phase of fasting-induced gluconeogenesis (106).


Presence of numerous transcriptional cofactors that interact with GRa and influence its transcriptional activity indicate that they may have functional redundancy and/or activities specific to each of them, regulating particular sets of GRa-responsive genes. A study employing knockdown of GRalpha cofactors, such as CCAR1CCAR2CALCOCO1 or ZNF282, has addressed this important issue: it revealed that knockdown of any of these cofactor molecules resulted in specific impact on the expression of a particular set of glucocorticoid-responsive genes (107), suggesting that each cofactor molecule has distinct transcriptional regulatory activity on GRa, thus their expression profiles in tissues/organs potentially influence the transcriptional activity of GRa in respective tissues.


Emerging Concept on GRa-mediated Transcriptional Repression


GRa has long been believed to exert its transcriptional activity by binding to the classic GREs, which consists of inverted hexameric palindrome separated by 3 base pairs. However, Surjit, et al. identified unique DNA sequences also targeted by the GRa DBD, called “negative” GREs (nGREs), which play substantial roles in gene transrepression caused by GRa (108). The consensus sequence of nGREs is an inverted quadrimeric palindrome separated by 0-2 nucleotide pairs (CTCC(N)0–2GGAGA). In the structural study employing the prototype nGREs found in the thymic stromal lymphoprotein (TSLP) promoter as a model, 2 GRa molecules bound each palindrome as a monomer with different affinity in a head-to-tail fashion, in contrast to GRa-classic GREs where 2 receptors bind DNA in a head-to-head fashion (109) (Figure 11). nGREs are ubiquitously present in the genes repressed by glucocorticoids throughout several animal species, facilitating access of the silencing mediator for retinoid and thyroid hormone receptors (SMRT)/nuclear receptor corepressor (NCoR)-repressing complexes on the agonist-associated GRa bound on these sequences. This is a new concept, indicating that direct binding of GRa through its DBD to DNA sequences distinct from those of the classic GREs mediates glucocorticoid-induced transcriptional repression. However, a genome-wide study revealed that classic GREs and the “new” nGREs both contribute to transactivation and transrepression of glucocorticoid-responsive genes, suggesting that GRa-targeting DNA sequences per se are insufficient to confer direction of transcriptional regulation, but epigenetic factors and subsequent chromatin modification may play critical roles (110).

Figure 11. GR binds nGREs as a monomer. GR binds nGREs as a monomer at each of its half site (A) in contrast to its binding as a homo-dimer to classic GREs (B). nGREs of the mouse TSLP gene is used as an example. Images are from the PDB Website (www.rcsb.org). Image data for GR interaction with nGREs and classic GREs are DOI: 10.2210/pdb4hn5/pdb and DOI: 10.2210/pdb3g9m/pdb, respectively.

Interaction of GRa with Transcription Factors


Glucocorticoids exert their diverse effects through its single receptor protein module, the GRa. In addition to direct regulation of gene expression through GRa/DNA interaction, these hormones affect other signal transduction cascades through mutual protein-protein interactions between specific transcription factors and GRa, influencing the former’s ability to stimulate or inhibit the transcription rates of the respective target genes.


The protein-protein interaction of GRa with other transcription factors may take place on the promoters that do not contain GREs (tethering mechanism), as well as on those having both GRE(s) and responsive element(s) of the transcription factors that interact with GRa (“composite promoters”) (111) (Figure 12). Repression of the transactivation activity of other transcription factors through protein-protein interaction may be particularly important in suppression of immune function and inflammation by glucocorticoids (112,113). Substantial part of the effects of glucocorticoids on the immune system may be explained by the interaction between GRa and NF-kB, AP-1 and probably STATs (114-116). It was also reported that GRa directly interacts with the transcription factors “T-box expressed in T-cells” (T-bet) and GATA-3, which play key roles respectively in the differentiation of T helper-1 and T helper-2 lymphocytes (117,118). GRa also influences indirectly the actions of the interferon regulatory factor-3 (IRF-3) through the p160 nuclear receptor GRIP1, by competing with this factor for binding to the coactivator (119). These transcription factors are important for the regulation of immune function and the above interactions may explain some GR actions on the immune system. The following subsections will discuss GRa-interacting transcription factors and their effects on GRa-induced transcriptional activity.

Figure 12. Three different modes of transcriptional regulation of the glucocorticoid-responsive promoters by GR. GR may interact with other transcription factors directly or indirectly. Protein(s) or protein complex(es) may intermediate their interaction in the latter case. GREs: glucocorticoid responsive elements; TF: transcription factor; TFREs: transcription factor responsive elements

Nuclear Factor-kB (NF-kB)


NF-kB is one of the most important transcription factors that regulate inflammation and immune function. NF-kB is stimulated by many inflammatory signals and cytokines (115,120). It is a dimer of various members of the NF-kB/Rel family, including p50 (and its precursor p105), p52 (and its precursor p100), c-Rel, RelA and RelB in mammalian organisms. The heterodimer p65/p50 is a major and the most abundant form of NF-kB. In its inactive form, NF-kB creates a trimer with an additional regulatory protein, IkB in the cytoplasm. A variety of extracellular signals, such as bacterial and viral products (like lipopolysaccharide (LPS)) and several proinflammatory cytokines, induces phosphorylation of IkB by activating a cascade of kinases. The phosphorylated IkB then dissociates from NF-kB and is catabolized, while the liberated NF-kB enters into the nucleus where it binds to the kB-responsive elements in the promoter regions of its responsive genes. Ligand-activated GRa directly binds NF-kB p65 at its Rel homology domain through its DBD and suppresses the transcriptional activity of NF-kB, while NF-kB suppresses GRa-induced transactivation through GREs. Interaction with GRa inhibits binding of NF-kB to its responsive elements or neutralizes its ability to transmit an effective signal (121-124). The LBD of GRa is necessary for this suppressive action (125). GRa also suppresses NF-kB-induced transactivation by an additional mechanism, in which the GRa tethered to the kB-responsive promoters attracts histone deacetylases (HDACs) and/or modulates the phosphorylation of the RNA polymerase II C-terminal tail (126,127). In addition, ligand-activated GRa increases the synthesis of IkB by stimulating its promoter activity through classic GREs, thus segregating active NF-kB from the nucleus by forming inactive heterocomplexes with IkB in the cytoplasm (128). A study further indicated that attraction of the p160 coactivator GRIP1 together with GRa to NF-kB is required for glucocorticoid-induced repression of NF-kB-mediated cytokine gene expression in mouse primary macrophages (129).


Activator Protein-1 (AP-1)


AP-1 is a transcription factor, which regulates diverse gene expression involved in cell proliferation and differentiation (114,130,131). It acts as a dimer of the bZip protein family members, in which c-Fos and c-Jun heterodimers are most abundant. AP-1 transduces biological activities of phorbol esters, growth factors and pro-inflammatory cytokines, such as IL-1 and tumor necrosis factor (TNF) a. These compounds/cytokines stimulate different members of the mitogen-activated protein kinase (MAPK) family, e.g., p38 MAPK, extracellular signal-regulated kinase (ERK) and Jun N-terminal kinase (JNK). Once these kinases are activated, they stimulate the synthesis of specific transcription factors involved in the induction of fos and jun gene transcription, as well as enhance the transcriptional activity of both pre-existing and newly synthesized c-Fos/c-Jun proteins. AP-1 and GRa mutually interact and repress each other’s transcriptional activity on their respective responsive promoters. The LBD and DBD of GRa and the leucine zipper domain of c-Jun are necessary for this interaction (29). Inhibition of the binding of AP-1 to DNA may be one of the underlying mechanisms of GRa-induced suppression of AP-1-mediated transcriptional activity. Furthermore, GRa competes with AP-1 for the p300/CBP coactivator, which has a limited reserve, therefore, AP-1 may not have access to adequate amounts of this coactivator to exert its transcriptional activity fully (132).


cAMP Response Element-binding Protein (CREB)


CREB functions downstream of many hormones and bioactive molecules, which bind to the cell surface-located G-protein-coupled receptors that employ cAMP as their second messenger. CREB is also a member of the bZip transcription factors (133). It forms homo- and hetero-dimers with other proteins of the same family and binds to the cAMP-responsive element (CRE). Stimulation of the above receptors induces the accumulation of cAMP that leads to activation of the cAMP-dependent protein kinase A (PKA). This kinase then phosphorylates CREB at a specific serine residue and promotes recruitment of the transcriptional co-integrator CBP and its specific coactivator CRTC2 to stimulate the transcription of cAMP-responsive genes. GRa and CREB mutually repress the transcription from their simple responsive promoters (134,135). Although direct association of GRa and CREB has been reported in vitro, their physical interaction is still unclear (134,136). CRTC2 might act as a bridging factor between CREB and GRa, particularly in their synergistic activation of the composite promoters, such as that of G6PPEPCK and the somatostatin gene, which contain both GREs and CRE sequences (106,136,137) (see also Section 5. ACTIONS OF GR, B. Mechanisms of GRalpha-mediated Activation of Transcription).


Transforming Growth Factor (TGF) b Downstream Smad6


Members of the Smad family of proteins transduce signals of transforming growth factor (TGF) b superfamily members, such as TGFb, activin and bone morphogenetic proteins (BMPs), by associating with the cytoplasmic side of the type I cell surface receptors of these hormones (138). Nine distinct vertebrate Smad family members have been identified, which are classified into three groups: receptor-regulated Smads (R-Smads), such as Smad1, 2, 3, 5 and 8, a common-partner Smad (Co-Smad), Smad4, and inhibitory Smads (I-Smads) like Smad6 and Smad7 (138).


Upon binding of TGFb, activin or BMP to their receptors, cytoplasmic R-Smads are phosphorylated by the receptor kinases, translocate into the nucleus and stimulate the transcriptional activity of TFGb-, activin- or BMP-responsive genes by binding to their response elements located in their promoter region as a hetero-trimer with Co-Smad (138). I-Smads, such as Smad6 and Smad7, act as inhibitory molecules in the TGFb family signaling, by forming stable associations with activated type I receptors, which prevent the phosphorylation of R-Smads (138). Smad6 also competes with Smad4 in the heteromeric complex formation induced by activated Smad1 (139). In addition, I-Smads directly suppress the transcriptional activity of TGFb family signaling by binding to promoter DNA and attracting HDACs and/or the C-terminal binding protein (CtBP) (140-142). Since I-Smads are produced in response to activation of the TGFb family signaling (143), they literally function in the negative feedback regulation of the Smad signaling pathways. Smad6 preferably inhibits BMP signaling, while Smad7 is a more general inhibitor, repressing TGFb and activin signaling, in addition to that of BMP (144).

We found that Smad6 physically interacts with the N-terminal domain of the GRa through its Mad-homology 2 domain and suppresses GRa-mediated transcriptional activity in vitro (145). Adenovirus-mediated Smad6 overexpression also inhibits glucocorticoid action in rat liver in vivo, preventing dexamethasone-induced elevation of blood glucose levels and hepatic mRNA expression of PEPCK, a well-known rate-limiting enzyme of hepatic gluconeogenesis (145). Smad6 suppresses GRa-induced transactivation by attracting HDAC3 to DNA-bound GRa and by antagonizing acetylation of the histones H3 and H4 induced by p160 HAT coactivators (145). Thus, Smad6 regulates glucocorticoid actions as a corepressor of GRa. It appears that the anti-glucocorticoid actions of Smad6 may contribute to the neuroprotective, anti-catabolic and pro-wound healing properties of the TGFb family of proteins through cross-talk between TGFb family members and glucocorticoids (145).


C2H2-type Zinc Finger Proteins (ZNFs)


C2H2-type ZNFs constitute the largest class of putative human transcription factors consisting of over 700 member proteins (146,147). In addition to C2H2-type zinc fingers (ZFs), these proteins harbor several structural modules, such as the Broad-Complex, Tramtrack, and Bric-a-brac (BTB)/Poxvirus and zinc finger (POZ), Krüppel-associated box (KRAB) and SCAN domains (147). These modules are usually located in the N-terminal portion, and function as platforms for protein-protein interactions, whereas ZFs are positioned in the C-terminal area and function mainly as a DNA-binding domain (147). The BTB/POZ and KRAB domains have transcriptional regulatory activity (mostly repressive), whereas the SCAN domain does not (148). Among human C2H2-type ZNFs, about 7% have a BTB/POZ domain (BTB/POZ-ZNFs), 43% harbor a KRAB domain (KRAB-ZNFs) and 7% contain a SCAN domain (SCAN-ZNFs) (146). Sixty-seven % of the human C2H2-type ZNFs have only ZFs without any of these domains (thus, they are “poly-ZNFs”) (146). Some poly-ZNFs, such as members of the specificity protein (SP)/Krüppel-like factor (KLF) family transcription factors (e.g., SP1, KLF4 and KLF11) cooperate with GRa for regulating the transcriptional activity of specific glucocorticoid-responsive genes in distinct biological pathways, such as monoamine oxidase A expression in CNS and glucocorticoid-mediated skin barrier formation in prenatal fetus (147). Furthermore, GRa stimulates the transcriptional activity of the KLF9 gene through the GREs located in the promoter region of this gene, and expressed KLF9 plays important roles in glucocorticoid-mediated survival of the newly differentiated hippocampal granule neurons (147). One poly-ZNF called CCCTC-binding factor (CTCF) is an architectural protein playing a major role in the formation of chromatin looping, which governs enhancer-gene promoter communication, and ultimately contributes to the tissue/phase-specific expression of glucocorticoid-responsive genes (149). Although direct evidence of its interaction to GRa is still missing, CTCF interacts with ERa and the thyroid hormone receptors (TRs) and regulates their transcriptional activity (150,151), thus it is highly possible that this molecule also plays roles in the regulation of GRa transcriptional activity. One KRAB-ZNF, the zinc finger protein 764 (ZNF764), which composes of a N-terminally located KRAB domain and seven C2H2-type ZF motifs in the C-terminal area, was identified as a coactivator of several SRs including GRa, possibly cooperating with other NR coactivators (152). Indeed, haploinsufficiency of the ZNF764 gene by microdeletion was associated with partial tissue insensitivity to glucocorticoids and developmental abnormalities of androgen-dependent organs in an affected boy (152). In a genome-wide binding study using ChIP-sequencing, ZNF764- and GRa-binding sites are found in close proximity, indicating that ZNF764 modulates GRa transcriptional activity by incorporated in the transcriptional complex formed on DNA-bound GR (153).


Forkhead Transcription Factors


Forkhead transcription factors are characterized by their DNA-binding domain called “Forkhead Box”, and consist of over 100 family members classified from FOXA to FOXR (154). Among them, FOXO subgroup proteins (FOXO1, 3, 4 and 6 in humans) mediate biological actions of the insulin/PI3K/Akt signaling pathway through phosphorylation of several serine/threonine residues of this subgroup proteins, acting on cell proliferation, cell cycle regulation, oxidative stress, DNA repair, energy and glucose metabolism (154). Some of forkhead transcription factors (e.g., FOXA1) can act as pioneer factors for other transcription factors including NRs, by opening DNA-binding sites of the latter molecules on the chromatin (see also Section 5. ACTIONS OF GR, E. New Findings on Genome-wide Transcriptional Regulation by GRa) (155). FOXA3 acts as a pioneer factor for GRa by facilitating the latter binding to DNA possibly through modulation of the chromatin accessibility and is required for glucocorticoid-mediated fat accumulation in adipose tissues (156).


Other Transcription Factors


Functional interaction of GRa has also been reported with other transcription factors, including the chicken ovalbumin promoter-upstream transcription factor II (COUP-TFII), HNF-6, NR4A orphan receptors (neuron-derived orphan receptor-1 (NOR-1), nuclear receptor-related 1 (NURR1) and Nur77), liver X receptors (LXRs), farnesoid X receptor (FXR), p53, T-bet, GATA-1 and -3, Oct-1 and -2, NF-1 and C/EBPb. COUP-TFII is an orphan nuclear receptor, which plays important roles in neurogenesis as well as glucose, lipid and xenobiotic metabolism. This NR physically interacts with the hinge region of GRa and suppresses GRa-induced transcriptional activity by attracting the corepressor SMRT (157). Mutual protein-protein interaction of GRa and COUP-TFII was necessary for glucocorticoid-induced enhancement of the promoter activity and the endogenous mRNA expression of the COUP-TFII-responsive PEPCK, suggesting that COUP-TFII may participate in some of the metabolic effects of glucocorticoids through direct interactions with GRa (157). The hepatocyte nuclear factor 6 (HNF6) is a transcription factor that consists of 2 different DNA binding domains (CUT and homeobox) and plays an important role in the hepatic metabolism of glucose. It represses GRa-induced transactivation by directly binding to GRa DBD (158). Interaction of another orphan nuclear receptor Nur77 and GRa is critical for the regulation of proopiomelanocortin (POMC) gene expression (159). LXRs consist of 2 isoforms LXRa and LXRb, and play a central role in the regulation of cholesterol/fatty acid metabolism by binding to their metabolites as a ligand, while FXR acts on bile acid metabolism. GRa and these NRs modulate each other’s transcriptional activity by communicating through direct protein-protein interaction (160-162). p53, a transcription factor functioning as a tumor suppressor, physically interacts with GRa in the cytoplasm along with an additional protein Hdm2. GRa and p53 mutually repress each other’s transcriptional activity by increasing their degradation rates (163,164). GRa also interacts with Oct-1 and -2 on the mouse mammary tumor virus (MMTV) promoter and the gonadotropin-releasing hormone promoter (165-169). The POU domain of Oct-1 and the DBD of GRa interact with each other in vitro. NF-1, which also stimulates the MMTV promoter, interacts with GRa and cooperatively modulates the activity of this promoter (169,170). The transcriptional activity of GATA-1, a transcription factor that plays an essential role in the erythroid differentiation is repressed by GRa at the experimental cellular levels. NTD of GRa is necessary for the interaction with GATA-1 (171). The CAAT/Enhancer-binding Protein (C/EBP) is one of the bZip family transcription factors that have diverse effects on proliferation, development and differentiation of embryonic cells/fetus, and influence functions of the liver, adipose, immune and hematopoietic tissues in adults (172). C/EBPb, also known as the nuclear factor IL-6 (NF-IL6), synergistically stimulates transcription of GRa on the composite promoter that contains both C/EBPb- and GRa-binding sites (173). GRa, on the other hand, enhances C/EBPb activity on its simple responsive promoter (173,174). Direct in vitro binding of these proteins has been reported.


GENOME-WIDE TRANSCRIPTIONAL REGULATION BY GRa


Chromatin-based Regulation of GRa Transcriptional Activity


GRa regulates expression of glucocorticoid-responsive genes by influencing their transcriptional activity through direct or indirect interaction with their enhancer/promoter regions. In eukaryotic cells, DNA is packed into chromatin by associating with numerous nuclear proteins, such as histones and chromatin-modifying factors (175,176). Double-stranded DNA wraps by 1.67 turns around a histone octamer that consists of 2 copies of each core histones H2A, H2B, H3 and H4, and forms the smallest structural unit called “nucleosome”, which is further compacted into a higher order chromatin. Nucleosome-associated histones possess a highly flexible N-terminal tail whose chemical modifications, such as acetylation and methylation at specific lysine (K) residues, modulate accessibility of GRa to its target DNA sequences residing in chromatin. Chromatin is further packed into the 3-dimensional structure called topologically associated domains (TADs) in which several protein-coding gene bodies, promoters and regulatory elements interact with each other through formation of chromatin looping, and their modes of interaction alter in different cellular circumstances. A poly-ZNF protein CTCF plays a central role in the formation of chromatin looping by cooperating with the cohesion protein complex and other accessory factors, including the transcription factor IIIC (TFIIIC), ZNF143, PR domain zinc finger protein 5 (PRDM5) and chromodomain helicase DNA-binding protein 8 (CHD8) (147,149) (Figure 13). In addition to CTCF, interaction of transcription factors, such as between GRa and NF-kB, influences formation of chromatin looping possibly through cooperation with CTCF (177). A study using a new technique called Hi-C (high throughput 3C) further revealed that even chromosomes are packed into the nucleus with some orders shared by many tissues/organs (178,179).

Figure 13. Organization of the topologically associated domain (TADs) and chromatin looping promoted by CTCF for differential expression of glucocorticoid-responsive genes. CTCF organizes 3-dimensional chromatin interaction for the formation of TADs and chromatin looping, in cooperating with the cohesion protein complex and other component proteins. Chromatin loop-forming activity of CTCF is essential for differential use of enhancers/promoters by GR-responding genes, and underlies organ/tissue-specific actions of glucocorticoids. Modified from (147).

In rat liver, more than 11,000 GR-binding sites (GBSs) are identified primarily at intergenic distal and intronic regions, but only ~10% of GBSs are located in the promoter area (~2.5 kbs from the transcription start site: TSS), consistent with the fact that distantly located enhancer regions can communicate with the gene promoter through gene looping (180,181). Interestingly, ~80-90% of GRa-accessible sites exists prior to glucocorticoid addition/GRa stimulation, while their distribution is highly tissue-specific, indicating that local tissue factor(s) mainly determine(s) the sets of genes responsive to glucocorticoids by regulating chromatin accessibility (180). Indeed, some transcription factors, such as C/EBPb, AP-1 and FoxA1, have their binding sites close to GBSs (thus, composite sites) and act as tissue-specific priming factors (or pioneer factors) for the access of GRa to GBSs, respectively in murine mammary epithelial cells, rat liver and human prostate cancer cells (181-183). These pre-existing GBSs are enriched with CpG islands and are generally demethylated, further suggesting that DNA methylation also contributes negatively to the opening of GBSs (184). However, a study revealed that GRa can act as a pioneer factor for several other transcription factors previously reported to be pioneer factors for GRa (185). This report indicates that GRa can function both as a pioneer and a dependent factor based on the composition of the binding sites in the regulatory elements and/or local chromatin conditions.


Influence of Gene Variation (Single Nucleotide Polymorphisms: SNPs) to Tissue Glucocorticoid Responsiveness


Humans demonstrate variation in their responsiveness to glucocorticoids (sensitivity to glucocorticoids), which then influences the development of numerous disorders, such as hypertension, obesity, diabetes mellitus, osteoporosis and ischemic heart diseases, asthma and acute lymphoblastic leukemias. However, genetic background(s) that explain(s) such difference in glucocorticoid responsiveness among human subjects is(are) not known. To access this problem, variation of the single nucleotide polymorphisms (SNPs) in over 100 individuals was compared with glucocorticoid-induced mRNA expression profiles in subjects’ EBV-transformed lymphocytes and their secretion of some cytokines (186). The results revealed that the SNPs located close (~100 kbps) to the glucocorticoid-responsive genes were associated with variation in glucocorticoid responsiveness of their own mRNA expression, while SNPs located in the transcription factors known to regulate GRa transcriptional activity did not show statistically significant differences. These results suggest that the genetic areas close to glucocorticoid-responsive genes, possibly containing enhancer regions and/or other gene regulatory sequences, influence primarily the responsiveness of mRNA expression of their associated genes to glucocorticoids, rather than those found in the protein-coding sequence of GRa, its partner molecules or glucocorticoid-responsive genes themselves. The above results on the genetic factors determining individual glucocorticoid sensitivity are consistent with recent findings obtained in the genome-wide association studies (GWAS) in which ~70% of SNPs associated with susceptibility to common disorders and traits (thus individual variation) are found in the gene regulatory regions but not in the protein-coding sequences (187).


Tissue/Organ-specific Actions of GRa Revealed by GR Gene Knockout/Knockin Studies


Modifications of gene expression with gene knockout (deletion of existing genes) are tremendously helpful for understanding physiologic actions of endogenous GRa in glucocorticoid-target tissues. Whole body GR gene knockout revealed that GR deficient pups die just after birth due to respiratory insufficiency caused by lack of lung surfactant, indicating that GR action is essential for survival (188). By using the same mice, GR is also shown to be required for gluconeogenesis upon fasting and erythropoiesis under stress (such as erythrolysis or hypoxia) (189,190). Mice harboring forebrain-specific GR gene knockout developed a phenotype mimicking major depressive disorder in humans, including hyperactivity and impaired negative regulation of the HPA axis, indicating that alteration of GRa actions in the forebrain plays a causative role in the disease onset of major depressive disorder (191). Paraventricular nucleus (PVN) of the brain hypothalamus is the central component of the HPA axis (1), thus GR gene knockout mice in this brain region was developed and their HPA axis was evaluated. The results indicated that PVN GR is required for negative regulation of the HPA axis at a basal condition and under stress (192). GR gene knockout mice specific in the noradrenergic neurons, components of the neural circuit mediating the adaptive stress response together with the HPA axis, were also created (1,193). These mice demonstrated depressive- and anxiety-like behavior upon stress with specificity to duration and gender, indicating that GR in the noradrenergic neurons plays an important role in stress response and associated behavioral changes in addition to its actions in the HPA axis. In mice with cardiomyocyte/vascular smooth muscle cell-specific GR gene knockout, fetal heart function is impaired and causes generalized edema in embryonic day (E) 17.5. Histologically, disorganized myofibrils and cardiomyocytes are found in fetal heart, while altered expression of the genes involved in contractile function, calcium handling and energy metabolism are observed. These results suggest that GRa actions in the cardiomyocytes and vascular smooth muscle cells are important for proper functioning and maturation of the fetal heart (194). GR gene knockout specific in the vascular endothelial cells revealed that GRa in this tissue mediates a tonic effect of glucocorticoids on blood pressure, possibly by supporting autocrine or paracrine activity of this tissue for releasing vasoactive mediators in response to glucocorticoid treatment (195). GRa in this tissue is also required for the protective response against sepsis by conferring glucocorticoid-mediated suppression of cytokine and nitric oxide production (196). Challenge of vascular endothelial cell-specific GR knockout mice with LPS also revealed that GRa in this tissue is required for survival of animals against this compound by appropriately suppressing circulating levels of inflammatory cytokines (TNFa and IL-6) and release of the nitric oxide (197), indicating the important actions of the vascular endothelial cell-residing GRa for controlling otherwise overshooting inflammatory response. T-lymphocyte-specific GR gene knockout mice revealed that GRa-mediated immune suppression mainly through Th1 lymphocytes is also necessary for survival of the mice against Toxoplasma gondii infection (198). Uterine-specific GR knockout mice generated with the Cre-recombinase expressed under the PR gene promoter revealed that uterine GRa is required to establish the local cellular environment necessary for maintaining normal uterine biology and fertility (199). The GR gene knockout specific to testicular Sertoli cell identified that GRa in these cells is required to maintain normal testicular Sertoli/germ cell numbers and circulating gonadotropin levels, as well as optimal Leydig cell maturation and steroidogenesis, thus GRa in these cells is required for supporting normal male reproduction (200).


By using a knockin procedure (replacement of wild type genes with their mutants), physiologic importance of the specific GRa functions associated with introduced mutations was evaluated. For example, knockin of the mutant GRa defective in binding to classic GREs (GRdim harboring A458T replacement, which is inactive in transactivation of glucocorticoid-responsive genes harboring GREs, but active in transrepression through protein-protein interaction with other transcription factors), revealed that transactivational activity of GRa is not essential for survival (112). Indeed, mice harboring GRdim demonstrated partially active HPA axis, full activity in glucocorticoid-mediated development of adrenal medulla, and defective glucocorticoid-mediated thymocyte apoptosis. However, the GRdim mutant receptor was subsequently shown to bind GREs of the N-methyltransferase (PNMT) gene, which is a rate-limiting enzyme for the production of catecholamines in the adrenal medulla, and to activate strongly the expression of this gene (201). Thus, the GRdim mutation cannot completely abolish transactivational activity of GRa, further suggesting that this activity of GRa may be required for survival. In addition, the effect of this mutant receptor on recently identified nGREs is not known, making the original conclusion elusive.


FACTORS THAT MODULATE GR ACTIONS


New Ligands with Specific Activities


Glucocorticoids have two major activities on the transcription of glucocorticoid-responsive genes, namely transactivation and transrepression (202). The former activity is mainly mediated by binding of GRa to its DNA responsive sequences in the promoter region of glucocorticoid-responsive genes and stimulating the transcription of downstream protein-coding sequences. Mechanisms underlying the latter activity are more complex, mostly mediated by suppression of other transcription factor activities by GRa. At pharmacologic levels, the transactivation activity is well correlated with side effects of glucocorticoids, such as glucose intolerance and overt diabetes mellitus, central obesity, osteoporosis and muscle wasting (202). On the other hand, the transrepressive activity of glucocorticoids is associated mostly with their beneficial therapeutic effects, such as suppression of the inflammation and immune activity, and induction of apoptosis of several neoplastic cells/tissues. Thus, significant efforts have been put to produce dissociated glucocorticoids with transrepression but no transactivation activity (202).


RU24858, RU40066 and RU24782 were the first steroids reported to have such selectivity, having an efficient inhibitory effect on AP-1- and NF-kB-mediated gene induction with reduced transactivation activity in vitro (203). However, they did not have any therapeutic advantage when they were used in vivo. Compound Abbott-Ligand (AL)-438, a derivative of a synthetic progestin scaffold, binds GRa with similar affinity to that of prednisolone and shows the activity equivalent to prednisolone in suppressing paw-edema in a rat experimental model (204). AL-438 does not increase circulating glucose levels and bone absorption in contrast to prednisolone, indicating that this compound is a promising selective glucocorticoid. ZK216348, the (+)-enanitomer of the racemic compound ZK209614, binds GRa and demonstrates anti-inflammatory activity comparable to that of prednisolone under both systemic and topical applications with much less unwanted effects on blood glucose and skin atrophy (205). This compound, however, binds PR and AR in addition to GRa, and does not show clear selectivity between transactivation and transrepression in vitro. C108297 functions as a GRa modulator through induction of unique interaction profiles of GRa to some splice variants of the p160 coactivator SRC1. This compound potently enhances GR-mediated memory consolidation, partially suppresses hypothalamic expression of the corticotropin-releasing hormone (CRH), and antagonizes to GR-mediated inhibition of hippocampal neurogenesis (206). Cortivazol, a pyrazolosteroid, induces nuclear translocation of GRa and stimulates GRa-induced transcriptional activity (207). Another compound, AL082D06 (D06), the tri-aryl methane, specifically binds GRa with a nano-molar affinity and acts as an antagonist for GRa but not for other SRs, in contrast to RU 486 (208). CORT-108297 acts also as a competitive GRa antagonist with high affinity to GRa (Ki 0.9 nM), but almost 1000-fold lower affinity to other SRs, PR, ER, AR and MR (209,210).


Two new non-steroidal GRa ligands, GSK47867A and GSK47869A, act as potent agonists with prolonged effects (211). These compounds bind the ligand-binding pocket of GRa with high affinity and induce both transactivational and transrepressional activities at concentrations ~10-50 times less than those of dexamethasone. Interestingly, GSK47867A and GSK47869A induce very slow GRa nuclear translocation and prolonged nuclear retention that leads to delayed but prolonged activation of the receptor. In computer-based structural simulation, these compounds induce unique GRa LBD conformation at its hsp90-binding site, which may underlie their extended GRa activation by causing defective interaction to hsp90 and altered intracellular circulation of GRa. By employing high throughput screening of 3.87 million compounds with the GR fluorescence polarization binding assay, heterobiaryl sulfonamide 2 was recently identified as a potent non-steroidal GR antagonist (212). Non-steroidal compounds mapracorat (also known as BOL-303242 and ZK245186) and the plant origin ginsenide Rg1 function as selective agonists with strong anti-inflammatory effects and a better side effect profile (213,214).


Compound A (CpdA), a stable analogue of the hydroxyl phenyl aziridine precursor found in the Namibian shrub Salsola tuberculatiformis Botschantzev, exerts anti-inflammatory activity by down-regulating TNFa-induced pro-inflammatory gene expression through inhibition of the negative effects of GRa on NF-kB, but demonstrates virtually no stimulatory activity on GRa-induced transactivation (215). This compound also suppresses similarly to dexamethasone the transcriptional activity of the T-bet transcription factor, a master regulator of Th1-mediated immune response, and reduces production of the Th1 cytokine interferon g from murine primary T-cells (216). By sparing AP-1-induced transcriptional activity and subsequent activation of the JNK/MAPK signaling pathway, CpdA does not influence epithelial cell restitution, an indicator of wound healing, in contrast to regular glucocorticoids (217,218). Thus, CpdA appears to be a dissociated compound of plant origin retaining the beneficial anti-inflammatory effect of glucocorticoids, being in part devoid of some of the known side effects of these compounds. CpdA also preserves the anti-cancer effect of glucocorticoids in human T-, B- and multiple myeloma cells, and cooperates with the anti-leukemic proteasome inhibitor Brtezomib in suppressing growth and survival of these cells (219). This compound is also beneficial for the treatment of bladder cancer by suppressing cell growth by promoting transrepressive actions of GRa and partially by acting as an AR antagonist (220). CpdA does not allow GRa to bind single GRE (half-site) sites in contrast to glucocorticoids, and this activity of CpdA is beneficial for its use in the treatment of triple-negative breast cancer, as single GRE-mediated gene regulation by glucocorticoids is associated with development of chemotherapy resistance (221).


Industrial chemicals are known to influence actions of several SRs, and are major threats for the life of living organisms including humans by interfering with the physiological actions of these receptors (222,223). Recent screening of these compounds using MDA-kb2 human breast cancer cells identified bisphenol Z and its analog bis[4-(2-hydroxyethoxy(phenyl)sulfone (BHEPS) as GR agonists, binding to the ligand-binding pocket of GRa and by shifting the helix-12 to the antagonist conformation in the structural simulation (224). Phthalates, ubiquitous environmental pollutants known for their adverse effects on health, bind GRa and other ketosteroid receptors, such as AR and PR, with high binding potencies comparable to natural ligands, suggesting that they may alter transcriptional activities of these receptors (225). Although underlying mechanism(s) are still unknown, chronic low doses of ingested petroleum can alter tissue expression levels of GRa in house sparrows, and modulates the glucocorticoid-signaling system and the HPA axis (226). Tolylfluanid, a commonly detected fungicide in Europe can induce biological changes that recapitulate many features of the human metabolic syndrome in part through modulating the GRa signaling pathway in male mice (227).


In addition to the above-explained compounds with agonistic or antagonistic actions on GRa, expanding numbers of new compounds with such activities have been identified, including: 2-aryl-3-methyloctahydroohenanthrene-2,3,7-trils (228), C118335 (229), 6-(3,5-dimethylisoxazol-4-yl)-2,2,4,4-tetramethyl-2,3,4,7,8,9-hexahydro-1H-cyclopenta[h]quinolin-3-one 3d (QCA-1093) (230), several compounds containing “diazaindole” moieties (231), heterocyclic GR modulators with a 2,2-dimethyl-3-phenyl-N-(thiazol or thiadiazol-2-yl) propanamide core (232), LLY-2707 (233), trierpenes (alisol M 23-acetate and alisol A 23-acetate) (234), GSK866 analogs UAMC-1217 and UAMC-1218 (235), AZD9567 (236), 1,3-benzothiazole analogs (237), 20(R, S)-protopanaxadiol and 20(R, S)-protopanaxatriol (238) and β-Sitosterol (239).


EPIGENETIC MODULATION OF GRa


Acetylation and CLOCK-mediated Counter Regulation of Target Tissue Glucocorticoid Action against Diurnally Fluctuating Circulating Glucocorticoids


All SRs including GRa are acetylated by several acetyltransferases, such as p300, p/CAF and Tip60, and have common acetylation sites in a consensus amino acid motif, KXKK, located in their hinge region (240-242). The human GRa is acetylated at lysine 494 and 495 within an acetylation motif also located in its hinge region, and was reported to be deacetylated by the HDAC2, an effect that is required for suppression of NF-kB-induced transcriptional activity by the activated GRa (243) (Figure 14). This finding indicates that acetylation of the GRa at these lysine residues attenuates the repressive effect of GRa on this transcription factor. In agreement with these results, we recently found that the Clock transcription factor acetylates GRa at the multiple lysine cluster that includes lysines 494 and 495, and represses GRa-induced transcription of several glucocorticoid-responsive genes (244). Clock, the “circadian locomotor output cycle kaput”, and its heterodimer partner “brain-muscle-arnt-like protein 1” (Bmal1), belong to the basic helix-loop-helix (bHLH)-PER-ARNT-SIM (PAS) superfamily of transcription factors, and play an essential role in the formation of the diurnal oscillation rhythms of the circadian CLOCK system (245). The CLOCK system, located in the suprachiasmatic nucleus (SCN) of the brain hypothalamus, acts as the “master” oscillator and generator of the body’s circadian rhythm, while the peripheral CLOCK system, virtually distributed in all organs and tissues including the CNS outside the SCN, acts generally as a “slave” CLOCK under the influence of the central SCN CLOCK. The Clock transcription factor shares high amino acid and structural similarity with the activator of thyroid receptor (ACTR), a member of the p160-type nuclear receptor coactivator family with inherent histone acetyltransferase activity, and thus, has such an enzymatic function (246).

Figure 14. Distribution of the amino acid residues of the human GR susceptible to acetylation, phosphorylation, ubiquitination or SUMOylation. Human GR has 4 acetylation sites (lysines: K at amino acid position 480, 492, 494 and 495, shown with “A”), at least 5 phosphorylation sites (serines: S at amino acid position 45, 203, 211, 226 and 395, shown with “P”), 1 ubiqitination site (Lysine: K at amino acid position 419, shown with “U”) and 3 SUMOylation sites (Lysines: K at amino acid position 277, 293 and 703, shown with “S”).

Clock physically interacts with GRa LBD through its nuclear receptor-interacting domain (NRID) in its middle portion, and acetylates human GRa at amino acids 480, 492, 494 and 495. Acetylation of GRa attenuates binding of the receptor to GREs, and hence, represses GR-induced transactivation of the GRE-driven promoters (244) (Figure 15). Since the lysine residues acetylated by Clock are located in the C-terminal extension (CTE) that follows DBD and plays a role in DNA recognition by SRs (247), it is likely that acetylation of these residues reduces binding of GRa to GREs by altering the action of CTE. The part of the hinge region acetylated by Clock also overlaps with the nuclear localization signal (NL)-1 (50,244), thus it is also possible that acetylation of GRa alters nuclear translocation of this receptor. It is well known that the central master CLOCK located in SCN creates diurnal fluctuation of circulating cortisol, therefore peripheral CLOCK-mediated repression of GRa transcriptional activity in glucocorticoid target tissues functions as a local counter regulatory mechanism for oscillating circulating cortisol (248).

Figure 15. Clock/Bmal1 suppresses GR-induced transcriptional activity through acetylation. Clock physically interacts with GR LBD through its nuclear receptor-interacting domain and suppresses GR-induced transcriptional activity by acetylating with its intrinsic HAT activity a lysine cluster located in the hinge region of the GR (A) through which Clock reduces affinity of GR to its cognate DNA GREs (B). A: acetylation; Bmal1: brain-muscle-arnt-like protein 1; DBD: DNA-binding domain; GREs: glucocorticoid response elements; HR: hinge region; K: lysine residue; LBD: ligand-binding domain; NTD: N-terminal domain. From (244).

In addition to the above findings obtained in in vitro cellular systems, we examined the acetylation status of human GRa and the expression of Clock-related and glucocorticoid-responsive genes in vivo and ex vivo, using peripheral blood mononuclear cells (PBMCs) from healthy adult volunteers (249). The levels of acetylated GRa were higher in the morning and lower in the evening, mirroring the fluctuations of circulating cortisol in reverse phase. All known glucocorticoid-responsive genes tested responded as expected to hydrocortisone, however, some of these genes did not show the expected diurnal mRNA fluctuations in vivo. Instead, their mRNA oscillated in a Clock- and a GRa acetylation-dependent fashion in the absence of endogenous glucocorticoid ex vivo, indicating that circulating cortisol might prevent circadian GRa acetylation-dependent effects in some glucocorticoid-responsive genes in vivo. These findings indicate that peripheral CLOCK-mediated circadian acetylation of GRa functions as a target tissue- and gene-specific counter regulatory mechanism to the actions of diurnally fluctuating cortisol, effectively decreasing tissue sensitivity to glucocorticoids in the morning and increasing it at night (36). Indeed, in another study where we measured mRNA expression of ~190 GRa action-regulating and glucocorticoid-responsive genes in subcutaneous fat biopsies from 25 obese subjects, we found that the levels of evening cortisol were much more important than those in the morning to regulate mRNA expression of glucocorticoid-responsive genes in this human tissue (250). It appears that higher sensitivity of tissues to circulating glucocorticoids in the evening due to reduced GRa acetylation by CLOCK underlies stronger impact of evening serum cortisol levels to glucocorticoid-regulated gene expression compared to morning levels.


The circadian CLOCK system and the HPA axis regulate each other’s activity through multilevel interactions in order to ultimately coordinate homeostasis against the day/night change and various unforeseen random internal and external stressors (251,252). For example, one CLOCK transcription factor Cry2 interacts with GRa and represses its transcriptional activity (253). Furthermore, GRa binds GREs located in the promoter region of the Per1Per2 and other CLOCK components and stimulate their expression, an effect that contributes to resetting of the circadian rhythms by glucocorticoids (254,255). The peripheral CLOCK system residing in the adrenal glands contributes to the creation of circadian glucocorticoid secretion from this organ in addition to diurnally secreted ACTH from the pituitary gland (256). An important study further revealed new local factors, which also regulate circadian production of glucocorticoids in the adrenal glands: the intermediate opioid peptides secreted from the adrenal cortex influence in a paracrine fashion the amplitude of the serum corticosterone oscillations in mice through the C-X-C motif chemokine receptor 7 (CXCR7), a b-arrestin-biased G-protein-coupled receptor expressed on the adrenocortical cells (257).


Based on the above-indicated multilevel interaction between the CLOCK system and the HPA axis, uncoupling of or dysfunction in either system alters internal homeostasis and causes pathologic changes virtually in all organs and tissues, including those responsible for intermediary metabolism and immunity (248,251,252). Disrupted coupling of cortisol secretion and target tissue sensitivity to glucocorticoids may account for (1) development of central obesity and the metabolic syndrome in chronically stressed individuals, whose HPA axis circadian rhythm is characterized by blunting of the evening decreases of circulating glucocorticoids, as a result of enhanced input of higher centers upon the hypothalamic PVN’s secretion of CRH and arginine vasopressin (AVP); and (2) increased cardiometabolic risk and increased mortality of night-shift workers or subjects exposed to frequent jet-lag because of traveling across time zones (248,258). In addition, given that tissue sensitivity to glucocorticoids is increased in the evening as mentioned above (thus, evening cortisol levels have stronger impact to gene expression than those in the morning), supplemental administration of high-dose glucocorticoids at night for the treatment of adrenal insufficiency or congenital adrenal hyperplasia may increase a possibility of glucocorticoid-related side effects. Furthermore, administration of glucocorticoids at a specific period of the circadian cycle might increase their pharmacological efficacy, while at the same time reducing their unwanted side effects, because CLOCK differentially regulates transactivational and transrepressive actions of glucocorticoids, which are respectively correlated with side-effects and beneficial anti-inflammatory activities of these compounds used at pharmacological concentrations (258).


Phosphorylation


GRa has several phosphorylation sites and all of them are located in the NTD (20,259) (Figure 14). Classically, GRa is phosphorylated after binding to its ligand and this may determine target promoter specificity, cofactor interaction, strength and duration of receptor signaling and receptor stability (259,260). There are several kinases that phosphorylate GRa in vitro and in vivo (261). Yeast cyclin-dependent kinase p34CDC28 phosphorylates rat GRa at serines 224 and 232, which are orthologous to serines 203 and 211 of the human GRa, with the resultant phosphorylation enhancing rat GRa transcriptional activity in yeast (262). These residues are also phosphorylated after binding of the GRa with agonists or antagonists and the phosphorylated receptor shows reduced translocation into the nucleus and/or altered subcellular localization in mammalian cells (259,263). The p38 MAPK phosphorylates serine 211 of the human GRa, enhances its transcriptional activity and mediates GRa-dependent apoptosis (264). p38 MAPK and JNK also phosphorylate serine 226 of the human GRa and suppress its transcriptional activity by enhancing nuclear export of the receptor (63). Modulation of the molecular interactions between GRa AF-1 and cofactors through phosphorylation of these serine resides underlies in part the transcriptional regulation of this receptor by these kinases, as these serines are located within the AF-1 domain (265). Threonine 171 of the rat GRa is also phosphorylated by p38 MAPK and glycogen synthase kinase-3 (GSK3): phosphorylated rat GRa demonstrates reduced transcriptional activity in yeast and human cells, however, the human GRa does not have a threonine residue equivalent to that of the rat GRa (266,267). On the other hand, one GSK3 family protein, GSK3b, phosphorylates human GRa at serine 404 and modulates hGRa transcriptional activity including its repressive effect on NF-kB (268).


Several serine/threonine phosphatases, such as the protein phosphatase 2A (PP2A) and protein phosphatase 5, dephosphorylate human GRa at serine 203, 211 and/or 226, possibly through their association with GRa LBD (269,270). Stimulation of A549 human respiratory epithelial cells with b2 adrenergic receptor agonists increases PP2A, which in turn increases glucocorticoid sensitivity by dephosphorylating GRa at serine 226 (271). However, PP2A also regulates indirectly GRa phosphorylation by increasing dephosphorylation of JNK and subsequent activation of this kinase, as JNK directly phosphorylates GRa (272).


The cyclin-dependent kinase 5 (CDK5) physically interacts with the human GRa through its activator component p35, phosphorylates GRa at multiple serines including those at 203 and 211, and modulates GRa-induced transcriptional activity by changing accumulation of transcriptional cofactors on GRE-bound GRa (273). CDK5 and p35 are expressed mainly in neuronal cells and play important roles in embryonic brain development. Aberrant activation of CDK5 in CNS also plays a significant role in the pathogenesis of neurodegenerative disorders, such as Alzheimer’s disease and amyotrophic lateral sclerosis (274). We reported that, in addition to GRa, CDK5 phosphorylates MR and strongly suppresses its transcriptional activity (275). In brain regions, such as hippocampus and amygdala, which do not express 11b-HSD2, MR functions as a physiologic receptor for circulating glucocorticoids, and activation/suppression of MR plays an important role in glucocorticoid-related memory deficits and alterations in mood and cognition (276). Indeed, MR mediates enhancement of neuronal excitability, stabilization of synaptic transmission, and stimulation of long-term potentiation (LTP) in CA1 hippocampal cells, while MR activation is protective to hippocampal granular cell neurons. Thus, it is possible that CDK5-mediated regulation of MR might underlie development of glucocorticoid-associated pathologic conditions, such as neurodegenerative disorders and mood disorders (277,278). We examined changes of the CDK5 activity in mice under stress, and found that acute and chronic stressful stimuli differentially regulate the kinase activity together with contemporaneous alteration of the GRa phosphorylation in a brain region-specific fashion, indicating that CDK5 and its regulatory effects on GRa is an integral component of the stress response and mood disorders (279).


We also found that adenosine 5’ monophosphate-activated protein kinase (AMPK), a central regulator of energy homeostasis that plays a major role in appetite modulation and energy expenditure, indirectly phosphorylates human GRa at serine 211 through activation of p38 MAPK (280). Through phosphorylation of GRa, AMPK regulates glucocorticoid actions on carbohydrate metabolism, modifying transcription of glucocorticoid-responsive genes in a tissue- and promoter-specific fashion. Indeed, activation of AMPK in rats reverses glucocorticoid-induced hepatic steatosis and suppresses glucocorticoid-mediated stimulation of glucose metabolism. These findings indicate that the AMPK-mediated energy control system modulates glucocorticoid action at target tissues, and activation of AMPK could be a promising target for developing pharmacologic interventions in metabolic disorders in which glucocorticoids play major pathogenetic roles.


The v-akt murine thymoma viral oncogene homolog 1 (AKT1) or protein kinase B, another serine-threonine kinase known to regulate cell proliferation and survival, and aberrantly activated in various malignancies including acute leukemia, also phosphorylates human GRa at serine 134, which is located in NTD of this receptor (281). This phosphorylation of GRa retains the receptor in the cytoplasm through which activated AKT1 develops glucocorticoid resistance in acute leukemic cells, a major determinant for the prognosis of leukemic patients (281). AKT1 cooperates with phospho-serine/threonine-binding proteins 14-3-3s for regulating the transcriptional activity of GRa with 2 distinct mechanisms, one through segregation of GRa in the cytoplasm upon phosphorylation of serine 134 by AKT1 and subsequent association of 14-3-3 to GRa, and the other through direct modulation of GRa transcriptional activity in the nucleus (65). For the latter, AKT1 and 14-3-3 are attracted to DNA-bound GRa, accompanied by AKT1-dependent p300 phosphorylation, histone 3 (H3) serine (S) 10 (H3S10) phosphorylation and H3K14 acetylation at the DNA site in which 14-3-3 acts as a molecular scaffold (65). The above findings suggest that specific inhibition of the AKT1/14-3-3 activity on the cytoplasmic retention of GR but sparing the activity inside the nucleus may be a promising target for the treatment of glucocorticoid resistance observed in acute leukemia. Furthermore, they may also provide an explanation to somewhat conflicting findings previously reported for the actions of 14-3-3s on GRa (64,268,281,282).


Ubiquitination


The ubiquitin/proteasome pathway plays important roles in transcriptional regulation promoted by numerous trans-acting molecules. NRs, including GRa, ERs, PR, TRs, RARs and PPARs, as well as other transcription factors, such as p53, cJun, cMyc and E2F-1, are ubiquitinated and subsequently degraded by the proteasome (57,283). The transcriptional intermediate molecules, such as NR coactivators, chromatin remodeling factors, and some chromatin components, such as histone H1 and high mobility group (HMG) proteins, are also ubiquitinated and lysed by the proteasome (57,283,284). Moreover, the proteasome interacts with the C-terminal tail of the RNA polymerase II and is directly associated with the promoter regions of several genes, influencing their transcriptional activities (285). Thus, ubiquitination and subsequent processing of these molecules by the proteasome appear to regulate the transcriptional activity of GRa, possibly by facilitating rapid turnover of promoter-attracted and -associated GRa, ultimately down-regulating the transcriptional activity of this receptor. Indeed, mouse GRa contains a PEST motif at amino acids 407-426 (399-419 in human GRa) through which the ubiquitin-conjugating enzyme E2 and the ubiquitin-ligase enzyme E3 recognize their substrates (286). The lysine residue of the mouse GRa located at amino acid 426 (419 in human GRa) appears to be ubiquitinated, as inhibition of ubiquitination by compound MG-132 enhances the transcriptional activity of wild type GRa, while the mutant receptor with lysine to alanine replacement at amino acid 426 demonstrates elevated transcriptional activity and is insensitive to MG-132 (286) (Figure 14). Ubiquitination of GRa also influences motility of the receptor inside the nucleus, which was evaluated with the fluorescence recovery after photobleaching (FRAP) technique, possibly by changing association of the receptor to the nuclear matrix through ubiquitination (58,287,288).


SUMOylation


GRa is also SUMOylated. SUMOylation is the reaction conjugating the small ubiquitin-related modifier (SUMO) peptide (~100 amino acid peptide with molecular mass of ~11 kDa) to substrate proteins and conducted by an enzymatic cascade similar to those of ubiquitination but specific to SUMOylation (289). The human GRa has three SUMOylation sites, at lysines 277, 293 and 703 (290) (Figure 14). The first 2 sites are located in the NTD and act as major SUMOylation sites, while the last site is positioned in the LBD. SUMOylation of the former 2 sites (K277 and K293) suppresses GRa-induced transcriptional activity of a promoter containing multiple GREs, possibly by influencing the synergistic effect of multiple GRs bound on this promoter (291-293). In contrast, SUMOylation of the 3rd site (K703) enhances GRa-induced transcriptional activity, which is further enhanced by RSUME (RWD-containing SUMOylation enhancer) by changing attraction of the GRIP1 coactivator (294).


The death domain-associated protein (DAXX), a protein mediating the Fas-induced apoptosis through interacting with the death domain of Fas, was postulated to mediate SUMOylation-induced repression of GRa transcriptional activity (295). Other molecules, such as HDACs and the protein inhibitors of activated STAT (PIAS) family, which interact with SUMOylated proteins including GRa (296,297), might also participate in SUMO-mediated repression of GRa transcriptional activity, as the DAXX effect appears to be cell type- and/or cellular context-specific (298). SUMOylation of GRa is necessary for GRa-induced transrepression through the nGREs (an inverted quadrimeric palindrome separated by 0-2 nucleotide, see Section 5. ACTIONS OF GR, C. Emerging Concept on GRa-mediated Transcriptional Repression) by facilitating the formation of a complex consisting of SUMOylated GRa, SMRT/NCoR1 and HDAC3 (299). It is known that phosphorylation of rat GR at amino acid position 246 (226 in the human GRa) by JNK facilitates SUMOylation of the receptor and regulates GRa-induced transcriptional activity in a target gene-specific fashion (291).


11b-Hydroxysteroid Dehydrogenases (11b-HSDs)


There are 2 types of 11b-hydroxysteroid dehydrogenases (11b-HSDs), type 1 and 2 (11b-HSD1 and 2). 11b-HSD1 catalyzes the conversion of the inactive cortisone to active cortisol, thus increases intracellular cortisol levels potentially contributing to tissue hypersensitivity to glucocorticoids. 11b-HSD1 is widely expressed, particularly in the liver, but also in the lung, adipose tissue, blood vessels, ovary and CNS (300). The transgenic mice over-expressing 11b-HSD1 in adipose tissues develop insulin-resistant diabetes mellitus, significant accumulation of visceral fat and hyperlipidemia, and increased systemic blood pressure, indicating that this enzyme may play a role in the development of visceral obesity-related metabolic syndrome by increasing availability of local cortisol in adipose tissues (301,302). 11b-HSD2, on the other hand, catalyzes the conversion of active cortisol into inactive cortisone, and is expressed in the classic mineralocorticoid-responsive tissues, such as kidney, colon and sweat glands (300). This enzyme enables these tissues to respond to the circulating mineralocorticoid aldosterone, protecting MR from binding to the excess amounts of circulating cortisol (300).


Chaperones and Co-chaperones


GRa forms a heterocomplex with several heat shock proteins (hsps), including hsp90, hsp70, hsp40 and hsp23 (69). These proteins bind many proteins and help their correct assembly and folding, therefore they are called as chaperones. In addition to hsps, there is an additional protein group called co-chaperones, such as Hop (hsp70-hsp90 organizing protein), SGTA (small glutamine-rich tetratricopeptide repeat-containing protein a), FKBP51 (FK506-binding protein 51) and FKBP52, which support folding function of hsps by forming a protein complex with the latter molecules (69). Hsps modulate the transcriptional activity of GRa by influencing maintenance, activation and intracellular circulation of this receptor (303). Specifically, hsp90, hsp70 and hsp40 organize proper folding of the GRa protein, and are required for the maintenance of its high affinity state against ligand where interaction of hsp90 to Hop as well as that between hsp70 and SGTA are required (304,305). Upon binding of the GRa to glucocorticoids, hsp90 helps the receptor to translocate close to the nuclear pore in the side of the cytoplasm by facilitating GRa’s association to microtubules through FKBP52. After GRa goes through the nuclear pore complex and enters into the nucleus, hsp90 regulates GRa-induced transactivation negatively, possibly by reducing the association of GRa to DNA GREs (306). However, there are conflicting reports indicating that hsp90 stabilizes the association of ligand-bound GRa to DNA and helps GRa stimulating the transcriptional activity of glucocorticoid-responsive genes (307). These chaperones also protect GRa from the degradation mediated by the ubiquitin-proteosomal pathway in the nucleus (308). Receptor-associating protein 46 (RAP46), another co-chaperone associated with several hsps, synergizes with hsp70 to regulate GRa transactivation negatively (309). Impact of co-chaperones on in vivo actions of GRa was evaluated in humans and mice. FKBP51 is a co-chaperon known as a negative regulator of GRa activity by reducing the latter’s affinity to glucocorticoids, and nucleotide variations in its encoding gene FKBP5 are associated with development of mood disorders and anxiety in humans possibly by skewing the GRa-signaling system (310,311). FKBP51 knockout mice demonstrate reduced basal activity of the HPA axis, a blunted response to acute stress and an enhanced recovery from this challenge (312).


Chemical Compounds


There are several chemical compounds that modulate GRa activity. 2,3,7,8-Tetrachlorodibenzo-p-dioxin (TCDD), a wide-spread environmental contaminant that produces adverse biologic effects, such as carcinogenesis, reproductive toxicity, immune dysfunction, hepatotoxicity and teratogenesis, suppresses GRa-induced transactivation possibly by reducing the ligand-binding affinity of GRa (313-315). Geldanamycin, a benzoquinone ansamycin, which specifically binds hsp90 and disrupts its function, suppresses GRa-induced transactivation by inhibiting the translocation of GRa into the nucleus (308,316). GRa is also regulated by the cellular redox state. Thioredoxin, a compound accumulated during oxidative stress, enhances GRa transactivation, most likely due to functional replenishment of GRa (317). Ursodeoxycholic acid (UDCA), one of the hydrophilic bile acids, which acts as a bile secretagogue, cytoprotective agent and immunomodulator, and is used for the treatment of various liver diseases including primary biliary cirrhosis, induces translocation of GRa into the nucleus and causes GRa-mediated inhibition of NF-kB transactivation (318). Mizoribine (4-carbamyl-1-b-D-ribofurano-sylimidazolium-5-olate), an imidazole nucleotide with immunosuppressive activity binds to 14-3-3 and enhances 14-3-3/GRa interaction, which may further potentiate 14-3-3’s effect on GRa transactivation (319). For more details of the GRa/14-3-3 interaction, please see Section FACTORS THAT MODULATE GR ACTIONS, Epigenetic Modulation of GRa, b Phosphorylation.


NON-CODING RNAS


Human genome expresses numerous non-protein-coding RNAs in addition to protein-coding mRNAs. Indeed, over half of the genome sequence expresses RNAs in both directions either as single- or double-stranded RNAs (320,321). Classic examples of the former RNAs are ribosomal RNAs and transfer RNAs, while several distinct new members have been identified recently (322). Depending on their size, non-coding (nc) RNAs are empirically categorized as short (~200 bs) or long (>200 bs) ncRNAs. The former family includes micro (mi) RNAs, small interfering (si) RNAs, small nucleolar (sno) RNAs, piwi (pi) RNAs and transcription start site (TSS)-associated RNAs, while the latter consists of long intergenic (linc) RNAs, enhancer-associated (e) RNAs, exon-encoding long ncRNAs, circular (c) RNAs, promoter-associated RNAs and others. ncRNAs are also produced from protein-encoding mRNAs through nuclease digestion, such as 3’ UTR RNAs (323). Recently, some of these distinct classes of ncRNAs have been revealed to regulate mRNA/protein degradation and transcriptional activity of GRa and other NRs. In this subsection, new findings on miRNAs and long ncRNAs will be discussed.


Micro (mi) RNAs


miRNAs are single-stranded, ~22 b-long RNAs transcribed mainly by the RNA polymerase II either from their own genes or from the intronic sequence of the protein-coding/non-coding genes (324). Transcribed precursor miRNAs are processed by multiple reactions including digestion by the RNase III enzyme Dicer, and are liberated as mature forms into the cytoplasm. miRNAs are incorporated as binding modules for target mRNAs into the RNA-induced silencing complex (RISC), a multi-protein machinery containing Dicer, Argonaut (AGO), human immunodeficiency virus (HIV)-transactivating response RNA (TAR)-binding protein (TRBP) and the protein activator of the interferon-induced protein kinase (PACT). Binding of the RICS complex mainly to 3’UTR of the target mRNAs through the complemental 6-8 nucleotides of miRNAs leads to degradation of associated mRNAs or to inhibition of their translation to proteins. In addition to functioning inside the produced cells, miRNAs are secreted into extracellular space/circulation as components of the exosome, and act as “hormones” by influencing the functions of distant organs and tissues (325). This unique action of miRNA was confirmed in vivo using adipocyte-specific Dicer knockout mice supplemented with exosomes obtained from normal animals (326). Human genome contains over 1,000 miRNAs and some of them are known to regulate expression of the GRa protein, while glucocorticoids/GRa regulate expression of other miRNAs.


In a study exploring the miRNAs that mediate ACTH-dependent downregulation of GRa in mouse adrenal glands, 4 miRNAs, miR-96, -101a, -142-3p and -433 induced by ACTH injection, suppress GRa protein expression by ~40% (327). miR-142-3p reduces GRa expression by directly interacting with its 3’UTR region, and attenuates responsiveness to glucocorticoids in T-cell leukemia cells (328). miR-124a, -18, -18a and -124 also attenuate GRa protein expression and regulate GRa-induced transcriptional activity in various cells and tissues (329-331). miR-29a mitigates glucocorticoid-induced bone loss in part by reducing GRa expression (332). Glucocorticoids, on the other hand, modulate expression of some miRNAs, such as miR-449a, -98, and miR-155, which in turn mediate hormonal effects of these steroids (333,334). Systematic screening of glucocorticoid-responsive miRNAs in rat primary thymocytes identified over 200 miRNAs responsive to this hormone, and some validated miRNAs regulate cell death pathway (335). In myeloma cells, glucocorticoids induce miR-150-5p, which changes expression of the genes involved in cell death and cell proliferation pathways, thus this miRNA mediates in some part the therapeutic effects of glucocorticoids on multiple myeloma (336). miR-119a-5p is also glucocorticoid-responsive miRNA that mediates anti-proliferative effects of glucocorticoids on osteoblasts by affecting the WNT signaling pathway (337).


Long Non-coding (lnc) RNAs


Several lncRNAs regulate the transcriptional activity of GRa and/or other SRs. The steroid RNA coactivator (SRA) is a prototype lncRNA that regulates the transcriptional activity of several SRs (99). SRA was originally cloned in the yeast two-hybrid assay by using NTD of the PR as bait. It enhances ligand-induced transcriptional activity of AR, ER, GRa and PR. It is found in the complex containing the p160 coactivator SRC1, and regulates transcriptional activity in part by associating with the SRA stem-loop-interacting RNA binding-protein (SLIRP) and the RISC complex (99,338,339). Recently, SRA was shown to function also as a repressor of transcription, acting as a scaffold for a repressor complex (340).


The growth arrest-specific 5 (Gas5), which is a multi-exon-containing ncRNA with a poly-A tail, is accumulated in cells whose growth is arrested due to lack of nutrients or growth factors (341). Gas5 functions as a repressor of the GRa and some other SRs (342). Gas5 sensitizes cells to apoptosis by suppressing glucocorticoid-mediated induction of several responsive genes, including those encoding the cellular inhibitor of apoptosis 2 and the serum/glucocorticoid-responsive kinase. Gas5 binds GRa DBD and acts as a decoy “GRE”, thus, it competes with DNA GREs for binding to GRa (Figure 16). These findings indicate that Gas5 is a ribo-repressor of the GRa, influencing cell survival and metabolic activities during starvation by modulating the transcriptional activity of GRa. Accumulation of Gas5 upon growth arrest or starvation was previously demonstrated in a cellular context, but a study revealed that fasting of mice also accumulates Gas5 in their metabolic organs, such as liver and adipose tissues, through modulation of the mammalian target of rapamycin (mTOR) signaling pathway, but not in the brain and immune organs including thymus and spleen (343). Since basal expression levels of Gas5 in the immune organs are much higher than those of the metabolic organs, Gas5 may have a regulatory activity on GRa in the immune system independent to the nutrient/energy availability, as evidenced by the fact that Gas5 is differentially expressed in blood leukocytes of the patients with autoimmune, inflammatory or infectious diseases (343). Moreover, Gas5 has been shown to be implicated in glucocorticoid response in children with inflammatory bowel disease (344), in multiple sclerosis (345-347), in human beta cell dysfunction (348), as well as in hematologic malignancies (349,350). Similar to Gas5, PRNCR1 (also known as PCAT8) and PCGEM1 bind AR DBD and enhance the transcriptional activity of this receptor (351). These lncRNAs are highly expressed in the prostate gland, and play a role in the androgen-dependent development of prostate cancer. Their effects on GRa have not been tested as yet.

Figure 16. Interaction model of the Gas5 RNA “GRE” to GR DBD and the molecular actions of Gas5 on GR-induced transcriptional activity. A: 3-Dimenstional structure of Gas5 “GRE”-mimic and its interaction model with GR DBD. From (342). B: Schematic model of Gas5 molecular actions on GR-induced transcriptional activity. Gas5 accumulated in response to growth arrest/starvation binds GR DBD and attenuates GR-induced transcriptional activity by competing with DNA GREs located in the promoter region of glucocorticoid-responsive genes.

THE SPLICING VARIANT GRbeta ISOFORM


The GRb isoform, which is expressed from the human GR gene through alternative use of its specific exon 9b, is known to have a dominant negative activity on classic GRa-induced transcriptional activity (21,352). This isoform was originally identified in humans, and was also reported in zebrafish, mice and rats (19,353-355). Since human (h) GRb shares the first 727 amino acids from the N-terminus with hGRa (19,356) (Figure 3), hGRb shares the same NTD and DBD with hGRa, but has a unique “LBD”. The divergence point (amino acid 727) of hGRa and hGRb is located at the C-terminal end of helix 10 in the hGRa LBD, therefore the hGRb “LBD” does not have helices 11 and 12 of the hGRa. As these helices are important for forming the ligand-binding pocket and for the creation of the AF-2 surface upon ligand binding (31), GRb cannot form an active ligand-binding pocket, does not bind glucocorticoids, and so, does not directly regulate GRE-containing, glucocorticoid-responsive gene promoters. In the absence of the hGRb “LBD”, the truncated hGR consisting of the NTD and DBD is transcriptionally active on GRE-containing promoters (357), thus the hGRb “LBD” somehow attenuates the transcriptional activity of the other subdomains of the molecule on GRE-driven promoters.


The dominant negative activity of GRb was first demonstrated in transient transfection-based reporter assays using GRE-driven reporter genes (21,358), but was subsequently confirmed on endogenous, glucocorticoid-responsive genes, such as the mitogen-activated protein kinase phosphatase-1 (MPK-1), myocilin and fibronectin (359,360). Further, GRb was shown to attenuate glucocorticoid-induced repression of the TNFa and interleukin (IL)-6 genes (359). We also confirmed this negative effect of GRb on GRa-mediated transrepression using microarray analyses (361). Several mechanisms explaining this GRb function have been reported, including (1) competition for GRE binding through their shared DBD, (2) heterodimerization with GRa and (3) coactivator squelching through the preserved AF-1 domain (21,357,358). All these different mechanisms of actions appear to be functional, depending on the promoters and the tissues affected by this GR isoform. Recently, the human GRb was shown to possess intrinsic transcriptional activity independent to its dominant negative effect on GRa-induced transcriptional activity, while the physiologic role(s) of this activity remain(s) to be examined (342,361,362) (see below). Inside the cells, hGRb can localize both in the cytoplasm and in the nucleus (363,364).


Similar to the human GR gene, the zebrafish (z) GR gene consists of 9 exons and produces zGRa and zGRb proteins, which contain 746 and 737 amino acids, respectively (353) (Figure 17). zGRa and zGRb share the N-terminal 697 amino acids, whereas they have specific C-terminal portions, which contain 47 and 40 amino acids, respectively. In contrast to hGRa and hGRb, which are produced through alternative use of specific exon 9a and 9b, zGRa and zGRb are formed as a result of intron retention (353). zGRa and zGRb use exon 1 to exon 8 for their common N-terminal 697 amino acids. zGRa uses exon 9 for its specific C-terminal portion, while zGRb continuously employs the rest of exon 8 and uses a stop codon located at the 3’ portion of this exon to express its specific C-terminal peptide (353). Protein alignment comparison of hGRb and zGRb indicated that these two molecules employ exactly the same divergence point, while their b isoform-specific C-terminal peptides show little sequence homology (353). These pieces of molecular information indicate that hGRb and zGRb evolved independently. Mouse (m), and recently, rat (r) GRb are also shown to produce in the same fashion as zGRb, indicating that intron retention may be a general mechanism for expressing this receptor isoform in organisms, while splicing-mediated expression employed by hGRb is rather unique (355,365). Nevertheless, zebrafish, mouse and rat GRb demonstrated the same functional properties as those of hGRb, namely, inability to bind glucocorticoids, a dominant negative activity on respectively zGRa-, mGRa- and rGRa-induced transactivation of GREs-drive promoters, and a strikingly similar tissue distribution as hGRb (353,365). Thus, hGRb, mGRb, rGRb and zGRb were produced through convergent evolution, most likely developed through a strong requirement of this type of GR isoform in the survival of these species. Indeed, the presence of nonligand-binding C-terminal variants is not unique to the GR. Similar to the human, mouse, rat and zebrafish GR, several other human NRs, e.g. ERb, TRa, vitamin D receptor (VDR), constitutive androstane receptor (CAR), dosage-sensitive sex reversal-1 (DAX-1), NURR-2, NOR-2, PPARα and PPARγ, all have C-terminally truncated receptor isoforms that are defective in binding to cognate ligands and have a dominant negative activity on their corresponding classic receptors (366-375). This suggests that evolution has allowed the development and retention of such alternative NRs, probably because they play important biologic roles.

Figure 17. Genomic and complementary DNA and protein structure of the zebrafish GR isoforms. The zebrafish (z) GR gene consists of 9 exons. The zGR gene expresses zGRa and zGRb splicing variants through intron retention (353). C-terminal gray colored and shaded domains in zGRa and zGRb show their specific portions. They are respectively encoded by exon 9 and the 3’ portion of exon 8, which are also shown in the same labeling in the genomic and complementary DNA models. Mouse and rat GR are produced with the same mechanism (355). Modified from (352). DBD: DNA-binding domain; LBD: Ligand-binding domain; NTD: N-terminal domain; UTR: untranslated region.

Biological actions of GRb and associated molecular mechanisms have been examined further during the last years. Using adeno-associated virus-based transfer of GRb to mouse liver, this isoform modulates mRNA expression of many genes in this organ including those related to endocrine system disorders, cancer, gastrointestinal diseases and immune diseases/inflammatory response both in a GRa-dependent and -independent fashions (376). Specifically, GRb attenuates GRa-dependent expression of the hepatic PEPCK gene and hepatic gluconeogenesis, while GRb stimulates expression of STAT1 through GREs located in the intergenic area close to the latter gene. The latter finding suggests that GRb can regulate gene expression by binding to classic GREs, in contrast to the previous findings obtained with GRE-driven reporter genes. In addition, GRb antagonizes to GRa-mediated suppression of bladder cancer cell migration and myogenesis of cardiomyocytes (377,378). GRb suppresses PTEN expression and enhances insulin-stimulated growth by stimulating the phosphorylation of AKT1 in a GRa-independent fashion (379). Further, GRb acts as a coactivator of T-cell factor-4 and enhances glioma cell proliferation also in a GRa-independent manner (380).

Several clinically oriented investigations suggest that GRb is responsible for the development of tissue-specific insensitivity to glucocorticoids in various disorders, most of them associated with dysregulation of immune function. They include glucocorticoid-resistant asthma, rheumatoid arthritis (RA), systemic lupus erythematosus (SLE), ankylosing spondylitis, chronic lymphocytic leukemia and nasal polyps (381-387). In these studies, various immune cells express elevated levels of GRb, which correlate with reduced sensitivity to glucocorticoids. Viral infection also stimulates GRb expression: for example, its expression in the peripheral mononuclear cells is strongly stimulated in the infants with bronchiolitis caused by the respiratory syncytial virus infection, and its expression levels are correlated with severity of the disease (388). Elevated levels of pro-inflammatory cytokines, such as IL-1, -2, -4, -7, -8 and -18, TNFa, and interferons a and g, might be responsible for increased GRb expression in cells from patients with these pathologic conditions, as these cytokines experimentally stimulate the expression of GRb in lymphocytes, neutrophils or airway smooth muscle cells (389-394). Further, presence of a single nucleotide polymorphism in the 3’ UTR of the hGRb mRNA (rs6198G allele), which increases its stability, and thus, causes elevated expression of the GRb protein, was associated with increased incidence of RA, SLE, high blood pressure, ischemic heart disease and nasal carriage of Staphylococcus aureus (382,395-397), possibly through inhibition of glucocorticoid actions by the increased concentrations of GRb. These pieces of clinical evidence further support that GRb has a dominant negative activity on GRa-induced transcription inside the human body, functioning as a negative regulator of glucocorticoid actions in local tissues.


PATHOLOGIC MODULATION OF GR ACTIVITY


Natural Pathologic GR Gene Mutations that Cause Familial/Sporadic Generalized Glucocorticoid Resistance or Chrousos Syndrome


Mutations in the human GR gene result in familial/sporadic generalized glucocorticoid resistance syndrome [see reviews (398-402)]. Since this syndrome was first reported by Chrousos et al. (403), we now call it as “Chrousos syndrome” (398,404). The condition is characterized by hypercortisolism without Cushingoid features (403,405). To overcome reduced sensitivity to glucocorticoids in tissues, affected subjects have compensatory elevations in circulating cortisol and ACTH concentrations, which maintain circadian rhythmicity and appropriate responsiveness to stressors, and resistance of the HPA axis to dexamethasone suppression, but no clinical evidence of hypercortisolism (404). Instead, the excess ACTH secretion causes increased production of adrenal steroids with mineralocorticoid activity, such as deoxycorticosterone (DOC) and corticosterone and/or androgenic activity, such as androstenedione, dehydroepiandrosterone (DHEA) and DHEA-sulfate (DHEA-S); The former accounts for symptoms and signs of mineralocorticoid excess, such as hypertension and hypokalemic alkalosis. The latter accounts for the manifestations of androgen excess, such as ambiguous genitalia and precocious puberty in children, acne, hirsutism and infertility in both sexes, male-pattern hair-loss, menstrual irregularities and oligo-anovulation in females, and adrenal rests in the testes and oligospermia in males. The clinical spectrum of the condition is broad and a large number of subjects may be asymptomatic, displaying biochemical alterations only (404).


An increasing number of kindreds and sporadic cases with abnormalities in the GR number, affinity for glucocorticoid, stability, and translocation into the nucleus have been reported (406-414). The molecular defects that have been elucidated are presented in Figure 18 and Table 1. The propositus of the original kindred was a homozygote for a single nonconservative point mutation, replacing aspartic acid with valine at amino acid 641 in the LBD of GRa; this mutation reduces the binding affinity of the affected receptor for dexamethasone by three-fold and causes loss of transactivation activity (411). The proposita of the second family had a 4-base deletion at the 3’-boundary of exon 6, removing a donor splice site. This results in complete ablation of one of the GR alleles in affected members of the family (412). Recent research employing mice with GR haploinsufficiency confirmed that ablation of one GR allele is sufficient to develop generalized glucocorticoid resistance (415). The propositus of the third kindred had a single homozygotic point mutation at amino acid 729 (valine to isoleucine: V729I) in the LBD, which reduced both the affinity and the transactivation activity of GRa (414). Several pathologic heterozygotic or homozygotic mutations of the GRgene have been recently identified in the patients as listed in Table 1 (403,411-444).

Figure 18. Location of the known human GR mutations causing Chrousos syndrome or its mirror image, sporadic glucocorticoid hypersensitivity, in the human GR (NR3C1) gene (A) and in the linearized hGR protein molecule (B). Nucleoside numbers of the mutated sites are determined by the definition employing adenine of the translation initiation site as number 1.

Table 1. Mutations in the NR3C1 Gene Causing Familial/Sporadic Generalized Glucocorticoid Resistance (Chrousos) or Hypersensitivity Syndromes

Authors

cDNA*

Amino acid

Molecular Defects

Genotype

Phenotype

Chrousos et al. (403)
Hurley et al.

(411)

1922A>T

Asp641Val

Transactivation: Decreased
Affinity to ligand: Decreased (x3)
Nuclear translocation: 22 min
Abnormal interaction with GRIP1

Homozygous

Hypertension
Hypokalemic alkalosis

Karl et al.

(412)

4bp deletion in exon-intron 6


GRa number: 50% reduction
Inactivation of affected allele

Heterozygous

Hirsutism
Male-pattern hair-loss
Menstrual irregularities

Malchoff et al. (414)

2185G>A

Val729Ile

Transactivation: Decreased
Affinity to ligand: Decreased (x4)
Nuclear translocation: 120 min
Abnormal interaction with GRIP1

Homozygous

Precocious puberty
Hyperandrogenism

Karl et al. (413)
Kino et al. (416)

1676T>A

Ile559Asn

Transactivation: Decreased
Transdominance (+)
Decrease in GR binding sites
Nuclear translocation: 180< min
Abnormal interaction with GRIP1

Heterozygous

Hypertension
Oligospermia
Infertility

Ruiz et al. (418)
Charmandari et al. (419)

1430G>A

Arg477His

Transactivation: Decreased
No GREs binding
Decrease in GR binding sites
Nuclear translocation: 20 min

Heterozygous

Hirsutism
Fatigue
Hypertension

Ruiz et al. (418)
Charmandari et al. (419)

2035G>A

Gly679Ser

Transactivation: Decreased
Affinity to ligand: Decreased (x2)
Nuclear translocation: 30 min
Abnormal interaction with GRIP1

Heterozygous

Hirsutism
Fatigue
Hypertension

Mendonca et al. (417)

1712T>C

Val571Ala

Transactivation: Decreased
Affinity to ligand: Decreased (x6)
Nuclear translocation: 25 min
Abnormal interaction with GRIP1

Homozygous

Ambiguous genitalia
Hypertension
Hypokalemia
Oligo-amenorrhea

Vottero et al. (420)

2241T>G

Ile747Meth

Transactivation: Decreased
Transdominance (+)
Affinity to ligand: Decreased (x2)
Nuclear translocation: Decreased
Abnormal interaction with GRIP1

Heterozygous

Cystic acne
Hirsutism
Oligo-amenorrhea

Charmandari et al. (421)

2318T>C

Leu773Pro

Transactivation: Decreased
Transdominance (+)
Affinity to ligand: Decreased (x2.6)
Nuclear translocation: 30 min
Abnormal interaction with GRIP1

Heterozygous

Fatigue
Anxiety
Acne
Hirsutism
Hypertension

Charmandari et al. (431)

2209T>C

Phe737Leu

Transactivation: Decreased
Transdominance (+)
Affinity to ligand: Decreased (x1.5)
Nuclear translocation: 180 min

Heterozygous

Hypertension
Hypokalemia

Charmandari et al. (430)

1201G>C

Asp401His

Transactivation: Increased­
Transdominance (-)
Affinity to ligand: no change
Nuclear translocation: Normal

Heterozygous

Hypertension
Diabetes mellitus
Accumulation of visceral fat

McMahon et al. (426)

2bp (TG) deletion at 2318 and 2319

Phe774Serfs⃰

No transactivation activity
No ligand-binding activity

Homozygous

Severe hypoglycemia developed 1 day after birth
Hypertension
Fatigues with feeding

Nader et al. (422) (443)

2141G>A

Arg714Gln

Transactivation: Decreased
Transdominance (+)
Affinity to ligand: Decreased (x2.0)
Nuclear translocation: 20 min
Abnormal interaction with GRIP1

Heterozygous


Heterozygous

Hypoglycemia developed at age 2 years and 10 months
Hypertension
Accelerated bone age
Mild clitoromegaly


Infertility

Bouligand et al. (429)

1405C>T

Arg469Ter

Transactivation: Decreased
Affinity to ligand: Decreased
Nuclear Translocation: No

Heterozygous

Bilateral adrenal hyperplasia
Hypertension
Hypokalemia

Zhu et al.
Nicolaides et al. (423) (424)

1667C>T

Threo556Ile

Transactivation: Decreased
Transdominance: No
Affinity to ligand: Decreased
Nuclear translocation: 50 min

Heterozygous

Bilateral adrenal hyperplasia

Roberts et al.

(428)

1268T>C

Val423Ala

Transactivation: Decreased
Transdominance: No
Affinity to ligand: no change
Nuclear translocation: 2.6-fold delay

Heterozygous

Hypertension

Nicolaides et al. (425)

2177A>G

His726Arg

Transactivation: Decreased
Transdominance: No
Affinity to ligand: Decreased
Nuclear translocation: 60 min

Heterozygous

Hirsutism
Acne
Alopecia
Fatigue
Anxiety
Irregular menstrual cycle

Lin et al. (432)

26C>G

Pro9Arg

Not performed

Heterozygous

Hypertension

Paragliola et al. (433)

367G˃T

Glu123Ter

Not performed

Heterozygous

Chronic fatigue

Anxiety

Hirsutism

Irregular menstrual cycles

Infertility

Tatsi et al. (434)

592G˃T

Glu198Ter

Not performed

Compound heterozygous

Hypertensive encephalopathy

Al Argan et al. (435)

1392delC

Ile464Ilefs⃰

Not performed

Heterozygous

Low body weight

Hyperandrogenism

Severe anxiety

Adrenocortical hyperplasia

Vitellius et al. (436)

1429C˃A

Arg477Ser

Cytoplasm to nuclear translocation: Decreased

DNA binding: (-)

Dominant negative effect: (-) Transactivation: (-)

Heterozygous

Obesity

Velayos et al. (437)

1429C˃T

Arg477Cys

Not performed

Heterozygous

Mild hirsutism

Vitellius et al. (436)

1433A˃G

Tyr478Cys

Cytoplasm to nuclear translocation: Decreased

DNA binding: Weak and delayed

Dominant negative effect: (-)

Transactivation: Decreased

Heterozygous

Adrenal mass

Vitellius et al. (438)

1471C˃T

Arg491Ter

Transactivation: (-)

Heterozygous

Bilateral adrenal hyperplasia

Vitellius et al. (438)

1503G˃T

Gln501His

Transactivation: Decreased

Heterozygous

Bilateral adrenal hyperplasia

Ma et al. (439)

1652C˃A

Ser551Tyr

Ligand binding: Decreased

Cytoplasm to nuclear translocation: Decreased

Transactivation: Decreased

Homozygous

Fatigue

Hypokalemia

Hypertension

Polyuria

Velayos et al. (437)

1762_1763insTTAC

His588Leufs⃰

Not performed

Heterozygous

Hirsutism

Chronic fatigue

Anxiety

Cannavò et al. (440)

1915C˃G

Leu595Val

Not performed

Not available

Hirsutism

Amenorrhea

Hypertension

Trebble et al. (441)

1835delC

Ser612Tyrfs⃰

Protein expression: (-)

Ligand binding: (-)

Cytoplasm to nuclear translocation: (-)

Dominant negative effect: Yes

Transactivation: (-)

Heterozygous

Fatigue

Vitellius et al. (442)

1980T˃G

Tyr660Ter

Transactivation: (-)

Heterozygous

Hypertension

Vitellius et al. (436)

2015T˃C

Leu672Pro

Protein expression: Decreased

Ligand binding: (-)

Cytoplasm to nuclear translocation: (-)

DNA binding: (-)

Dominant negative effect: No

Transactivation: (-)

Heterozygous

Adrenal mass

Donner et al. (444)

2317_2318delCT

Leu773Valfs⃰

Protein expression: slightly reduced

Transactivation: Decreased

Dominant negative effect: No

Ligand binding: (-)

Heterozygous

Hypertension


We examined the impact of 10 pathologic GRa point mutations (559N, V571A, V575G, D641V, G679S, R714Q, V729I, F737L, I747M and L773P) to the molecular structure of the GRa LBD focusing on its ligand-binding pocket and AF-2 surface by using computer-based molecular simulation, and found some rules on the molecular disruption of these structural units by the mutations (89); (1) Topology of the peptide backbones is highly preserved in pathologic GRa mutant LBDs (Figure 19A). This result suggests that alteration in property and/or positioning of the side chain of replaced amino acids is rather crucial for developing molecular defects. (2) Defects in the ligand-binding pocket of the mutant receptors are driven primarily by loss/reduction (indirectly through structural changes in LBD induced by the mutations) of the electrostatic interaction formed by arginine 611 and threonine 739 of the receptor to glucocorticoid and a subsequent conformational mismatch (Figure 19B). (3) Defects of the AF-2 surface that reduce affinity to the LxxLL motif are caused mainly (also indirectly) by disruption of the electrostatic bonds to the non-core leucine residues of this peptide that determine the peptide’s specificity to GRa LBD (Figure 19C), as well as by reduced non-covalent interaction against core leucines and subsequent exposure of the AF-2 surface to solvent.

Figure 19. Impact of pathologic GR point mutations to the molecular structure of GR LBD. A: Distribution of the pathologic GR point mutations in its LBD and their overall impact on the 3-dimensional LBD peptide backbone. Thickness and color of the overlaid C-traces of the GR mutant receptor LBDs and the wild type GR LBD indicate the areas of least (thin and blue) to most (thick and red) motion over the course of simulation. Locations and side chains of the mutated amino acids are indicated, whereas dexamethasone (shown with the white and red spheres of space-filling model) is located inside LBP. B: Alteration of the electrostatic bond formed by arginine (R) 611 and threonine (T) 739 of pathologic GR mutants to dexamethasone may largely explain the reduced affinity of many pathologic GR mutants to this steroid. The left panel demonstrates superimposed 3-dimensional interaction images of dexamethasone and the key residues of all pathologic GRa mutants. Among the key amino acids of pathologic mutants participating in interaction with dexamethasone, R611 is largely deviated in these mutant receptors, which underlies reduced/disappeared electrostatic interaction between this residue and the carbonyl oxygen at carbon-3 of dexamethasone. Q570 and N564 are omitted from these panels. Major changes observed in the electrostatic bond formed by R611 and T739 are indicated with a purple dotted circle. The right panel shows schematic molecular interaction between wild type GRa and dexamethasone. Purple and orange arrows indicate electrostatic and non-covalent bonds, respectively. DEX: dexamethasone. C: Defective non-covalent bonds formed between Q597, D590, K579 and R585 of the pathologic GRa mutants and N742, R746, D750 and D752 of the LxxLL peptide mainly explain reduced interaction of the mutant receptor AF-2s to this peptide. The panel demonstrates 3-dimensional image of the molecular interaction between the LXXLL peptide and key residues of the wild type GRa. The LxxLL peptide forms important electrostatic bonds with its non-core leucine residues (N742, R746, D750 and D752) against the receptor residues (Q597, D590, R585 and K579, respectively) as marked with purple dotted boxes. Pathologic GRa mutants demonstrate significant shift of the side chains of some of these receptor residues among which the side chain of R585 shows the most significant deviation (shown in square inserts). Modified from (89).

GR Gene Mutation-Mediated Hypersensitivity Syndrome


Only one mutation has been reported in the GRa NTD that replaces aspartic acid at amino acid 401 by histidine (D401H) (G to C replacement at nucleotide position 1201) (430). The patient harboring this heterozygous mutation presented with manifestations consistent with glucocorticoid hypersensitivity, in accordance with the in vitro results showing that the mutant receptor hGRaD401H demonstrated a 2.4-fold increase in its ability to transactivate the glucocorticoid-responsive promoters. This condition represents the mirror image of the Chrousos syndrome. Although not in humans, one porcine heterozygotic substitution that replaces alanine at amino acid 610 with valine (A610V) in LBD of the porcine GR causes a gain-of-function phenotype, shifting the titration curve of GR-transcriptional activity to leftward (this suggests increase of the receptor affinity to glucocorticoid) (445).


GR Gene Polymorphisms


Polymorphisms of the human GR gene have also been reported (446). A heterozygous polymorphism replacing aspartic acid to serine at amino acid 363 (N363S) that mildly increases transcriptional activity of the affected receptor in vitro is associated with increased sensitivity to glucocorticoids, weakly correlating with the development of central obesity, and thus, influencing the metabolic profile and the longevity of humans in a negative fashion (447-449). This polymorphism found at amino acid 363 was first described by Karl et al. (412).


The polymorphism in the human GR gene that causes arginine to lysine replacement at amino acid 23 (ER22/23EK: GAG AGG to GAA AAG) is associated with relative glucocorticoid resistance by altering the expression levels of GRa translational isoforms (450). This polymorphism increases muscle mass in males and reduces waist to hip ratio in females, and is associated with greater insulin sensitivity, and lower total and low-density lipoprotein cholesterol levels, indicating that this polymorphism causes beneficial effects on longevity by reducing glucocorticoid actions (451,452).


One recent study examined influence of N363S and ER22/23EK polymorphisms to intelligence quotient (IQ) and behavior of 344 young subjects who have been followed up from their birth (453). The study found that N363S is not associated with IQ, while ER22/23EK showed significantly higher IQ scores. Both polymorphisms did not show any effects on the behavior scores. Antenatal glucocorticoid treatment reduces IQ scores in the subjects carrying N363S or ER22/23EK polymorphism.


The BclI GR polymorphism comprises a C to G nucleotide substitution at 646 bp downstream of exon 2 in intron B of the human GR gene that creates a cutting site for the BclI restriction enzyme. G-allele of this polymorphism increases tissue sensitivity to glucocorticoids as shown by greater suppression of serum cortisol levels after dexamethasone administration (454). This polymorphism is associated with development of mood disorders, psychopathology, bronchial asthma, hypertension, hyperinsulinism and obesity (455,456). It is also associated with increased bone resorption in patients receiving glucocorticoid replacement therapy (457). Although a large study employing adolescents (15-17 years old) did not confirm the association of the BclI polymorphisms to changes in several stress-related neurological parameters (458), a study employing 460 subjects with post-traumatic stress disorder (PTSD) found that this polymorphism and another polymorphism rs258747, located in the 3’-flanking region of the human GR gene and potentially influencing stability of GR mRNA, significantly increase a risk for developing PTSD (459). In one study, the BclGR polymorphism was associated with lower frequency of insulin resistance in the women with polycystic ovary syndrome (PCOS) in contrast to the findings obtained in normal subjects (460).


A single nucleotide polymorphism that replaces A with G at the nucleoside 3669 (A3669G) located in the 3’ end of exon 9b has been described in a European population (461). This polymorphism does not change the amino acid sequence but increases the stability of GRb mRNA and increases GRb protein expression, leading to greater inhibition of GRa-induced transcriptional activity and causing glucocorticoid resistance in tissues. The presence of the A3669G allele is associated with reduced central obesity and a more favorable lipid profile in affected subjects (461).


Viral Infection


HUMAN IMMUNODEFICIENCY VIRUS TYPE-1


Patients with the Acquired Immunodeficiency Syndrome (AIDS), which is caused by infection of the Human Immunodeficiency Virus type-1 (HIV-1), have several manifestations compatible with increased activity of GRa. They develop reduction of innate and Th1-directed cellular immunity, which is also seen in the conditions of glucocorticoid excess. Patients with AIDS often develop symptoms and signs that manifest in hypercortisolemic states, such as muscle wasting, myopathy, dyslipidemia and visceral obesity-related insulin resistance (462-466). Therefore, it is possible that some HIV-1-related factor(s) may modulate the function of GRa in patients with AIDS. Please see for more details the chapter on AIDS and the HPA Axis in the Adrenal Section of Endotext.


We have shown that one of the HIV-1 accessory proteins, Vpr, a 96-amino acid virion-associated protein with multiple functions (467,468), enhances GRa transactivation by functioning as a coactivator (469) (Figure 20). Indeed, Vpr contains a NR coactivator motif LxxLL at amino acids 64-68. This motif is used by host NR coactivators to bind NRs (80) (see Section ln ACTIONS OF GR, Mechanism of GRa-mediated Activation of Transcription). Similarly, through this motif, Vpr directly binds GRa and cooperatively enhances its activity on its responsive promoters along with host NR coactivators SRC-1 (p160-type protein, NCoA1) and p300/CBP (469). Vpr directly binds p300 at its C-terminal amino acids 2045-2191, where the p160 coactivators (NCoAs) also bind (470). Since Vpr circulates at detectable levels in HIV-1-infected individuals and is able to penetrate the cell membrane, its effects may be extended to cells not infected by HIV-1 (471,472). Indeed, extracellularly administered Vpr polypeptide regulates glucocorticoid-responsive genes, such as IL-12 p40, in the same way as the potent glucocorticoid, dexamethasone (473). In addition to regulating GRa activity, Vpr modulates the transcriptional activity of PPARb/d and PPARg, the NR family proteins important for fatty acid metabolism (474,475). Through modulating activities of GRa and the PPARs, Vpr appears to participate in the development of the characteristic AIDS-related lipodystrophy syndrome, which is quite prevalent among AIDS patients (476,477).

Figure 20. Linearized Vpr, Tat, E1A, p300 and CtBP1 molecules and their mutual interaction domains. Vpr interacts with GR and several other NRs through its LxxLL motif located at amino acids 64 to 69. Binding sites of Vpr and p160-type HAT coactivators overlap with each other on p300. Since Vpr has a LxxLL motif similar to p160 coactivators, Vpr mimics host p160 coactivators and enhances GR transcriptional activity. Tat also binds both p300 and p160 coactivators. p300 facilitates attraction of many transcription factors, cofactors and general transcription complexes, and loosens the histone/DNA interaction through acetylation of the histone tails by its histone acetyltransferase (HAT) domain. E1A binds p300 at the latter’s C-terminal portion, while it physically interacts with the N-terminal portion of CtBP1 through its C-terminal end. The N-terminal portion of CtBP1 physically interacts with HDAC5 and Retinoblastoma protein (Rb), which have repressive activity on transcription. CtBP1 regulates its interaction to binding partners by sensing cellular NAD+ levels through its NAD+-binding domain. The HAT domain of p300 and the NAD+-binding domain of CtBP1 are indicated in grey. Modified from (478). CREB: CRE-binding protein, HAT: histone acetyltransferase, HDAC5: histone deacetylases 5, NF-B: nuclear factor-B, NAD: nicotinamide adenine dinucleotide, NR: nuclear hormone receptor, p/CAF: p300/CBP-associating factor, pTEFb: positive-acting transcription elongation factor b, Rb: retinoblastoma protein, SF-1: steroidogenic factor-1, STAT2: signal transducer and activator of transcription 2, TFIIB: transcription factor IIB.

Another HIV-1 accessory protein, Tat, which functions as a major transactivator of the HIV-1 long terminal repeat promoter (479) also potentiates GRa activity moderately by increasing accumulation of the positive transcription elongation factor b (pTEFb) (480-482) (Figure 20). Like Vpr, Tat readily penetrates the cell membranes (483) and may, therefore, modulate the transcriptional activity of GRa in the cells/tissues not infected by HIV-1.


Through Vpr and Tat, HIV-1 may facilitate the transcription of genes encoding its own proteins by directly stimulating viral proliferation. On the other hand, by enhancing transactivation of GRa and other NRs, these proteins may contribute to the viral proliferation possibly by suppressing the host immune system, while they participate in the development of several pathologic conditions associated with HIV-1 infection (480,484).


ADENOVIRUS


Adenoviruses cause illness of the respiratory system, such as common cold syndrome, pneumonia, croup and bronchitis, as well as illnesses of other organs, such as gastroenteritis, conjunctivitis and cystitis. They encode the E1A protein, which is expressed just after the infection and is necessary for the transcriptional regulation of the adenovirus-encoded genes (485). In addition to the viral genes, E1A regulates the transcriptional activity of a variety of host genes through interaction with the host transcriptional integrator p300 and its homologous molecule CBP (77,486) (Figure 20). In an in vitro system, E1A, in contrast to Vpr, blocks the actions of glucocorticoids on the transcriptional activity of genes, producing resistance to glucocorticoids (470).


E1A also interacts with the C-terminal tail-binding protein 1 (CtBP1), which functions as a transcriptional repressor for numerous transcription factors, by communicating with the class II HDACs and other inhibitory molecules like the retinoblastoma protein (Rb) (487) (Figure 20). E1A suppresses functions of p300/CBP and CtBP1 by binding to their functionally critical domains (77,487). Although there is no supportive clinical evidence, it is highly possible that adenovirus changes the peripheral action of glucocorticoids as well as of other bioactive molecules that activate NRs and directly regulates the transcriptional activity of their target genes, ultimately contributing to the pathologic states observed in adenoviral infection.


OTHER VIRUSES


We examined the impact of viral infection (murine cytomegalovirus: mCMV) on glucocorticoid-mediated modulation of gene expression in dendritic cells (488). Among 96 genes examined, the viral infection significantly enhanced dexamethasone-induced IL-10 expression. Activation of the toll-like receptors (TLRs) by the virus stimulates the extracellular signal-regulated kinase (ERK) 1/2, which in turn increases phosphorylation of the human GRa at serine 203, resulting in the enhancement of GRa transcriptional activity on the IL-10 gene promoter. Since IL-10 is a potent anti-inflammatory cytokine, it appears that the virus stimulates its own infection/propagation by enhancing GRa activity on this cytokine. Respiratory syncytial virus (RSV), which is one of the major causes of lower respiratory tract infection and hospital visits during infancy and childhood, is reported to repress the anti-inflammatory action of glucocorticoids through GRa (489-491).


ACKNOWLEDGEMENTS


This literary work was supported by the intramural fund of the Sidra Medical and Research Center to T. Kino.


REFERENCES


  1. Chrousos GP. The hypothalamic-pituitary-adrenal axis and immune-mediated inflammation. N Engl J Med 1995; 332:1351-1362
  2. Munck A, Guyre PM, Holbrook NJ. Physiological functions of glucocorticoids in stress and their relation to pharmacological actions. Endocr Rev 1984; 5:25-44
  3. Glucocorticoids, Overview. Nicolaides NC, Charmandari E, Chrousos GP. In Encyclopedia of Endocrine Diseases (2nd Edition), edited by Ilpo Huhtaniemi and Luciano Martini, New York 2018, pp. 64-71.
  4. Boumpas DT, Chrousos GP, Wilder RL, Cupps TR, Balow JE. Glucocorticoid therapy for immune-mediated diseases: basic and clinical correlates. Ann Intern Med 1993; 119:1198-1208
  5. Mangelsdorf DJ, Thummel C, Beato M, Herrlich P, Schutz G, Umesono K, Blumberg B, Kastner P, Mark M, Chambon P, Evans RM. The nuclear receptor superfamily: the second decade. Cell 1995; 83:835-839
  6. Androutsellis-Theotokis A, Chrousos GP, McKay RD, DeCherney AH, Kino T. Expression profiles of the nuclear receptors and their transcriptional coregulators during differentiation of neural stem cells. Horm Metab Res 2013; 45:159-168
  7. Galon J, Franchimont D, Hiroi N, Frey G, Boettner A, Ehrhart-Bornstein M, O'Shea JJ, Chrousos GP, Bornstein SR. Gene profiling reveals unknown enhancing and suppressive actions of glucocorticoids on immune cells. FASEB J 2002; 16:61-71
  8. Mackeh R, Marr AK, Dargham S, Syed N, Fakhro K, Kino T. Single nucleotide variations in the human nuclear hormone receptor genes: their distribution in major domains and link to receptor gene ages and functionality. 2017 (unpublished data)
  9. Kovacs WJ, Orth DN. The adrenal cortex. In: Wilson J, D., Foster DW, eds. Williams Textbook of Endocrinology. Philadelphia, PA: W.B. Saunders Company; 1998:517-750.
  10. Thornton JW. Evolution of vertebrate steroid receptors from an ancestral estrogen receptor by ligand exploitation and serial genome expansions. Proc Natl Acad Sci U S A 2001; 98:5671-5676
  11. Thornton JW, Need E, Crews D. Resurrecting the ancestral steroid receptor: ancient origin of estrogen signaling. Science 2003; 301:1714-1717
  12. Baker ME. Steroid receptors and vertebrate evolution. Mol Cell Endocrinol 2019; 496: 110526
  13. Kuraku S, Hoshiyama D, Katoh K, Suga H, Miyata T. Monophyly of lampreys and hagfishes supported by nuclear DNA-coded genes. J Mol Evol 1999; 49:729-735
  14. Baker ME. Co-evolution of steroidogenic and steroid-inactivating enzymes and adrenal and sex steroid receptors. Mol Cell Endocrinol 2004; 215:55-62
  15. Bridgham JT, Carroll SM, Thornton JW. Evolution of hormone-receptor complexity by molecular exploitation. Science 2006; 312:97-101
  16. Ortlund EA, Bridgham JT, Redinbo MR, Thornton JW. Crystal structure of an ancient protein: evolution by conformational epistasis. Science 2007; 317:1544-1548
  17. Harms MJ, Thornton JW. Historical contingency and its biophysical basis in glucocorticoid receptor evolution. Nature 2014; 512:203-207
  18. Alsop D, Vijayan M. The zebrafish stress axis: molecular fallout from the teleost-specific genome duplication event. Gen Comp Endocrinol 2009; 161:62-66
  19. Hollenberg SM, Weinberger C, Ong ES, Cerelli G, Oro A, Lebo R, Thompson EB, Rosenfeld MG, Evans RM. Primary structure and expression of a functional human glucocorticoid receptor cDNA. Nature 1985; 318:635-641
  20. Chrousos GP, Kino T. Intracellular glucocorticoid signaling: a formerly simple system turns stochastic. Sci STKE 2005; 2005:pe48
  21. Bamberger CM, Bamberger AM, de Castro M, Chrousos GP. Glucocorticoid receptor b, a potential endogenous inhibitor of glucocorticoid action in humans. J Clin Invest 1995; 95:2435-2441
  22. Almlof T, Gustafsson JA, Wright AP. Role of hydrophobic amino acid clusters in the transactivation activity of the human glucocorticoid receptor. Mol Cell Biol 1997; 17:934-945
  23. Almlof T, Wallberg AE, Gustafsson JA, Wright AP. Role of important hydrophobic amino acids in the interaction between the glucocorticoid receptor tau 1-core activation domain and target factors. Biochemistry 1998; 37:9586-9594
  24. Warnmark A, Gustafsson JA, Wright AP. Architectural principles for the structure and function of the glucocorticoid receptor tau 1 core activation domain. J Biol Chem 2000; 275:15014-15018
  25. Kumar R, Volk DE, Li J, Lee JC, Gorenstein DG, Thompson EB. TATA box binding protein induces structure in the recombinant glucocorticoid receptor AF1 domain. Proc Natl Acad Sci U S A 2004; 101:16425-16430
  26. Khan SH, Awasthi S, Guo C, Goswami D, Ling J, Griffin PR, Simons SS, Jr., Kumar R. Binding of the N-terminal region of coactivator TIF2 to the intrinsically disordered AF1 domain of the glucocorticoid receptor is accompanied by conformational reorganizations. J Biol Chem 2012; 287:44546-44560
  27. Khan SH, Ling J, Kumar R. TBP binding-induced folding of the glucocorticoid receptor AF1 domain facilitates its interaction with steroid receptor coactivator-1. PLoS One 2011; 6:e21939
  28. Howard KJ, Holley SJ, Yamamoto KR, Distelhorst CW. Mapping the HSP90 binding region of the glucocorticoid receptor. J Biol Chem 1990; 265:11928-11935
  29. Schule R, Rangarajan P, Kliewer S, Ransone LJ, Bolado J, Yang N, Verma IM, Evans RM. Functional antagonism between oncoprotein c-Jun and the glucocorticoid receptor. Cell 1990; 62:1217-1226
  30. Burris TP. The nuclear receptor superfamily. In: Burris TP, McCabe ERB, eds. Nuclear receptors and genetic disease. London: Academic Press; 2001:1-58.
  31. Bledsoe RK, Montana VG, Stanley TB, Delves CJ, Apolito CJ, McKee DD, Consler TG, Parks DJ, Stewart EL, Willson TM, Lambert MH, Moore JT, Pearce KH, Xu HE. Crystal structure of the glucocorticoid receptor ligand binding domain reveals a novel mode of receptor dimerization and coactivator recognition. Cell 2002; 110:93-105
  32. Tanenbaum DM, Wang Y, Williams SP, Sigler PB. Crystallographic comparison of the estrogen and progesterone receptor's ligand binding domains. Proc Natl Acad Sci U S A 1998; 95:5998-6003
  33. Williams SP, Sigler PB. Atomic structure of progesterone complexed with its receptor. Nature 1998; 393:392-396
  34. Lu NZ, Cidlowski JA. Translational regulatory mechanisms generate N-terminal glucocorticoid receptor isoforms with unique transcriptional target genes. Mol Cell 2005; 18:331-342
  35. Bender IK, Cao Y, Lu NZ. Determinants of the heightened activity of glucocorticoid receptor translational isoforms. Mol Endocrinol 2013; 27:1577-1587
  36. Wu I, Shin SC, Cao Y, Bender IK, Jafari N, Feng G, Lin S, Cidlowski JA, Schleimer RP, Lu NZ. Selective glucocorticoid receptor translational isoforms reveal glucocorticoid-induced apoptotic transcriptomes. Cell Death Dis 2013; 4:e453
  37. Kino T, Chrousos GP. Tissue-specific glucocorticoid resistance-hypersensitivity syndromes: multifactorial states of clinical importance. J Allergy Clin Immunol 2002; 109:609-613
  38. Cao Y, Bender IK, Konstantinidis AK, Shin SC, Jewell CM, Cidlowski JA, Schleimer RP, Lu NZ. Glucocorticoid receptor translational isoforms underlie maturational stage-specific glucocorticoid sensitivities of dendritic cells in mice and humans. Blood 2013; 121:1553-1562
  39. Sinclair D, Webster MJ, Wong J, Weickert CS. Dynamic molecular and anatomical changes in the glucocorticoid receptor in human cortical development. Mol Psychiatry 2011; 16:504-515
  40. Presul E, Schmidt S, Kofler R, Helmberg A. Identification, tissue expression, and glucocorticoid responsiveness of alternative first exons of the human glucocorticoid receptor. J Mol Endocrinol 2007; 38:79-90
  41. Turner JD, Muller CP. Structure of the glucocorticoid receptor (NR3C1) gene 5' untranslated region: identification, and tissue distribution of multiple new human exon 1. J Mol Endocrinol 2005; 35:283-292
  42. Sinclair D, Fullerton JM, Webster MJ, Shannon Weickert C. Glucocorticoid receptor 1B and 1C mRNA transcript alterations in schizophrenia and bipolar disorder, and their possible regulation by GR gene variants. PLoS One 2012; 7:e31720
  43. Martin-Blanco A, Ferrer M, Soler J, Salazar J, Vega D, Andion O, Sanchez-Mora C, Arranz MJ, Ribases M, Feliu-Soler A, Perez V, Pascual JC. Association between methylation of the glucocorticoid receptor gene, childhood maltreatment, and clinical severity in borderline personality disorder. J Psychiatr Res 2014; 57:34-40
  44. Na KS, Chang HS, Won E, Han KM, Choi S, Tae WS, Yoon HK, Kim YK, Joe SH, Jung IK, Lee MS, Ham BJ. Association between glucocorticoid receptor methylation and hippocampal subfields in major depressive disorder. PLoS One 2014; 9:e85425
  45. Kantake M, Yoshitake H, Ishikawa H, Araki Y, Shimizu T. Postnatal epigenetic modification of glucocorticoid receptor gene in preterm infants: a prospective cohort study. BMJ Open 2014; 4:e005318
  46. Bockmuhl Y, Murgatroyd CA, Kuczynska A, Adcock IM, Almeida OF, Spengler D. Differential regulation and function of 5'-untranslated GR-exon 1 transcripts. Mol Endocrinol 2011; 25:1100-1110
  47. Denis M, Gustafsson JA, Wikstrom AC. Interaction of the Mr = 90,000 heat shock protein with the steroid-binding domain of the glucocorticoid receptor. J Biol Chem 1988; 263:18520-18523
  48. Czar MJ, Lyons RH, Welsh MJ, Renoir JM, Pratt WB. Evidence that the FK506-binding immunophilin heat shock protein 56 is required for trafficking of the glucocorticoid receptor from the cytoplasm to the nucleus. Mol Endocrinol 1995; 9:1549-1560
  49. Owens-Grillo JK, Hoffmann K, Hutchison KA, Yem AW, Deibel MR, Jr., Handschumacher RE, Pratt WB. The cyclosporin A-binding immunophilin CyP-40 and the FK506-binding immunophilin hsp56 bind to a common site on hsp90 and exist in independent cytosolic heterocomplexes with the untransformed glucocorticoid receptor. J Biol Chem 1995; 270:20479-20484
  50. Savory JG, Hsu B, Laquian IR, Giffin W, Reich T, Hache RJ, Lefebvre YA. Discrimination between NL1- and NL2-mediated nuclear localization of the glucocorticoid receptor. Mol Cell Biol 1999; 19:1025-1037
  51. McNally JG, Muller WG, Walker D, Wolford R, Hager GL. The glucocorticoid receptor: rapid exchange with regulatory sites in living cells. Science 2000; 287:1262-1265
  52. Voss TC, Schiltz RL, Sung MH, Yen PM, Stamatoyannopoulos JA, Biddie SC, Johnson TA, Miranda TB, John S, Hager GL. Dynamic exchange at regulatory elements during chromatin remodeling underlies assisted loading mechanism. Cell 2011; 146:544-554
  53. Morisaki T, Muller WG, Golob N, Mazza D, McNally JG. Single-molecule analysis of transcription factor binding at transcription sites in live cells. Nat Commun 2014; 5:4456
  54. Hache RJ, Tse R, Reich T, Savory JG, Lefebvre YA. Nucleocytoplasmic trafficking of steroid-free glucocorticoid receptor. J Biol Chem 1999; 274:1432-1439
  55. Yang J, Liu J, DeFranco DB. Subnuclear trafficking of glucocorticoid receptors in vitro: chromatin recycling and nuclear export. J Cell Biol 1997; 137:523-538
  56. DeFranco DB. Subnuclear trafficking of steroid receptors. Biochem Soc Trans 1997; 25:592-597
  57. Kinyamu HK, Chen J, Archer TK. Linking the ubiquitin-proteasome pathway to chromatin remodeling/modification by nuclear receptors. J Mol Endocrinol 2005; 34:281-297
  58. Kino T, Liou SH, Charmandari E, Chrousos GP. Glucocorticoid receptor mutants demonstrate increased motility inside the nucleus of living cells: time of fluorescence recovery after photobleaching (FRAP) is an integrated measure of receptor function. Mol Med 2004; 10:80-88
  59. Kino T, De Martino MU, Charmandari E, Mirani M, Chrousos GP. Tissue glucocorticoid resistance/hypersensitivity syndromes. J Steroid Biochem Mol Biol 2003; 85:457-467
  60. Holaska JM, Black BE, Love DC, Hanover JA, Leszyk J, Paschal BM. Calreticulin is a receptor for nuclear export. J Cell Biol 2001; 152:127-140
  61. Black BE, Holaska JM, Rastinejad F, Paschal BM. DNA binding domains in diverse nuclear receptors function as nuclear export signals. Curr Biol 2001; 11:1749-1758
  62. Holaska JM, Black BE, Rastinejad F, Paschal BM. Ca2+-dependent nuclear export mediated by calreticulin. Mol Cell Biol 2002; 22:6286-6297
  63. Itoh M, Adachi M, Yasui H, Takekawa M, Tanaka H, Imai K. Nuclear export of glucocorticoid receptor is enhanced by c-Jun N-terminal kinase-mediated phosphorylation. Mol Endocrinol 2002; 16:2382-2392
  64. Kino T, Souvatzoglou E, De Martino MU, Tsopanomihalu M, Wan Y, Chrousos GP. Protein 14-3-3s interacts with and favors cytoplasmic subcellular localization of the glucocorticoid receptor, acting as a negative regulator of the glucocorticoid signaling pathway. J Biol Chem 2003; 278:25651-25656
  65. Habib T, Sadoun A, Nader N, Suzuki S, Liu W, Jithesh PV, Kino T. AKT1 has dual actions on the glucocorticoid receptor by cooperating with 14-3-3. Mol Cell Endocrinol 2017; 439:431-443
  66. Psarra AM, Sekeris CE. Glucocorticoids induce mitochondrial gene transcription in HepG2 cells: role of the mitochondrial glucocorticoid receptor. Biochim Biophys Acta 2011; 1813:1814-1821
  67. Hunter RG, Seligsohn M, Rubin TG, Griffiths BB, Ozdemir Y, Pfaff DW, Datson NA, McEwen BS. Stress and corticosteroids regulate rat hippocampal mitochondrial DNA gene expression via the glucocorticoid receptor. Proc Natl Acad Sci U S A 2016; 113:9099-9104
  68. He Y, Xu Y, Zhang C, Gao X, Dykema KJ, Martin KR, Ke J, Hudson EA, Khoo SK, Resau JH, Alberts AS, MacKeigan JP, Furge KA, Xu HE. Identification of a lysosomal pathway that modulates glucocorticoid signaling and the inflammatory response. Sci Signal 2011; 4:ra44
  69. Bamberger CM, Schulte HM, Chrousos GP. Molecular determinants of glucocorticoid receptor function and tissue sensitivity to glucocorticoids. Endocr Rev 1996; 17:245-261
  70. Lieberman BA, Bona BJ, Edwards DP, Nordeen SK. The constitution of a progesterone response element. Mol Endocrinol 1993; 7:515-527
  71. Presman DM, Ogara MF, Stortz M, Alvarez LD, Pooley JR, Schiltz RL, Grontved L, Johnson TA, Mittelstadt PR, Ashwell JD, Ganesan S, Burton G, Levi V, Hager GL, Pecci A. Live cell imaging unveils multiple domain requirements for in vivo dimerization of the glucocorticoid receptor. PLoS Biol 2014; 12:e1001813
  72. Meijsing SH, Pufall MA, So AY, Bates DL, Chen L, Yamamoto KR. DNA binding site sequence directs glucocorticoid receptor structure and activity. Science 2009; 324:407-410
  73. Watson LC, Kuchenbecker KM, Schiller BJ, Gross JD, Pufall MA, Yamamoto KR. The glucocorticoid receptor dimer interface allosterically transmits sequence-specific DNA signals. Nat Struct Mol Biol 2013; 20:876-883
  74. Beato M, Sanchez-Pacheco A. Interaction of steroid hormone receptors with the transcription initiation complex. Endocr Rev 1996; 17:587-609
  75. Giguere V, Hollenberg SM, Rosenfeld MG, Evans RM. Functional domains of the human glucocorticoid receptor. Cell 1986; 46:645-652
  76. McKenna NJ, Lanz RB, O'Malley BW. Nuclear receptor coregulators: cellular and molecular biology. Endocr Rev 1999; 20:321-344
  77. Goodman RH, Smolik S. CBP/p300 in cell growth, transformation, and development. Genes Dev 2000; 14:1553-1577
  78. Yang XJ, Ogryzko VV, Nishikawa J, Howard BH, Nakatani Y. A p300/CBP-associated factor that competes with the adenoviral oncoprotein E1A. Nature 1996; 382:319-324
  79. Blanco JC, Minucci S, Lu J, Yang XJ, Walker KK, Chen H, Evans RM, Nakatani Y, Ozato K. The histone acetylase PCAF is a nuclear receptor coactivator. Genes Dev 1998; 12:1638-1651
  80. Leo C, Chen JD. The SRC family of nuclear receptor coactivators. Gene 2000; 245:1-11
  81. Glass CK, Rosenfeld MG. The coregulator exchange in transcriptional functions of nuclear receptors. Genes Dev 2000; 14:121-141
  82. Charmandari E, Kino T, Chrousos GP. Familial/sporadic glucocorticoid resistance: clinical phenotype and molecular mechanisms. Ann N Y Acad Sci 2004; 1024:168-181
  83. Yi P, Wang Z, Feng Q, Pintilie GD, Foulds CE, Lanz RB, Ludtke SJ, Schmid MF, Chiu W, O'Malley BW. Structure of a biologically active estrogen receptor-coactivator complex on DNA. Mol Cell 2015; 57:1047-1058
  84. Boyes J, Byfield P, Nakatani Y, Ogryzko V. Regulation of activity of the transcription factor GATA-1 by acetylation. Nature 1998; 396:594-598
  85. Gu W, Roeder RG. Activation of p53 sequence-specific DNA binding by acetylation of the p53 C-terminal domain. Cell 1997; 90:595-606
  86. Chen H, Lin RJ, Xie W, Wilpitz D, Evans RM. Regulation of hormone-induced histone hyperacetylation and gene activation via acetylation of an acetylase. Cell 1999; 98:675-686
  87. Heery DM, Kalkhoven E, Hoare S, Parker MG. A signature motif in transcriptional co-activators mediates binding to nuclear receptors. Nature 1997; 387:733-736
  88. Darimont BD, Wagner RL, Apriletti JW, Stallcup MR, Kushner PJ, Baxter JD, Fletterick RJ, Yamamoto KR. Structure and specificity of nuclear receptor-coactivator interactions. Genes Dev 1998; 12:3343-3356
  89. Hurt DE, Suzuki S, Mayama T, Charmandari E, Kino T. Structural Analysis on the Pathologic Mutant Glucocorticoid Receptor Ligand-Binding Domains. Mol Endocrinol 2016; 30:173-188
  90. Fry CJ, Peterson CL. Chromatin remodeling enzymes: who's on first? Curr Biol 2001; 11:R185-197
  91. Yoshinaga SK, Peterson CL, Herskowitz I, Yamamoto KR. Roles of SWI1, SWI2, and SWI3 proteins for transcriptional enhancement by steroid receptors. Science 1992; 258:1598-1604
  92. Rachez C, Freedman LP. Mediator complexes and transcription. Curr Opin Cell Biol 2001; 13:274-280
  93. Henriksson A, Almlof T, Ford J, McEwan IJ, Gustafsson JA, Wright AP. Role of the Ada adaptor complex in gene activation by the glucocorticoid receptor. Mol Cell Biol 1997; 17:3065-3073
  94. Wallberg AE, Neely KE, Hassan AH, Gustafsson JA, Workman JL, Wright AP. Recruitment of the SWI-SNF chromatin remodeling complex as a mechanism of gene activation by the glucocorticoid receptor tau1 activation domain. Mol Cell Biol 2000; 20:2004-2013
  95. Ma H, Hong H, Huang SM, Irvine RA, Webb P, Kushner PJ, Coetzee GA, Stallcup MR. Multiple signal input and output domains of the 160-kilodalton nuclear receptor coactivator proteins. Mol Cell Biol 1999; 19:6164-6173
  96. Webb P, Nguyen P, Shinsako J, Anderson C, Feng W, Nguyen MP, Chen D, Huang SM, Subramanian S, McKinerney E, Katzenellenbogen BS, Stallcup MR, Kushner PJ. Estrogen receptor activation function 1 works by binding p160 coactivator proteins. Mol Endocrinol 1998; 12:1605-1618
  97. Wallberg AE, Neely KE, Gustafsson JA, Workman JL, Wright AP, Grant PA. Histone acetyltransferase complexes can mediate transcriptional activation by the major glucocorticoid receptor activation domain. Mol Cell Biol 1999; 19:5952-5959
  98. Hittelman AB, Burakov D, Iniguez-Lluhi JA, Freedman LP, Garabedian MJ. Differential regulation of glucocorticoid receptor transcriptional activation via AF-1-associated proteins. EMBO J 1999; 18:5380-5388
  99. Lanz RB, McKenna NJ, Onate SA, Albrecht U, Wong J, Tsai SY, Tsai MJ, O'Malley BW. A steroid receptor coactivator, SRA, functions as an RNA and is present in an SRC-1 complex. Cell 1999; 97:17-27
  100. Benecke A, Chambon P, Gronemeyer H. Synergy between estrogen receptor a activation functions AF1 and AF2 mediated by transcription intermediary factor TIF2. EMBO Rep 2000; 1:151-157
  101. Puigserver P, Spiegelman BM. Peroxisome proliferator-activated receptor-g coactivator 1a (PGC-1a): transcriptional coactivator and metabolic regulator. Endocr Rev 2003; 24:78-90
  102. Higashida K, Kim SH, Jung SR, Asaka M, Holloszy JO, Han DH. Effects of resveratrol and SIRT1 on PGC-1a activity and mitochondrial biogenesis: a reevaluation. PLoS Biol 2013; 11:e1001603
  103. Philp A, Chen A, Lan D, Meyer GA, Murphy AN, Knapp AE, Olfert IM, McCurdy CE, Marcotte GR, Hogan MC, Baar K, Schenk S. Sirtuin 1 (SIRT1) deacetylase activity is not required for mitochondrial biogenesis or peroxisome proliferator-activated receptor-g coactivator-1a (PGC-1a) deacetylation following endurance exercise. J Biol Chem 2011; 286:30561-30570
  104. Suzuki S, Iben JR, Coon SL, Kino T. SIRT1 is a transcriptional enhancer of the glucocorticoid receptor acting independently to its deacetylase activity Mol Cell Endocrinol 2018; 461:178-187
  105. Altarejos JY, Montminy M. CREB and the CRTC co-activators: sensors for hormonal and metabolic signals. Nat Rev Mol Cell Biol 2011; 12:141-151
  106. Hill MJ, Suzuki S, Segars JH, Kino T. CRTC2 Is a Coactivator of GR and Couples GR and CREB in the Regulation of Hepatic Gluconeogenesis. Mol Endocrinol 2016; 30:104-117
  107. Wu DY, Ou CY, Chodankar R, Siegmund KD, Stallcup MR. Distinct, genome-wide, gene-specific selectivity patterns of four glucocorticoid receptor coregulators. Nucl Recept Signal 2014; 12:e002
  108. Surjit M, Ganti KP, Mukherji A, Ye T, Hua G, Metzger D, Li M, Chambon P. Widespread negative response elements mediate direct repression by agonist-liganded glucocorticoid receptor. Cell 2011; 145:224-241
  109. Hudson WH, Youn C, Ortlund EA. The structural basis of direct glucocorticoid-mediated transrepression. Nat Struct Mol Biol 2013; 20:53-58
  110. Uhlenhaut NH, Barish GD, Yu RT, Downes M, Karunasiri M, Liddle C, Schwalie P, Hubner N, Evans RM. Insights into negative regulation by the glucocorticoid receptor from genome-wide profiling of inflammatory cistromes. Mol Cell 2013; 49:158-171
  111. Miner JN, Yamamoto KR. Regulatory crosstalk at composite response elements. Trends Biochem Sci 1991; 16:423-426
  112. Reichardt HM, Kaestner KH, Tuckermann J, Kretz O, Wessely O, Bock R, Gass P, Schmid W, Herrlich P, Angel P, Schutz G. DNA binding of the glucocorticoid receptor is not essential for survival. Cell 1998; 93:531-541
  113. Reichardt HM, Tuckermann JP, Gottlicher M, Vujic M, Weih F, Angel P, Herrlich P, Schutz G. Repression of inflammatory responses in the absence of DNA binding by the glucocorticoid receptor. EMBO J 2001; 20:7168-7173
  114. Karin M, Chang L. AP-1-glucocorticoid receptor crosstalk taken to a higher level. J Endocrinol 2001; 169:447-451
  115. Barnes PJ, Karin M. Nuclear factor-kB: a pivotal transcription factor in chronic inflammatory diseases. N Engl J Med 1997; 336:1066-1071
  116. Didonato JA, Saatcioglu F, Karin M. Molecular mechanisms of immunosuppression and anti-inflammatory activities by glucocorticoids. Am J Respir Crit Care Med 1996; 154:S11-15
  117. Liberman AC, Druker J, Garcia FA, Holsboer F, Arzt E. Intracellular molecular signaling. Basis for specificity to glucocorticoid anti-inflammatory actions. Ann N Y Acad Sci 2009; 1153:6-13
  118. Liberman AC, Refojo D, Druker J, Toscano M, Rein T, Holsboer F, Arzt E. The activated glucocorticoid receptor inhibits the transcription factor T-bet by direct protein-protein interaction. FASEB J 2007; 21:1177-1188
  119. Reily MM, Pantoja C, Hu X, Chinenov Y, Rogatsky I. The GRIP1:IRF3 interaction as a target for glucocorticoid receptor-mediated immunosuppression. EMBO J 2006; 25:108-117
  120. Perkins ND. The Rel/NF-kB family: friend and foe. Trends Biochem Sci 2000; 25:434-440
  121. McKay LI, Cidlowski JA. Molecular control of immune/inflammatory responses: interactions between nuclear factor-kB and steroid receptor-signaling pathways. Endocr Rev 1999; 20:435-459
  122. Caldenhoven E, Liden J, Wissink S, Van de Stolpe A, Raaijmakers J, Koenderman L, Okret S, Gustafsson JA, Van der Saag PT. Negative cross-talk between RelA and the glucocorticoid receptor: a possible mechanism for the antiinflammatory action of glucocorticoids. Mol Endocrinol 1995; 9:401-412
  123. Liden J, Delaunay F, Rafter I, Gustafsson J, Okret S. A new function for the C-terminal zinc finger of the glucocorticoid receptor. Repression of RelA transactivation. J Biol Chem 1997; 272:21467-21472
  124. Wissink S, van Heerde EC, Schmitz ML, Kalkhoven E, van der Burg B, Baeuerle PA, van der Saag PT. Distinct domains of the RelA NF-kB subunit are required for negative cross-talk and direct interaction with the glucocorticoid receptor. J Biol Chem 1997; 272:22278-22284
  125. McKay LI, Cidlowski JA. Cross-talk between nuclear factor-kB and the steroid hormone receptors: mechanisms of mutual antagonism. Mol Endocrinol 1998; 12:45-56
  126. Ito K, Barnes PJ, Adcock IM. Glucocorticoid receptor recruitment of histone deacetylase 2 inhibits interleukin-1b-induced histone H4 acetylation on lysines 8 and 12. Mol Cell Biol 2000; 20:6891-6903
  127. Nissen RM, Yamamoto KR. The glucocorticoid receptor inhibits NFkB by interfering with serine-2 phosphorylation of the RNA polymerase II carboxy-terminal domain. Genes Dev 2000; 14:2314-2329
  128. Auphan N, DiDonato JA, Rosette C, Helmberg A, Karin M. Immunosuppression by glucocorticoids: inhibition of NF-kB activity through induction of IkB synthesis. Science 1995; 270:286-290
  129. Chinenov Y, Gupte R, Dobrovolna J, Flammer JR, Liu B, Michelassi FE, Rogatsky I. Role of transcriptional coregulator GRIP1 in the anti-inflammatory actions of glucocorticoids. Proc Natl Acad Sci U S A 2012; 109:11776-11781
  130. Herrlich P. Cross-talk between glucocorticoid receptor and AP-1. Oncogene 2001; 20:2465-2475
  131. van Dam H, Castellazzi M. Distinct roles of Jun : Fos and Jun : ATF dimers in oncogenesis. Oncogene 2001; 20:2453-2464
  132. Kamei Y, Xu L, Heinzel T, Torchia J, Kurokawa R, Gloss B, Lin SC, Heyman RA, Rose DW, Glass CK, Rosenfeld MG. A CBP integrator complex mediates transcriptional activation and AP-1 inhibition by nuclear receptors. Cell 1996; 85:403-414
  133. Mayr B, Montminy M. Transcriptional regulation by the phosphorylation-dependent factor CREB. Nat Rev Mol Cell Biol 2001; 2:599-609
  134. Stauber C, Altschmied J, Akerblom IE, Marron JL, Mellon PL. Mutual cross-interference between glucocorticoid receptor and CREB inhibits transactivation in placental cells. New Biol 1992; 4:527-540
  135. Chatterjee VK, Madison LD, Mayo S, Jameson JL. Repression of the human glycoprotein hormone a-subunit gene by glucocorticoids: evidence for receptor interactions with limiting transcriptional activators. Mol Endocrinol 1991; 5:100-110
  136. Imai E, Miner JN, Mitchell JA, Yamamoto KR, Granner DK. Glucocorticoid receptor-cAMP response element-binding protein interaction and the response of the phosphoenolpyruvate carboxykinase gene to glucocorticoids. J Biol Chem 1993; 268:5353-5356
  137. Liu JL, Papachristou DN, Patel YC. Glucocorticoids activate somatostatin gene transcription through co-operative interaction with the cyclic AMP signalling pathway. Biochem J 1994; 301:863-869
  138. ten Dijke P, Miyazono K, Heldin CH. Signaling inputs converge on nuclear effectors in TGF-b signaling. Trends Biochem Sci 2000; 25:64-70
  139. Hata A, Lagna G, Massague J, Hemmati-Brivanlou A. Smad6 inhibits BMP/Smad1 signaling by specifically competing with the Smad4 tumor suppressor. Genes Dev 1998; 12:186-197
  140. Bai S, Shi X, Yang X, Cao X. Smad6 as a transcriptional corepressor. J Biol Chem 2000; 275:8267-8270
  141. Bai S, Cao X. A nuclear antagonistic mechanism of inhibitory Smads in transforming growth factor-b signaling. J Biol Chem 2002; 277:4176-4182
  142. Lin X, Liang YY, Sun B, Liang M, Shi Y, Brunicardi FC, Feng XH. Smad6 recruits transcription corepressor CtBP to repress bone morphogenetic protein-induced transcription. Mol Cell Biol 2003; 23:9081-9093
  143. Afrakhte M, Moren A, Jossan S, Itoh S, Sampath K, Westermark B, Heldin CH, Heldin NE, ten Dijke P. Induction of inhibitory Smad6 and Smad7 mRNA by TGF-b family members. Biochem Biophys Res Commun 1998; 249:505-511
  144. Miyazono K. Positive and negative regulation of TGF-b signaling. J Cell Sci 2000; 113:1101-1109
  145. Ichijo T, Voutetakis A, Cotrim AP, Bhattachryya N, Fujii M, Chrousos GP, Kino T. The Smad6-histone deacetylase 3 complex silences the transcriptional activity of the glucocorticoid receptor: potential clinical implications. J Biol Chem 2005; 280:42067-42077
  146. Emerson RO, Thomas JH. Adaptive evolution in zinc finger transcription factors. PLoS Genet 2009; 5:e1000325
  147. Mackeh R, Marr AK, Fadda A, Kino T. C2H2-type zinc finger proteins: evolutionarily old and new partners of the nuclear hormone receptors. Nucl Recept Signal 2017 (in press)
  148. Collins T, Stone JR, Williams AJ. All in the family: the BTB/POZ, KRAB, and SCAN domains. Mol Cell Biol 2001; 21:3609-3615
  149. Ong CT, Corces VG. CTCF: an architectural protein bridging genome topology and function. Nat Rev Genet 2014; 15:234-246
  150. Ross-Innes CS, Brown GD, Carroll JS. A co-ordinated interaction between CTCF and ER in breast cancer cells. BMC Genomics 2011; 12:593
  151. Awad TA, Bigler J, Ulmer JE, Hu YJ, Moore JM, Lutz M, Neiman PE, Collins SJ, Renkawitz R, Lobanenkov VV, Filippova GN. Negative transcriptional regulation mediated by thyroid hormone response element 144 requires binding of the multivalent factor CTCF to a novel target DNA sequence. J Biol Chem 1999; 274:27092-27098
  152. Kino T, Pavlatou MG, Moraitis AG, Nemery RL, Raygada M, Stratakis CA. ZNF764 haploinsufficiency may explain partial glucocorticoid, androgen, and thyroid hormone resistance associated with 16p11.2 microdeletion. J Clin Endocrinol Metab 2012; 97:E1557-1566
  153. Fadda A, Syed N, Mackeh R, Papadopoulou A, Suzuki S, Jithesh PV, Kino T. Genome-wide Regulatory Roles of the C2H2-type Zinc Finger Protein ZNF764 on the Glucocorticoid Receptor. Sci Rep 2017; 7:41598
  154. Carter ME, Brunet A. FOXO transcription factors. Curr Biol 2007; 17:R113-114
  155. Hurtado A, Holmes KA, Ross-Innes CS, Schmidt D, Carroll JS. FOXA1 is a key determinant of estrogen receptor function and endocrine response. Nat Genet 2011; 43:27-33
  156. Ma X, Xu L, Mueller E. Forkhead box A3 mediates glucocorticoid receptor function in adipose tissue. Proc Natl Acad Sci U S A 2016; 113:3377-3382
  157. De Martino MU, Bhattachryya N, Alesci S, Ichijo T, Chrousos GP, Kino T. The glucocorticoid receptor and the orphan nuclear receptor chicken ovalbumin upstream promoter-transcription factor II interact with and mutually affect each other's transcriptional activities: implications for intermediary metabolism. Mol Endocrinol 2004; 18:820-833
  158. Pierreux CE, Stafford J, Demonte D, Scott DK, Vandenhaute J, O'Brien RM, Granner DK, Rousseau GG, Lemaigre FP. Antiglucocorticoid activity of hepatocyte nuclear factor-6. Proc Natl Acad Sci U S A 1999; 96:8961-8966
  159. Philips A, Maira M, Mullick A, Chamberland M, Lesage S, Hugo P, Drouin J. Antagonism between Nur77 and glucocorticoid receptor for control of transcription. Mol Cell Biol 1997; 17:5952-5959
  160. Nader N, Ng SS, Wang Y, Abel BS, Chrousos GP, Kino T. Liver X receptors regulate the transcriptional activity of the glucocorticoid receptor: implications for the carbohydrate metabolism. PLoS One 2012; 7:e26751
  161. Patel R, Patel M, Tsai R, Lin V, Bookout AL, Zhang Y, Magomedova L, Li T, Chan JF, Budd C, Mangelsdorf DJ, Cummins CL. LXRb is required for glucocorticoid-induced hyperglycemia and hepatosteatosis in mice. J Clin Invest 2011; 121:431-441
  162. Renga B, Mencarelli A, D'Amore C, Cipriani S, Baldelli F, Zampella A, Distrutti E, Fiorucci S. Glucocorticoid receptor mediates the gluconeogenic activity of the farnesoid X receptor in the fasting condition. FASEB J 2012; 26:3021-3031
  163. Sengupta S, Vonesch JL, Waltzinger C, Zheng H, Wasylyk B. Negative cross-talk between p53 and the glucocorticoid receptor and its role in neuroblastoma cells. EMBO J 2000; 19:6051-6064
  164. Sengupta S, Wasylyk B. Ligand-dependent interaction of the glucocorticoid receptor with p53 enhances their degradation by Hdm2. Genes Dev 2001; 15:2367-2380
  165. Chandran UR, Warren BS, Baumann CT, Hager GL, DeFranco DB. The glucocorticoid receptor is tethered to DNA-bound Oct-1 at the mouse gonadotropin-releasing hormone distal negative glucocorticoid response element. J Biol Chem 1999; 274:2372-2378
  166. Subramaniam N, Cairns W, Okret S. Glucocorticoids repress transcription from a negative glucocorticoid response element recognized by two homeodomain-containing proteins, Pbx and Oct-1. J Biol Chem 1998; 273:23567-23574
  167. Prefontaine GG, Lemieux ME, Giffin W, Schild-Poulter C, Pope L, LaCasse E, Walker P, Hache RJ. Recruitment of octamer transcription factors to DNA by glucocorticoid receptor. Mol Cell Biol 1998; 18:3416-3430
  168. Truss M, Bartsch J, Schelbert A, Hache RJ, Beato M. Hormone induces binding of receptors and transcription factors to a rearranged nucleosome on the MMTV promoter in vivo. EMBO J 1995; 14:1737-1751
  169. Hartig E, Cato AC. In vivo binding of proteins to stably integrated MMTV DNA in murine cell lines: occupancy of NFI and OTF1 binding sites in the absence and presence of glucocorticoids. Cell Mol Biol Res 1994; 40:643-652
  170. Archer TK, Cordingley MG, Wolford RG, Hager GL. Transcription factor access is mediated by accurately positioned nucleosomes on the mouse mammary tumor virus promoter. Mol Cell Biol 1991; 11:688-698
  171. Chang TJ, Scher BM, Waxman S, Scher W. Inhibition of mouse GATA-1 function by the glucocorticoid receptor: possible mechanism of steroid inhibition of erythroleukemia cell differentiation. Mol Endocrinol 1993; 7:528-542
  172. Lekstrom-Himes J, Xanthopoulos KG. Biological role of the CCAAT/enhancer-binding protein family of transcription factors. J Biol Chem 1998; 273:28545-28548
  173. Nishio Y, Isshiki H, Kishimoto T, Akira S. A nuclear factor for interleukin-6 expression (NF-IL6) and the glucocorticoid receptor synergistically activate transcription of the rat a1-acid glycoprotein gene via direct protein-protein interaction. Mol Cell Biol 1993; 13:1854-1862
  174. Boruk M, Savory JG, Hache RJ. AF-2-dependent potentiation of CCAAT enhancer binding protein b-mediated transcriptional activation by glucocorticoid receptor. Mol Endocrinol 1998; 12:1749-1763
  175. Kulaeva OI, Hsieh FK, Chang HW, Luse DS, Studitsky VM. Mechanism of transcription through a nucleosome by RNA polymerase II. Biochim Biophys Acta 2013; 1829:76-83
  176. Kornberg RD, Lorch Y. Twenty-five years of the nucleosome, fundamental particle of the eukaryote chromosome. Cell 1999; 98:285-294
  177. Kuznetsova T, Wang SY, Rao NA, Mandoli A, Martens JH, Rother N, Aartse A, Groh L, Janssen-Megens EM, Li G, Ruan Y, Logie C, Stunnenberg HG. Glucocorticoid receptor and nuclear factor k-b affect three-dimensional chromatin organization. Genome Biol 2015; 16:264
  178. Baker M. Genomics: Genomes in three dimensions. Nature 2011; 470:289-294
  179. Stevens TJ, Lando D, Basu S, Atkinson LP, Cao Y, Lee SF, Leeb M, Wohlfahrt KJ, Boucher W, O'Shaughnessy-Kirwan A, Cramard J, Faure AJ, Ralser M, Blanco E, Morey L, Sanso M, Palayret MG, Lehner B, Di Croce L, Wutz A, Hendrich B, Klenerman D, Laue ED. 3D structures of individual mammalian genomes studied by single-cell Hi-C. Nature 2017; 544:59-64
  180. John S, Sabo PJ, Thurman RE, Sung MH, Biddie SC, Johnson TA, Hager GL, Stamatoyannopoulos JA. Chromatin accessibility pre-determines glucocorticoid receptor binding patterns. Nat Genet 2011; 43:264-268
  181. Grontved L, John S, Baek S, Liu Y, Buckley JR, Vinson C, Aguilera G, Hager GL. C/EBP maintains chromatin accessibility in liver and facilitates glucocorticoid receptor recruitment to steroid response elements. EMBO J 2013; 32:1568-1583
  182. Biddie SC, John S, Sabo PJ, Thurman RE, Johnson TA, Schiltz RL, Miranda TB, Sung MH, Trump S, Lightman SL, Vinson C, Stamatoyannopoulos JA, Hager GL. Transcription factor AP1 potentiates chromatin accessibility and glucocorticoid receptor binding. Mol Cell 2011; 43:145-155
  183. Sahu B, Laakso M, Pihlajamaa P, Ovaska K, Sinielnikov I, Hautaniemi S, Janne OA. FoxA1 specifies unique androgen and glucocorticoid receptor binding events in prostate cancer cells. Cancer Res 2013; 73:1570-1580
  184. Wiench M, John S, Baek S, Johnson TA, Sung MH, Escobar T, Simmons CA, Pearce KH, Biddie SC, Sabo PJ, Thurman RE, Stamatoyannopoulos JA, Hager GL. DNA methylation status predicts cell type-specific enhancer activity. EMBO J 2011; 30:3028-3039
  185. Swinstead EE, Miranda TB, Paakinaho V, Baek S, Goldstein I, Hawkins M, Karpova TS, Ball D, Mazza D, Lavis LD, Grimm JB, Morisaki T, Grontved L, Presman DM, Hager GL. Steroid Receptors Reprogram FoxA1 Occupancy through Dynamic Chromatin Transitions. Cell 2016; 165:593-605
  186. Maranville JC, Luca F, Richards AL, Wen X, Witonsky DB, Baxter S, Stephens M, Di Rienzo A. Interactions between glucocorticoid treatment and cis-regulatory polymorphisms contribute to cellular response phenotypes. PLoS Genet 2011; 7:e1002162
  187. Maurano MT, Humbert R, Rynes E, Thurman RE, Haugen E, Wang H, Reynolds AP, Sandstrom R, Qu H, Brody J, Shafer A, Neri F, Lee K, Kutyavin T, Stehling-Sun S, Johnson AK, Canfield TK, Giste E, Diegel M, Bates D, Hansen RS, Neph S, Sabo PJ, Heimfeld S, Raubitschek A, Ziegler S, Cotsapas C, Sotoodehnia N, Glass I, Sunyaev SR, Kaul R, Stamatoyannopoulos JA. Systematic localization of common disease-associated variation in regulatory DNA. Science 2012; 337:1190-1195
  188. Kellendonk C, Tronche F, Reichardt HM, Bauer A, Greiner E, Schmid W, Schutz G. Analysis of glucocorticoid receptor function in the mouse by gene targeting. Ernst Schering Res Found Workshop 2002:305-318
  189. Bauer A, Tronche F, Wessely O, Kellendonk C, Reichardt HM, Steinlein P, Schutz G, Beug H. The glucocorticoid receptor is required for stress erythropoiesis. Genes Dev 1999; 13:2996-3002
  190. Opherk C, Tronche F, Kellendonk C, Kohlmuller D, Schulze A, Schmid W, Schutz G. Inactivation of the glucocorticoid receptor in hepatocytes leads to fasting hypoglycemia and ameliorates hyperglycemia in streptozotocin-induced diabetes mellitus. Mol Endocrinol 2004; 18:1346-1353
  191. Boyle MP, Brewer JA, Funatsu M, Wozniak DF, Tsien JZ, Izumi Y, Muglia LJ. Acquired deficit of forebrain glucocorticoid receptor produces depression-like changes in adrenal axis regulation and behavior. Proc Natl Acad Sci U S A 2005; 102:473-478
  192. Laryea G, Schutz G, Muglia LJ. Disrupting hypothalamic glucocorticoid receptors causes HPA axis hyperactivity and excess adiposity. Mol Endocrinol 2013; 27:1655-1665
  193. Chmielarz P, Kusmierczyk J, Parlato R, Schutz G, Nalepa I, Kreiner G. Inactivation of glucocorticoid receptor in noradrenergic system influences anxiety- and depressive-like behavior in mice. PLoS One 2013; 8:e72632
  194. Rog-Zielinska EA, Thomson A, Kenyon CJ, Brownstein DG, Moran CM, Szumska D, Michailidou Z, Richardson J, Owen E, Watt A, Morrison H, Forrester LM, Bhattacharya S, Holmes MC, Chapman KE. Glucocorticoid receptor is required for foetal heart maturation. Hum Mol Genet 2013; 22:3269-3282
  195. Goodwin JE, Zhang J, Gonzalez D, Albinsson S, Geller DS. Knockout of the vascular endothelial glucocorticoid receptor abrogates dexamethasone-induced hypertension. J Hypertens 2011; 29:1347-1356
  196. Goodwin JE, Feng Y, Velazquez H, Sessa WC. Endothelial glucocorticoid receptor is required for protection against sepsis. Proc Natl Acad Sci U S A 2013; 110:306-311
  197. Goodwin JE, Feng Y, Velazquez H, Zhou H, Sessa WC. Loss of the endothelial glucocorticoid receptor prevents the therapeutic protection afforded by dexamethasone after LPS. PLoS One 2014; 9:e108126
  198. Kugler DG, Mittelstadt PR, Ashwell JD, Sher A, Jankovic D. CD4+ T cells are trigger and target of the glucocorticoid response that prevents lethal immunopathology in toxoplasma infection. J Exp Med 2013; 210:1919-1927
  199. Whirledge SD, Oakley RH, Myers PH, Lydon JP, DeMayo F, Cidlowski JA. Uterine glucocorticoid receptors are critical for fertility in mice through control of embryo implantation and decidualization. Proc Natl Acad Sci U S A 2015; 112:15166-15171
  200. Hazra R, Upton D, Jimenez M, Desai R, Handelsman DJ, Allan CM. In vivo actions of the Sertoli cell glucocorticoid receptor. Endocrinology 2014; 155:1120-1130
  201. Adams M, Meijer OC, Wang J, Bhargava A, Pearce D. Homodimerization of the glucocorticoid receptor is not essential for response element binding: activation of the phenylethanolamine N-methyltransferase gene by dimerization-defective mutants. Mol Endocrinol 2003; 17:2583-2592
  202. Rosen J, Miner JN. The search for safer glucocorticoid receptor ligands. Endocr Rev 2005; 26:452-464
  203. Vayssiere BM, Dupont S, Choquart A, Petit F, Garcia T, Marchandeau C, Gronemeyer H, Resche-Rigon M. Synthetic glucocorticoids that dissociate transactivation and AP-1 transrepression exhibit antiinflammatory activity in vivo. Mol Endocrinol 1997; 11:1245-1255
  204. Coghlan MJ, Jacobson PB, Lane B, Nakane M, Lin CW, Elmore SW, Kym PR, Luly JR, Carter GW, Turner R, Tyree CM, Hu J, Elgort M, Rosen J, Miner JN. A novel antiinflammatory maintains glucocorticoid efficacy with reduced side effects. Mol Endocrinol 2003; 17:860-869
  205. Schacke H, Schottelius A, Docke WD, Strehlke P, Jaroch S, Schmees N, Rehwinkel H, Hennekes H, Asadullah K. Dissociation of transactivation from transrepression by a selective glucocorticoid receptor agonist leads to separation of therapeutic effects from side effects. Proc Natl Acad Sci U S A 2004; 101:227-232
  206. Zalachoras I, Houtman R, Atucha E, Devos R, Tijssen AM, Hu P, Lockey PM, Datson NA, Belanoff JK, Lucassen PJ, Joels M, de Kloet ER, Roozendaal B, Hunt H, Meijer OC. Differential targeting of brain stress circuits with a selective glucocorticoid receptor modulator. Proc Natl Acad Sci U S A 2013; 110:7910-7915
  207. Yoshikawa N, Makino Y, Okamoto K, Morimoto C, Makino I, Tanaka H. Distinct interaction of cortivazol with the ligand binding domain confers glucocorticoid receptor specificity: cortivazol is a specific ligand for the glucocorticoid receptor. J Biol Chem 2002; 277:5529-5540
  208. Miner JN, Tyree C, Hu J, Berger E, Marschke K, Nakane M, Coghlan MJ, Clemm D, Lane B, Rosen J. A nonsteroidal glucocorticoid receptor antagonist. Mol Endocrinol 2003; 17:117-127
  209. Clark RD, Ray NC, Williams K, Blaney P, Ward S, Crackett PH, Hurley C, Dyke HJ, Clark DE, Lockey P, Devos R, Wong M, Porres SS, Bright CP, Jenkins RE, Belanoff J. 1H-Pyrazolo[3,4-g]hexahydro-isoquinolines as selective glucocorticoid receptor antagonists with high functional activity. Bioorg Med Chem Lett 2008; 18:1312-1317
  210. Solomon MB, Wulsin AC, Rice T, Wick D, Myers B, McKlveen J, Flak JN, Ulrich-Lai Y, Herman JP. The selective glucocorticoid receptor antagonist CORT 108297 decreases neuroendocrine stress responses and immobility in the forced swim test. Horm Behav 2014; 65:363-371
  211. Trebble PJ, Woolven JM, Saunders KA, Simpson KD, Farrow SN, Matthews LC, Ray DW. A ligand-specific kinetic switch regulates glucocorticoid receptor trafficking and function. J Cell Sci 2013; 126:3159-3169
  212. Brown AR, Bosies M, Cameron H, Clark J, Cowley A, Craighead M, Elmore MA, Firth A, Goodwin R, Goutcher S, Grant E, Grassie M, Grove SJ, Hamilton NM, Hampson H, Hillier A, Ho KK, Kiczun M, Kingsbury C, Kultgen SG, Littlewood PT, Lusher SJ, Macdonald S, McIntosh L, McIntyre T, Mistry A, Morphy JR, Nimz O, Ohlmeyer M, Pick J, Rankovic Z, Sherborne B, Smith A, Speake M, Spinks G, Thomson F, Watson L, Weston M. Discovery and optimisation of a selective non-steroidal glucocorticoid receptor antagonist. Bioorg Med Chem Lett 2011; 21:137-140
  213. Vollmer TR, Stockhausen A, Zhang JZ. Anti-inflammatory effects of mapracorat, a novel selective glucocorticoid receptor agonist, is partially mediated by MAP kinase phosphatase-1 (MKP-1). J Biol Chem 2012; 287:35212-35221
  214. Du J, Cheng B, Zhu X, Ling C. Ginsenoside Rg1, a novel glucocorticoid receptor agonist of plant origin, maintains glucocorticoid efficacy with reduced side effects. J Immunol 2011; 187:942-950
  215. De Bosscher K, Vanden Berghe W, Beck IM, Van Molle W, Hennuyer N, Hapgood J, Libert C, Staels B, Louw A, Haegeman G. A fully dissociated compound of plant origin for inflammatory gene repression. Proc Natl Acad Sci U S A 2005; 102:15827-15832
  216. Liberman AC, Antunica-Noguerol M, Ferraz-de-Paula V, Palermo-Neto J, Castro CN, Druker J, Holsboer F, Perone MJ, Gerlo S, De Bosscher K, Haegeman G, Arzt E. Compound A, a dissociated glucocorticoid receptor modulator, inhibits T-bet (Th1) and induces GATA-3 (Th2) activity in immune cells. PLoS One 2012; 7:e35155
  217. Reuter KC, Loitsch SM, Dignass AU, Steinhilber D, Stein J. Selective non-steroidal glucocorticoid receptor agonists attenuate inflammation but do not impair intestinal epithelial cell restitution in vitro. PLoS One 2012; 7:e29756
  218. De Bosscher K, Beck IM, Dejager L, Bougarne N, Gaigneaux A, Chateauvieux S, Ratman D, Bracke M, Tavernier J, Vanden Berghe W, Libert C, Diederich M, Haegeman G. Selective modulation of the glucocorticoid receptor can distinguish between transrepression of NF-kB and AP-1. Cell Mol Life Sci 2014; 71:143-163
  219. Lesovaya E, Yemelyanov A, Kirsanov K, Popa A, Belitsky G, Yakubovskaya M, Gordon LI, Rosen ST, Budunova I. Combination of a selective activator of the glucocorticoid receptor Compound A with a proteasome inhibitor as a novel strategy for chemotherapy of hematologic malignancies. Cell Cycle 2013; 12:133-144
  220. Zheng Y, Ishiguro H, Ide H, Inoue S, Kashiwagi E, Kawahara T, Jalalizadeh M, Reis LO, Miyamoto H. Compound A inhibits bladder cancer growth predominantly via glucocorticoid receptor transrepression. Mol Endocrinol 2015; 29:1486-1497
  221. Chen Z, Lan X, Wu D, Sunkel B, Ye Z, Huang J, Liu Z, Clinton SK, Jin VX, Wang Q. Ligand-dependent genomic function of glucocorticoid receptor in triple-negative breast cancer. Nat Commun 2015; 6:8323
  222. Muir DC, Howard PH. Are there other persistent organic pollutants? A challenge for environmental chemists. Environ Sci Technol 2006; 40:7157-7166
  223. Soto AM, Rubin BS, Sonnenschein C. Interpreting endocrine disruption from an integrative biology perspective. Mol Cell Endocrinol 2009; 304:3-7
  224. Kolsek K, Gobec M, Mlinaric Rascan I, Sollner Dolenc M. Screening of bisphenol A, triclosan and paraben analogues as modulators of the glucocorticoid and androgen receptor activities. Toxicol In Vitro 2015; 29:8-15
  225. Sarath Josh MK, Pradeep S, Vijayalekshmy Amma KS, Sudha Devi R, Balachandran S, Sreejith MN, Benjamin S. Human ketosteroid receptors interact with hazardous phthalate plasticizers and their metabolites: an in silico study. J Appl Toxicol 2016; 36:836-843
  226. Lattin CR, Romero LM. Chronic exposure to a low dose of ingested petroleum disrupts corticosterone receptor signalling in a tissue-specific manner in the house sparrow (Passer domesticus). Conserv Physiol 2014; 2:cou058
  227. Regnier SM, Kirkley AG, Ye H, El-Hashani E, Zhang X, Neel BA, Kamau W, Thomas CC, Williams AK, Hayes ET, Massad NL, Johnson DN, Huang L, Zhang C, Sargis RM. Dietary exposure to the endocrine disruptor tolylfluanid promotes global metabolic dysfunction in male mice. Endocrinology 2015; 156:896-910
  228. Chantigny YA, Murray JC, Kleinman EF, Robinson RP, Plotkin MA, Reese MR, Buckbinder L, McNiff PA, Millham ML, Schaefer JF, Abramov YA, Bordner J. 2-Aryl-3-methyloctahydrophenanthrene-2,3,7-triols as potent dissociated glucocorticoid receptor agonists. J Med Chem 2015; 58:2658-2677
  229. Atucha E, Zalachoras I, van den Heuvel JK, van Weert LT, Melchers D, Mol IM, Belanoff JK, Houtman R, Hunt H, Roozendaal B, Meijer OC. A mixed glucocorticoid/mineralocorticoid selective modulator with dominant antagonism in the male rat brain. Endocrinology 2015; 156:4105-4114
  230. Eda M, Kuroda T, Kaneko S, Aoki Y, Yamashita M, Okumura C, Ikeda Y, Ohbora T, Sakaue M, Koyama N, Aritomo K. Synthesis and biological evaluation of cyclopentaquinoline derivatives as nonsteroidal glucocorticoid receptor antagonists. J Med Chem 2015; 58:4918-4926
  231. Harcken C, Riether D, Kuzmich D, Liu P, Betageri R, Ralph M, Emmanuel M, Reeves JT, Berry A, Souza D, Nelson RM, Kukulka A, Fadra TN, Zuvela-Jelaska L, Dinallo R, Bentzien J, Nabozny GH, Thomson DS. Identification of highly efficacious glucocorticoid receptor agonists with a potential for reduced clinical bone side effects. J Med Chem 2014; 57:1583-1598
  232. Xiao HY, Wu DR, Sheppeck JE, 2nd, Habte SF, Cunningham MD, Somerville JE, Barrish JC, Nadler SG, Dhar TG. Heterocyclic glucocorticoid receptor modulators with a 2,2-dimethyl-3-phenyl-N-(thiazol or thiadiazol-2-yl)propanamide core. Bioorg Med Chem Lett 2013; 23:5571-5574
  233. Sindelar DK, Carson MW, Morin M, Shaw J, Barr RJ, Need A, Alexander-Chacko J, Coghlan M, Gehlert DR. LLY-2707, a novel nonsteroidal glucocorticoid antagonist that reduces atypical antipsychotic-associated weight gain in rats. J Pharmacol Exp Ther 2014; 348:192-201
  234. Lin HR. Triterpenes from Alisma orientalis act as androgen receptor agonists, progesterone receptor antagonists, and glucocorticoid receptor antagonists. Bioorg Med Chem Lett 2014; 24:3626-3632
  235. Chirumamilla CS, Palagani A, Kamaraj B, Declerck K, Verbeek MWC, Oksana R, De Bosscher K, Bougarne N, Ruttens B, Gevaert K, Houtman R, De Vos WH, Joossens J, Van Der Veken P, Augustyns K, Van Ostade X, Bogaerts A, De Winter H, Vanden Berghe W. Selective Glucocorticoid Receptor Properties of GSK866 Analogs with Cysteine Reactive Warheads. Front Immunol. 2017; 8:1324
  236. Ripa L, Edman K, Dearman M, Edenro G, Hendrickx R, Ullah V, Chang HF, Lepistö M, Chapman D, Geschwindner S, Wissler L, Svanberg P, Lawitz K, Malmberg J, Nikitidis A, Olsson RI, Bird J, Llinas A, Hegelund-Myrbäck T, Berger M, Thorne P, Harrison R, Köhler C, Drmota T. Discovery of a Novel Oral Glucocorticoid Receptor Modulator (AZD9567) with Improved Side Effect Profile. J Med Chem. 2018; 61(5):1785-1799
  237. Potamitis C, Siakouli D, Papavasileiou KD, Boulaka A, Ganou V, Roussaki M, Calogeropoulou T, Zoumpoulakis P, Alexis MN, Zervou M, Mitsiou DJ. Discovery of new non-steroidal selective glucocorticoid receptor agonists. J Steroid Biochem Mol Biol. 2019; 186:142-153
  238. Zhang T, Liang Y, Zuo P, Yan M, Jing S, Li T, Wang Y, Zhang J, Wei Z. Identification of 20(R, S)-protopanaxadiol and 20(R, S)-protopanaxatriol for potential selective modulation of glucocorticoid receptor. Food Chem Toxicol. 2019; 131:110642
  239. Leng Y, Sun Y, Lv C, Li Z, Yuan C, Zhang J, Li T, Wang Y. Characterization of β-Sitosterol for Potential Selective GR Modulation. Protein Pept Lett. 2020 Aug 13. doi: 10.2174/0929866527666200813204833. Online ahead of print.
  240. Faus H, Haendler B. Post-translational modifications of steroid receptors. Biomed Pharmacother 2006; 60:520-528
  241. Fu M, Liu M, Sauve AA, Jiao X, Zhang X, Wu X, Powell MJ, Yang T, Gu W, Avantaggiati ML, Pattabiraman N, Pestell TG, Wang F, Quong AA, Wang C, Pestell RG. Hormonal control of androgen receptor function through SIRT1. Mol Cell Biol 2006; 26:8122-8135
  242. Kim MY, Woo EM, Chong YT, Homenko DR, Kraus WL. Acetylation of estrogen receptor a by p300 at lysines 266 and 268 enhances the deoxyribonucleic acid binding and transactivation activities of the receptor. Mol Endocrinol 2006; 20:1479-1493
  243. Ito K, Yamamura S, Essilfie-Quaye S, Cosio B, Ito M, Barnes PJ, Adcock IM. Histone deacetylase 2-mediated deacetylation of the glucocorticoid receptor enables NF-kB suppression. J Exp Med 2006; 203:7-13
  244. Nader N, Chrousos GP, Kino T. Circadian rhythm transcription factor CLOCK regulates the transcriptional activity of the glucocorticoid receptor by acetylating its hinge region lysine cluster: potential physiological implications. FASEB J 2009; 23:1572-1583
  245. Takahashi JS, Hong HK, Ko CH, McDearmon EL. The genetics of mammalian circadian order and disorder: implications for physiology and disease. Nat Rev Genet 2008; 9:764-775
  246. Doi M, Hirayama J, Sassone-Corsi P. Circadian regulator CLOCK is a histone acetyltransferase. Cell 2006; 125:497-508
  247. Melvin VS, Harrell C, Adelman JS, Kraus WL, Churchill M, Edwards DP. The role of the C-terminal extension (CTE) of the estrogen receptor a and b DNA binding domain in DNA binding and interaction with HMGB. J Biol Chem 2004; 279:14763-14771
  248. Nader N, Chrousos GP, Kino T. Interactions of the circadian CLOCK system and the HPA axis. Trends Endocrinol Metab 2010; 21:277-286
  249. Charmandari E, Chrousos GP, Lambrou GI, Pavlaki A, Koide H, Ng SS, Kino T. Peripheral CLOCK regulates target-tissue glucocorticoid receptor transcriptional activity in a circadian fashion in man. PLoS One 2011; 6:e25612
  250. Pavlatou MG, Vickers KC, Varma S, Malek R, Sampson M, Remaley AT, Gold PW, Skarulis MC, Kino T. Circulating cortisol-associated signature of glucocorticoid-related gene expression in subcutaneous fat of obese subjects. Obesity (Silver Spring) 2013; 21:960-967
  251. Nicolaides NC, Charmandari E, Kino T, Chrousos GP. Stress-Related and Circadian Secretion and Target Tissue Actions of Glucocorticoids: Impact on Health. Front Endocrinol (Lausanne). 2017; 8:70
  252. Agorastos A, Nicolaides NC, Bozikas VP, Chrousos GP, Pervanidou P. Multilevel Interactions of Stress and Circadian System: Implications for Traumatic Stress. Front Psychiatry. 2020; 10:1003
  253. Lamia KA, Papp SJ, Yu RT, Barish GD, Uhlenhaut NH, Jonker JW, Downes M, Evans RM. Cryptochromes mediate rhythmic repression of the glucocorticoid receptor. Nature 2011; 480:552-556
  254. Balsalobre A, Brown SA, Marcacci L, Tronche F, Kellendonk C, Reichardt HM, Schutz G, Schibler U. Resetting of circadian time in peripheral tissues by glucocorticoid signaling. Science 2000; 289:2344-2347
  255. So AY, Bernal TU, Pillsbury ML, Yamamoto KR, Feldman BJ. Glucocorticoid regulation of the circadian clock modulates glucose homeostasis. Proc Natl Acad Sci U S A 2009; 106:17582-17587
  256. Leliavski A, Dumbell R, Ott V, Oster H. Adrenal clocks and the role of adrenal hormones in the regulation of circadian physiology. J Biol Rhythms 2015; 30:20-34
  257. Ikeda Y, Kumagai H, Skach A, Sato M, Yanagisawa M. Modulation of circadian glucocorticoid oscillation via adrenal opioid-CXCR7 signaling alters emotional behavior. Cell 2013; 155:1323-1336
  258. Kino T, Chrousos GP. Circadian CLOCK-mediated regulation of target-tissue sensitivity to glucocorticoids: implications for cardiometabolic diseases. Endocr Dev 2011; 20:116-126
  259. Ismaili N, Garabedian MJ. Modulation of glucocorticoid receptor function via phosphorylation. Ann N Y Acad Sci 2004; 1024:86-101
  260. Orti E, Hu LM, Munck A. Kinetics of glucocorticoid receptor phosphorylation in intact cells. Evidence for hormone-induced hyperphosphorylation after activation and recycling of hyperphosphorylated receptors. J Biol Chem 1993; 268:7779-7784
  261. Kino T. GR-regulating Serine/Threonine Kinases: New Physiologic and Pathologic Implications. Trends Endocrinol Metab. 2018; 29(4):260-270
  262. Krstic MD, Rogatsky I, Yamamoto KR, Garabedian MJ. Mitogen-activated and cyclin-dependent protein kinases selectively and differentially modulate transcriptional enhancement by the glucocorticoid receptor. Mol Cell Biol 1997; 17:3947-3954
  263. Wang Z, Frederick J, Garabedian MJ. Deciphering the phosphorylation "code" of the glucocorticoid receptor in vivo. J Biol Chem 2002; 277:26573-26580
  264. Miller AL, Webb MS, Copik AJ, Wang Y, Johnson BH, Kumar R, Thompson EB. p38 Mitogen-activated protein kinase (MAPK) is a key mediator in glucocorticoid-induced apoptosis of lymphoid cells: correlation between p38 MAPK activation and site-specific phosphorylation of the human glucocorticoid receptor at serine 211. Mol Endocrinol 2005; 19:1569-1583
  265. Carruthers CW, Suh JH, Gustafsson JA, Webb P. Phosphorylation of glucocorticoid receptor tau1c transactivation domain enhances binding to CREB binding protein (CBP) TAZ2. Biochem Biophys Res Commun 2015; 457:119-123
  266. Ismaili N, Blind R, Garabedian MJ. Stabilization of the unliganded glucocorticoid receptor by TSG101. J Biol Chem 2005; 280:11120-11126
  267. Rogatsky I, Waase CL, Garabedian MJ. Phosphorylation and inhibition of rat glucocorticoid receptor transcriptional activation by glycogen synthase kinase-3 (GSK-3). Species-specific differences between human and rat glucocorticoid receptor signaling as revealed through GSK-3 phosphorylation. J Biol Chem 1998; 273:14315-14321
  268. Galliher-Beckley AJ, Williams JG, Collins JB, Cidlowski JA. Glycogen synthase kinase 3b-mediated serine phosphorylation of the human glucocorticoid receptor redirects gene expression profiles. Mol Cell Biol 2008; 28:7309-7322
  269. Wang Z, Chen W, Kono E, Dang T, Garabedian MJ. Modulation of glucocorticoid receptor phosphorylation and transcriptional activity by a C-terminal-associated protein phosphatase. Mol Endocrinol 2007; 21:625-634
  270. Bouazza B, Krytska K, Debba-Pavard M, Amrani Y, Honkanen RE, Tran J, Tliba O. Cytokines alter glucocorticoid receptor phosphorylation in airway cells: role of phosphatases. Am J Respir Cell Mol Biol 2012; 47:464-473
  271. Kobayashi Y, Mercado N, Miller-Larsson A, Barnes PJ, Ito K. Increased corticosteroid sensitivity by a long acting b2 agonist formoterol via b2 adrenoceptor independent protein phosphatase 2A activation. Pulm Pharmacol Ther 2012; 25:201-207
  272. Kobayashi Y, Mercado N, Barnes PJ, Ito K. Defects of protein phosphatase 2A causes corticosteroid insensitivity in severe asthma. PLoS One 2011; 6:e27627
  273. Kino T, Ichijo T, Amin ND, Kesavapany S, Wang Y, Kim N, Rao S, Player A, Zheng YL, Garabedian MJ, Kawasaki E, Pant HC, Chrousos GP. Cyclin-dependent kinase 5 differentially regulates the transcriptional activity of the glucocorticoid receptor through phosphorylation: clinical implications for the nervous system response to glucocorticoids and stress. Mol Endocrinol 2007; 21:1552-1568
  274. Dhavan R, Tsai LH. A decade of CDK5. Nat Rev Mol Cell Biol 2001; 2:749-759
  275. Kino T, Jaffe H, Amin ND, Chakrabarti M, Zheng YL, Chrousos GP, Pant HC. Cyclin-dependent kinase 5 modulates the transcriptional activity of the mineralocorticoid receptor and regulates expression of brain-derived neurotrophic factor. Mol Endocrinol 2010; 24:941-952
  276. Sousa N, Almeida OF. Corticosteroids: sculptors of the hippocampal formation. Rev Neurosci 2002; 13:59-84
  277. Nagahara AH, Merrill DA, Coppola G, Tsukada S, Schroeder BE, Shaked GM, Wang L, Blesch A, Kim A, Conner JM, Rockenstein E, Chao MV, Koo EH, Geschwind D, Masliah E, Chiba AA, Tuszynski MH. Neuroprotective effects of brain-derived neurotrophic factor in rodent and primate models of Alzheimer's disease. Nat Med 2009; 15:331-337
  278. Yulug B, Ozan E, Gonul AS, Kilic E. Brain-derived neurotrophic factor, stress and depression: a minireview. Brain Res Bull 2009; 78:267-269
  279. Papadopoulou A, Siamatras T, Delgado-Morales R, Amin ND, Shukla V, Zheng YL, Pant HC, Almeida OF, Kino T. Acute and chronic stress differentially regulate cyclin-dependent kinase 5 in mouse brain: implications to glucocorticoid actions and major depression. Transl Psychiatry 2015; 5:e578
  280. Nader N, Ng SS, Lambrou GI, Pervanidou P, Wang Y, Chrousos GP, Kino T. Adenosine 5'-monophosphate-activated protein kinase regulates metabolic actions of glucocorticoids by phosphorylating the glucocorticoid receptor through p38 mitogen-activated protein kinase. Mol Endocrinol 2010; 24:1748-1764
  281. Piovan E, Yu J, Tosello V, Herranz D, Ambesi-Impiombato A, Da Silva AC, Sanchez-Martin M, Perez-Garcia A, Rigo I, Castillo M, Indraccolo S, Cross JR, de Stanchina E, Paietta E, Racevskis J, Rowe JM, Tallman MS, Basso G, Meijerink JP, Cordon-Cardo C, Califano A, Ferrando AA. Direct reversal of glucocorticoid resistance by AKT inhibition in acute lymphoblastic leukemia. Cancer Cell 2013; 24:766-776
  282. Wakui H, Wright AP, Gustafsson J, Zilliacus J. Interaction of the ligand-activated glucocorticoid receptor with the 14-3-3h protein. J Biol Chem 1997; 272:8153-8156
  283. Dennis AP, O'Malley BW. Rush hour at the promoter: how the ubiquitin-proteasome pathway polices the traffic flow of nuclear receptor-dependent transcription. J Steroid Biochem Mol Biol 2005; 93:139-151
  284. Jason LJ, Moore SC, Lewis JD, Lindsey G, Ausio J. Histone ubiquitination: a tagging tail unfolds? Bioessays 2002; 24:166-174
  285. Gillette TG, Gonzalez F, Delahodde A, Johnston SA, Kodadek T. Physical and functional association of RNA polymerase II and the proteasome. Proc Natl Acad Sci U S A 2004; 101:5904-5909
  286. Wallace AD, Cidlowski JA. Proteasome-mediated glucocorticoid receptor degradation restricts transcriptional signaling by glucocorticoids. J Biol Chem 2001; 276:42714-42721
  287. Deroo BJ, Rentsch C, Sampath S, Young J, DeFranco DB, Archer TK. Proteasomal inhibition enhances glucocorticoid receptor transactivation and alters its subnuclear trafficking. Mol Cell Biol 2002; 22:4113-4123
  288. Schaaf MJ, Cidlowski JA. Molecular determinants of glucocorticoid receptor mobility in living cells: the importance of ligand affinity. Mol Cell Biol 2003; 23:1922-1934
  289. Andreou AM, Tavernarakis N. SUMOylation and cell signalling. Biotechnol J 2009; 4:1740-1752
  290. Holmstrom S, Van Antwerp ME, Iniguez-Lluhi JA. Direct and distinguishable inhibitory roles for SUMO isoforms in the control of transcriptional synergy. Proc Natl Acad Sci U S A 2003; 100:15758-15763
  291. Davies L, Karthikeyan N, Lynch JT, Sial EA, Gkourtsa A, Demonacos C, Krstic-Demonacos M. Cross talk of signaling pathways in the regulation of the glucocorticoid receptor function. Mol Endocrinol 2008; 22:1331-1344
  292. Tian S, Poukka H, Palvimo JJ, Janne OA. Small ubiquitin-related modifier-1 (SUMO-1) modification of the glucocorticoid receptor. Biochem J 2002; 367:907-911
  293. Le Drean Y, Mincheneau N, Le Goff P, Michel D. Potentiation of glucocorticoid receptor transcriptional activity by sumoylation. Endocrinology 2002; 143:3482-3489
  294. Druker J, Liberman AC, Antunica-Noguerol M, Gerez J, Paez-Pereda M, Rein T, Iniguez-Lluhi JA, Holsboer F, Arzt E. RSUME enhances glucocorticoid receptor SUMOylation and transcriptional activity. Mol Cell Biol 2013; 33:2116-2127
  295. Lin DY, Huang YS, Jeng JC, Kuo HY, Chang CC, Chao TT, Ho CC, Chen YC, Lin TP, Fang HI, Hung CC, Suen CS, Hwang MJ, Chang KS, Maul GG, Shih HM. Role of SUMO-interacting motif in Daxx SUMO modification, subnuclear localization, and repression of sumoylated transcription factors. Mol Cell 2006; 24:341-354
  296. Tirard M, Jasbinsek J, Almeida OF, Michaelidis TM. The manifold actions of the protein inhibitor of activated STAT proteins on the transcriptional activity of mineralocorticoid and glucocorticoid receptors in neural cells. J Mol Endocrinol 2004; 32:825-841
  297. Yang SH, Sharrocks AD. SUMO promotes HDAC-mediated transcriptional repression. Mol Cell 2004; 13:611-617
  298. Holmstrom SR, Chupreta S, So AY, Iniguez-Lluhi JA. SUMO-mediated inhibition of glucocorticoid receptor synergistic activity depends on stable assembly at the promoter but not on DAXX. Mol Endocrinol 2008; 22:2061-2075
  299. Hua G, Paulen L, Chambon P. GR SUMOylation and formation of an SUMO-SMRT/NCoR1-HDAC3 repressing complex is mandatory for GC-induced IR nGRE-mediated transrepression. Proc Natl Acad Sci U S A 2016; 113:E626-634
  300. Seckl JR, Walker BR. Minireview: 11b-hydroxysteroid dehydrogenase type 1 - a tissue-specific amplifier of glucocorticoid action. Endocrinology 2001; 142:1371-1376
  301. Masuzaki H, Paterson J, Shinyama H, Morton NM, Mullins JJ, Seckl JR, Flier JS. A transgenic model of visceral obesity and the metabolic syndrome. Science 2001; 294:2166-2170
  302. Masuzaki H, Yamamoto H, Kenyon CJ, Elmquist JK, Morton NM, Paterson JM, Shinyama H, Sharp MG, Fleming S, Mullins JJ, Seckl JR, Flier JS. Transgenic amplification of glucocorticoid action in adipose tissue causes high blood pressure in mice. J Clin Invest 2003; 112:83-90
  303. Grad I, Picard D. The glucocorticoid responses are shaped by molecular chaperones. Mol Cell Endocrinol 2007; 275:2-12
  304. Alvira S, Cuellar J, Rohl A, Yamamoto S, Itoh H, Alfonso C, Rivas G, Buchner J, Valpuesta JM. Structural characterization of the substrate transfer mechanism in Hsp70/Hsp90 folding machinery mediated by Hop. Nat Commun 2014; 5:5484
  305. Paul A, Garcia YA, Zierer B, Patwardhan C, Gutierrez O, Hildenbrand Z, Harris DC, Balsiger HA, Sivils JC, Johnson JL, Buchner J, Chadli A, Cox MB. The cochaperone SGTA (small glutamine-rich tetratricopeptide repeat-containing protein a) demonstrates regulatory specificity for the androgen, glucocorticoid, and progesterone receptors. J Biol Chem 2014; 289:15297-15308
  306. Kang KI, Meng X, Devin-Leclerc J, Bouhouche I, Chadli A, Cadepond F, Baulieu EE, Catelli MG. The molecular chaperone Hsp90 can negatively regulate the activity of a glucocorticosteroid-dependent promoter. Proc Natl Acad Sci U S A 1999; 96:1439-1444
  307. Liu J, DeFranco DB. Chromatin recycling of glucocorticoid receptors: implications for multiple roles of heat shock protein 90. Mol Endocrinol 1999; 13:355-365
  308. Whitesell L, Cook P. Stable and specific binding of heat shock protein 90 by geldanamycin disrupts glucocorticoid receptor function in intact cells. Mol Endocrinol 1996; 10:705-712
  309. Schneikert J, Hubner S, Langer G, Petri T, Jaattela M, Reed J, Cato AC. Hsp70-RAP46 interaction in downregulation of DNA binding by glucocorticoid receptor. EMBO J 2000; 19:6508-6516
  310. Pratt WB, Morishima Y, Murphy M, Harrell M. Chaperoning of glucocorticoid receptors. Handb Exp Pharmacol 2006:111-138
  311. Binder EB. The role of FKBP5, a co-chaperone of the glucocorticoid receptor in the pathogenesis and therapy of affective and anxiety disorders. Psychoneuroendocrinology 2009; 34 Suppl 1:S186-195
  312. Hoeijmakers L, Harbich D, Schmid B, Lucassen PJ, Wagner KV, Schmidt MV, Hartmann J. Depletion of FKBP51 in female mice shapes HPA axis activity. PLoS One 2014; 9:e95796
  313. Stohs SJ, Abbott BD, Lin FH, Birnbaum LS. Induction of ethoxyresorufin-O-deethylase and inhibition of glucocorticoid receptor binding in skin and liver of haired and hairless HRS/J mice by topically applied 2,3,7,8-tetrachlorodibenzo-p-dioxin. Toxicology 1990; 65:123-136
  314. Sunahara GI, Lucier GW, McCoy Z, Bresnick EH, Sanchez ER, Nelson KG. Characterization of 2,3,7,8-tetrachlorodibenzo-p-dioxin-mediated decreases in dexamethasone binding to rat hepatic cytosolic glucocorticoid receptor. Mol Pharmacol 1989; 36:239-247
  315. Brake PB, Zhang L, Jefcoate CR. Aryl hydrocarbon receptor regulation of cytochrome P4501B1 in rat mammary fibroblasts: evidence for transcriptional repression by glucocorticoids. Mol Pharmacol 1998; 54:825-833
  316. Czar MJ, Galigniana MD, Silverstein AM, Pratt WB. Geldanamycin, a heat shock protein 90-binding benzoquinone ansamycin, inhibits steroid-dependent translocation of the glucocorticoid receptor from the cytoplasm to the nucleus. Biochemistry 1997; 36:7776-7785
  317. Makino Y, Okamoto K, Yoshikawa N, Aoshima M, Hirota K, Yodoi J, Umesono K, Makino I, Tanaka H. Thioredoxin: a redox-regulating cellular cofactor for glucocorticoid hormone action. Cross talk between endocrine control of stress response and cellular antioxidant defense system. J Clin Invest 1996; 98:2469-2477
  318. Miura T, Ouchida R, Yoshikawa N, Okamoto K, Makino Y, Nakamura T, Morimoto C, Makino I, Tanaka H. Functional modulation of the glucocorticoid receptor and suppression of NF-kB-dependent transcription by ursodeoxycholic acid. J Biol Chem 2001; 276:47371-47378
  319. Takahashi S, Wakui H, Gustafsson JA, Zilliacus J, Itoh H. Functional interaction of the immunosuppressant mizoribine with the 14-3-3 protein. Biochem Biophys Res Commun 2000; 274:87-92
  320. Mattick JS. The functional genomics of noncoding RNA. Science 2005; 309:1527-1528
  321. Katayama S, Tomaru Y, Kasukawa T, Waki K, Nakanishi M, Nakamura M, Nishida H, Yap CC, Suzuki M, Kawai J, Suzuki H, Carninci P, Hayashizaki Y, Wells C, Frith M, Ravasi T, Pang KC, Hallinan J, Mattick J, Hume DA, Lipovich L, Batalov S, Engstrom PG, Mizuno Y, Faghihi MA, Sandelin A, Chalk AM, Mottagui-Tabar S, Liang Z, Lenhard B, Wahlestedt C. Antisense transcription in the mammalian transcriptome. Science 2005; 309:1564-1566
  322. Zhang R, Zhang L, Yu W. Genome-wide expression of non-coding RNA and global chromatin modification. Acta Biochim Biophys Sin (Shanghai) 2012; 44:40-47
  323. Mercer TR, Wilhelm D, Dinger ME, Solda G, Korbie DJ, Glazov EA, Truong V, Schwenke M, Simons C, Matthaei KI, Saint R, Koopman P, Mattick JS. Expression of distinct RNAs from 3' untranslated regions. Nucleic Acids Res 2011; 39:2393-2403
  324. Mendell JT, Olson EN. MicroRNAs in stress signaling and human disease. Cell 2012; 148:1172-1187
  325. Guay C, Regazzi R. Circulating microRNAs as novel biomarkers for diabetes mellitus. Nat Rev Endocrinol 2013; 9:513-521
  326. Thomou T, Mori MA, Dreyfuss JM, Konishi M, Sakaguchi M, Wolfrum C, Rao TN, Winnay JN, Garcia-Martin R, Grinspoon SK, Gorden P, Kahn CR. Adipose-derived circulating miRNAs regulate gene expression in other tissues. Nature 2017; 542:450-455
  327. Riester A, Issler O, Spyroglou A, Rodrig SH, Chen A, Beuschlein F. ACTH-dependent regulation of microRNA as endogenous modulators of glucocorticoid receptor expression in the adrenal gland. Endocrinology 2012; 153:212-222
  328. Lv M, Zhang X, Jia H, Li D, Zhang B, Zhang H, Hong M, Jiang T, Jiang Q, Lu J, Huang X, Huang B. An oncogenic role of miR-142-3p in human T-cell acute lymphoblastic leukemia (T-ALL) by targeting glucocorticoid receptor-a and cAMP/PKA pathways. Leukemia 2012; 26:769-777
  329. Ledderose C, Mohnle P, Limbeck E, Schutz S, Weis F, Rink J, Briegel J, Kreth S. Corticosteroid resistance in sepsis is influenced by microRNA-124-induced downregulation of glucocorticoid receptor-a. Crit Care Med 2012; 40:2745-2753
  330. Uchida S, Nishida A, Hara K, Kamemoto T, Suetsugi M, Fujimoto M, Watanuki T, Wakabayashi Y, Otsuki K, McEwen BS, Watanabe Y. Characterization of the vulnerability to repeated stress in Fischer 344 rats: possible involvement of microRNA-mediated down-regulation of the glucocorticoid receptor. Eur J Neurosci 2008; 27:2250-2261
  331. Vreugdenhil E, Verissimo CS, Mariman R, Kamphorst JT, Barbosa JS, Zweers T, Champagne DL, Schouten T, Meijer OC, de Kloet ER, Fitzsimons CP. MicroRNA 18 and 124a down-regulate the glucocorticoid receptor: implications for glucocorticoid responsiveness in the brain. Endocrinology 2009; 150:2220-2228
  332. Ko JY, Chuang PC, Ke HJ, Chen YS, Sun YC, Wang FS. MicroRNA-29a mitigates glucocorticoid induction of bone loss and fatty marrow by rescuing Runx2 acetylation. Bone 2015; 81:80-88
  333. Davis TE, Kis-Toth K, Szanto A, Tsokos GC. Glucocorticoids suppress T cell function by up-regulating microRNA-98. Arthritis Rheum 2013; 65:1882-1890
  334. Zheng Y, Xiong S, Jiang P, Liu R, Liu X, Qian J, Zheng X, Chu Y. Glucocorticoids inhibit lipopolysaccharide-mediated inflammatory response by downregulating microRNA-155: a novel anti-inflammation mechanism. Free Radic Biol Med 2012; 52:1307-1317
  335. Smith LK, Tandon A, Shah RR, Mav D, Scoltock AB, Cidlowski JA. Deep sequencing identification of novel glucocorticoid-responsive miRNAs in apoptotic primary lymphocytes. PLoS One 2013; 8:e78316
  336. Palagani A, Op de Beeck K, Naulaerts S, Diddens J, Sekhar Chirumamilla C, Van Camp G, Laukens K, Heyninck K, Gerlo S, Mestdagh P, Vandesompele J, Berghe WV. Ectopic microRNA-150-5p transcription sensitizes glucocorticoid therapy response in MM1S multiple myeloma cells but fails to overcome hormone therapy resistance in MM1R cells. PLoS One 2014; 9:e113842
  337. Shi C, Huang P, Kang H, Hu B, Qi J, Jiang M, Zhou H, Guo L, Deng L. Glucocorticoid inhibits cell proliferation in differentiating osteoblasts by microRNA-199a targeting of WNT signaling. J Mol Endocrinol 2015; 54:325-337
  338. Hatchell EC, Colley SM, Beveridge DJ, Epis MR, Stuart LM, Giles KM, Redfern AD, Miles LE, Barker A, MacDonald LM, Arthur PG, Lui JC, Golding JL, McCulloch RK, Metcalf CB, Wilce JA, Wilce MC, Lanz RB, O'Malley BW, Leedman PJ. SLIRP, a small SRA binding protein, is a nuclear receptor corepressor. Mol Cell 2006; 22:657-668
  339. Redfern AD, Colley SM, Beveridge DJ, Ikeda N, Epis MR, Li X, Foulds CE, Stuart LM, Barker A, Russell VJ, Ramsay K, Kobelke SJ, Li X, Hatchell EC, Payne C, Giles KM, Messineo A, Gatignol A, Lanz RB, O'Malley BW, Leedman PJ. RNA-induced silencing complex (RISC) Proteins PACT, TRBP, and Dicer are SRA binding nuclear receptor coregulators. Proc Natl Acad Sci U S A 2013; 110:6536-6541
  340. Beato M, Vicent GP. A new role for an old player: steroid receptor RNA Activator (SRA) represses hormone inducible genes. Transcription 2013; 4:167-171
  341. Kino T, Marr AK. A lovely leap toward the development of breast cancer therapy with long non-coding RNAs. Transl Cancer Res 2016; 5:S400-404
  342. Kino T, Hurt DE, Ichijo T, Nader N, Chrousos GP. Noncoding RNA gas5 is a growth arrest- and starvation-associated repressor of the glucocorticoid receptor. Sci Signal 2010; 3:ra8
  343. Mayama T, Marr AK, Kino T. Differential expression of glucocorticoid receptor noncoding RNA repressor Gas5 in autoimmune and inflammatory diseases. Horm Metab Res 2016; 48:550-557
  344. Lucafò M, Di Silvestre A, Romano M, Avian A, Antonelli R, Martelossi S, Naviglio S, Tommasini A, Stocco G, Ventura A, Decorti G, De Ludicibus S. Role of the Long Non-Coding RNA Growth Arrest-Specific 5 in Glucocorticoid Response in Children with Inflammatory Bowel Disease. Basic Clin Pharmacol Toxicol. 2018; 122(1):87-93
  345. Gharesouran J, Taheri M, Sayad A, Ghafouri-Fard S, Mazdeh M, Omrani MD. The Growth Arrest-Specific Transcript 5 (GAS5) and Nuclear Receptor Subfamily 3 Group C Member 1 (NR3C1): Novel Markers Involved in Multiple Sclerosis. Int J Mol Cell Med. 2018 Spring; 7(2):102-110
  346. Mahdi Eftekharian M, Noroozi R, Komaki A, Mazdeh M, Taheri M, Ghafouri-Fard S. GAS5 genomic variants and risk of multiple sclerosis. Neurosci Lett. 2019; 701:54-57
  347. Moradi M, Gharesouran J, Ghafouri-Fard S, Noroozi R, Talebian S, Taheri M, Rezazadeh M. Role of NR3C1 and GAS5 genes polymorphisms in multiple sclerosis. Int J Neurosci. 2020; 130(4):407-412
  348. Esguerra JLS, Ofori JK, Nagao M, Shuto Y, Karagiannopoulos A, Fadista J, Sugihara H, Groop L, Eliasson L. Glucocorticoid induces human beta cell dysfunction by involving riborepressor GAS5 LincRNA. Mol Metab. 2020; 32:160-167
  349. Gasic V, Stankovic B, Zukic B, Janic D, Dokmanovic L, Krstovski N, Lazic J, Milosevic G, Lucafò M, Stocco G, Decorti G, Pavlovic S, Kotur N. Expression Pattern of Long Non-coding RNA Growth Arrest-specific 5 in the Remission Induction Therapy in Childhood Acute Lymphoblastic Leukemia. J Med Biochem. 2019; 38(3):292-298
  350. Ketab FNG, Gharesouran J, Ghafouri-Fard S, Dastar S, Mazraeh SA, Hosseinzadeh H, Moradi M, Javadlar M, Hiradfar A, Rezamand A, Taheri M, Rezazadeh M. Dual biomarkers long non-coding RNA GAS5 and its target, NR3C1, contribute to acute myeloid leukemia. Exp Mol Pathol. 2020; 114:104399
  351. Yang L, Lin C, Jin C, Yang JC, Tanasa B, Li W, Merkurjev D, Ohgi KA, Meng D, Zhang J, Evans CP, Rosenfeld MG. lncRNA-dependent mechanisms of androgen-receptor-regulated gene activation programs. Nature 2013; 500:598-602
  352. Kino T, Su YA, Chrousos GP. Human glucocorticoid receptor isoform b: recent understanding of its potential implications in physiology and pathophysiology. Cell Mol Life Sci 2009; 66:3435-3448
  353. Schaaf MJ, Champagne D, van Laanen IH, van Wijk DC, Meijer AH, Meijer OC, Spaink HP, Richardson MK. Discovery of a functional glucocorticoid receptor b-isoform in zebrafish. Endocrinology 2008; 149:1591-1599
  354. Otto C, Reichardt HM, Schutz G. Absence of glucocorticoid receptor-b in mice. J Biol Chem 1997; 272:26665-26668
  355. DuBois DC, Sukumaran S, Jusko WJ, Almon RR. Evidence for a glucocorticoid receptor b splice variant in the rat and its physiological regulation in liver. Steroids 2013; 78:312-320
  356. Kino T, Chrousos GP. Glucocorticoid and mineralocorticoid receptors and associated diseases. Essays Biochem 2004; 40:137-155
  357. Charmandari E, Chrousos GP, Ichijo T, Bhattacharyya N, Vottero A, Souvatzoglou E, Kino T. The human glucocorticoid receptor (hGR) b isoform suppresses the transcriptional activity of hGRa by interfering with formation of active coactivator complexes. Mol Endocrinol 2005; 19:52-64
  358. Oakley RH, Jewell CM, Yudt MR, Bofetiado DM, Cidlowski JA. The dominant negative activity of the human glucocorticoid receptor b isoform. Specificity and mechanisms of action. J Biol Chem 1999; 274:27857-27866
  359. Li LB, Leung DY, Hall CF, Goleva E. Divergent expression and function of glucocorticoid receptor b in human monocytes and T cells. J Leukoc Biol 2006; 79:818-827
  360. Zhang X, Clark AF, Yorio T. Regulation of glucocorticoid responsiveness in glaucomatous trabecular meshwork cells by glucocorticoid receptor-b. Invest Ophthalmol Vis Sci 2005; 46:4607-4616
  361. Kino T, Manoli I, Kelkar S, Wang Y, Su YA, Chrousos GP. Glucocorticoid receptor (GR) b has intrinsic, GRa-independent transcriptional activity. Biochem Biophys Res Commun 2009; 381:671-675
  362. Lewis-Tuffin LJ, Jewell CM, Bienstock RJ, Collins JB, Cidlowski JA. Human glucocorticoid receptor b binds RU-486 and is transcriptionally active. Mol Cell Biol 2007; 27:2266-2282
  363. de Castro M, Elliot S, Kino T, Bamberger C, Karl M, Webster E, Chrousos GP. The non-ligand binding b-isoform of the human glucocorticoid receptor (hGRb): tissue levels, mechanism of action, and potential physiologic role. Mol Med 1996; 2:597-607
  364. Oakley RH, Sar M, Cidlowski JA. The human glucocorticoid receptor b isoform. Expression, biochemical properties, and putative function. J Biol Chem 1996; 271:9550-9559
  365. Hinds TD, Jr., Ramakrishnan S, Cash HA, Stechschulte LA, Heinrich G, Najjar SM, Sanchez ER. Discovery of glucocorticoid receptor-b in mice with a role in metabolism. Mol Endocrinol 2010; 24:1715-1727
  366. van der Vaart M, Schaaf MJ. Naturally occurring C-terminal splice variants of nuclear receptors. Nucl Recept Signal 2009; 7:e007
  367. Ogawa S, Inoue S, Watanabe T, Orimo A, Hosoi T, Ouchi Y, Muramatsu M. Molecular cloning and characterization of human estrogen receptor bcx: a potential inhibitor of estrogen action in human. Nucleic Acids Res 1998; 26:3505-3512
  368. Benbrook D, Pfahl M. A novel thyroid hormone receptor encoded by a cDNA clone from a human testis library. Science 1987; 238:788-791
  369. Ebihara K, Masuhiro Y, Kitamoto T, Suzawa M, Uematsu Y, Yoshizawa T, Ono T, Harada H, Matsuda K, Hasegawa T, Masushige S, Kato S. Intron retention generates a novel isoform of the murine vitamin D receptor that acts in a dominant negative way on the vitamin D signaling pathway. Mol Cell Biol 1996; 16:3393-3400
  370. Arnold KA, Eichelbaum M, Burk O. Alternative splicing affects the function and tissue-specific expression of the human constitutive androstane receptor. Nucl Recept 2004; 2:1
  371. Hossain A, Li C, Saunders GF. Generation of two distinct functional isoforms of dosage-sensitive sex reversal-adrenal hypoplasia congenita-critical region on the X chromosome gene 1 (DAX-1) by alternative splicing. Mol Endocrinol 2004; 18:1428-1437
  372. Ohkura N, Hosono T, Maruyama K, Tsukada T, Yamaguchi K. An isoform of Nurr1 functions as a negative inhibitor of the NGFI-B family signaling. Biochim Biophys Acta 1999; 1444:69-79
  373. Petropoulos I, Part D, Ochoa A, Zakin MM, Lamas E. NOR-2 (neuron-derived orphan receptor), a brain zinc finger protein, is highly induced during liver regeneration. FEBS Lett 1995; 372:273-278
  374. Gervois P, Torra IP, Chinetti G, Grotzinger T, Dubois G, Fruchart JC, Fruchart-Najib J, Leitersdorf E, Staels B. A truncated human peroxisome proliferator-activated receptor a splice variant with dominant negative activity. Mol Endocrinol 1999; 13:1535-1549
  375. Sabatino L, Casamassimi A, Peluso G, Barone MV, Capaccio D, Migliore C, Bonelli P, Pedicini A, Febbraro A, Ciccodicola A, Colantuoni V. A novel peroxisome proliferator-activated receptor g isoform with dominant negative activity generated by alternative splicing. J Biol Chem 2005; 280:26517-26525
  376. He B, Cruz-Topete D, Oakley RH, Xiao X, Cidlowski JA. Human glucocorticoid receptor b regulates gluconeogenesis and inflammation in mouse liver. Mol Cell Biol 2015; 36:714-730
  377. McBeth L, Nwaneri AC, Grabnar M, Demeter J, Nestor-Kalinoski A, Hinds TD, Jr. Glucocorticoid receptor b increases migration of human bladder cancer cells. Oncotarget 2016; 7:27313-27324
  378. Hinds TD, Peck B, Shek E, Stroup S, Hinson J, Arthur S, Marino JS. Overexpression of glucocorticoid receptor b enhances myogenesis and reduces catabolic gene expression. Int J Mol Sci 2016; 17:232
  379. Stechschulte LA, Wuescher L, Marino JS, Hill JW, Eng C, Hinds TD, Jr. Glucocorticoid receptor b stimulates Akt1 growth pathway by attenuation of PTEN. J Biol Chem 2014; 289:17885-17894
  380. Wang Q, Lu PH, Shi ZF, Xu YJ, Xiang J, Wang YX, Deng LX, Xie P, Yin Y, Zhang B, Mu HJ, Qiao WZ, Cui H, Zou J. Glucocorticoid receptor b acts as a co-activator of T-cell factor 4 and enhances glioma cell proliferation. Mol Neurobiol 2015; 52:1106-1118
  381. Goleva E, Li LB, Eves PT, Strand MJ, Martin RJ, Leung DY. Increased glucocorticoid receptor b alters steroid response in glucocorticoid-insensitive asthma. Am J Respir Crit Care Med 2006; 173:607-616
  382. Derijk RH, Schaaf MJ, Turner G, Datson NA, Vreugdenhil E, Cidlowski J, de Kloet ER, Emery P, Sternberg EM, Detera-Wadleigh SD. A human glucocorticoid receptor gene variant that increases the stability of the glucocorticoid receptor b-isoform mRNA is associated with rheumatoid arthritis. J Rheumatol 2001; 28:2383-2388
  383. Lee CK, Lee EY, Cho YS, Moon KA, Yoo B, Moon HB. Increased expression of glucocorticoid receptor b messenger RNA in patients with ankylosing spondylitis. Korean J Intern Med 2005; 20:146-151
  384. Longui CA, Vottero A, Adamson PC, Cole DE, Kino T, Monte O, Chrousos GP. Low glucocorticoid receptor a/b ratio in T-cell lymphoblastic leukemia. Horm Metab Res 2000; 32:401-406
  385. Pujols L, Mullol J, Benitez P, Torrego A, Xaubet A, de Haro J, Picado C. Expression of the glucocorticoid receptor a and b isoforms in human nasal mucosa and polyp epithelial cells. Respir Med 2003; 97:90-96
  386. Shahidi H, Vottero A, Stratakis CA, Taymans SE, Karl M, Longui CA, Chrousos GP, Daughaday WH, Gregory SA, Plate JM. Imbalanced expression of the glucocorticoid receptor isoforms in cultured lymphocytes from a patient with systemic glucocorticoid resistance and chronic lymphocytic leukemia. Biochem Biophys Res Commun 1999; 254:559-565
  387. Piotrowski P, Burzynski M, Lianeri M, Mostowska M, Wudarski M, Chwalinska-Sadowska H, Jagodzinski PP. Glucocorticoid receptor b splice variant expression in patients with high and low activity of systemic lupus erythematosus. Folia Histochem Cytobiol 2007; 45:339-342
  388. Diaz PV, Pinto RA, Mamani R, Uasapud PA, Bono MR, Gaggero AA, Guerrero J, Goecke A. Increased expression of the glucocorticoid receptor b in infants with RSV bronchiolitis. Pediatrics 2012; 130:e804-811
  389. Leung DY, Hamid Q, Vottero A, Szefler SJ, Surs W, Minshall E, Chrousos GP, Klemm DJ. Association of glucocorticoid insensitivity with increased expression of glucocorticoid receptor b. J Exp Med 1997; 186:1567-1574
  390. Webster JC, Oakley RH, Jewell CM, Cidlowski JA. Proinflammatory cytokines regulate human glucocorticoid receptor gene expression and lead to the accumulation of the dominant negative b isoform: a mechanism for the generation of glucocorticoid resistance. Proc Natl Acad Sci U S A 2001; 98:6865-6870
  391. Xu Q, Leung DY, Kisich KO. Serine-arginine-rich protein p30 directs alternative splicing of glucocorticoid receptor pre-mRNA to glucocorticoid receptor b in neutrophils. J Biol Chem 2003; 278:27112-27118
  392. Strickland I, Kisich K, Hauk PJ, Vottero A, Chrousos GP, Klemm DJ, Leung DY. High constitutive glucocorticoid receptor b in human neutrophils enables them to reduce their spontaneous rate of cell death in response to corticosteroids. J Exp Med 2001; 193:585-593
  393. Orii F, Ashida T, Nomura M, Maemoto A, Fujiki T, Ayabe T, Imai S, Saitoh Y, Kohgo Y. Quantitative analysis for human glucocorticoid receptor a/b mRNA in IBD. Biochem Biophys Res Commun 2002; 296:1286-1294
  394. Tliba O, Damera G, Banerjee A, Gu S, Baidouri H, Keslacy S, Amrani Y. Cytokines induce an early steroid resistance in airway smooth muscle cells: novel role of interferon regulatory factor-1. Am J Respir Cell Mol Biol 2008; 38:463-472
  395. Chung CC, Shimmin L, Natarajan S, Hanis CL, Boerwinkle E, Hixson JE. Glucocorticoid receptor gene variant in the 3' untranslated region is associated with multiple measures of blood pressure. J Clin Endocrinol Metab 2009; 94:268-276
  396. van den Akker EL, Koper JW, van Rossum EF, Dekker MJ, Russcher H, de Jong FH, Uitterlinden AG, Hofman A, Pols HA, Witteman JC, Lamberts SW. Glucocorticoid receptor gene and risk of cardiovascular disease. Arch Intern Med 2008; 168:33-39
  397. van den Akker EL, Nouwen JL, Melles DC, van Rossum EF, Koper JW, Uitterlinden AG, Hofman A, Verbrugh HA, Pols HA, Lamberts SW, van Belkum A. Staphylococcus aureus nasal carriage is associated with glucocorticoid receptor gene polymorphisms. J Infect Dis 2006; 194:814-818
  398. Charmandari E, Kino T. Chrousos syndrome: a seminal report, a phylogenetic enigma and the clinical implications of glucocorticoid signalling changes. Eur J Clin Invest 2010; 40:932-942
  399. Charmandari E, Kino T, Ichijo T, Chrousos GP. Generalized glucocorticoid resistance: clinical aspects, molecular mechanisms, and implications of a rare genetic disorder. J Clin Endocrinol Metab 2008; 93:1563-1572
  400. Nicolaides N, Lamprokostopoulou A, Sertedaki A, Charmandari E. Recent advances in the molecular mechanisms causing primary generalized glucocorticoid resistance. Hormones (Athens). 2016; 15(1):23-34
  401. Nicolaides NC, Charmandari E. Novel insights into the molecular mechanisms underlying generalized glucocorticoid resistance and hypersensitivity syndromes. Hormones (Athens). 2017; 16(2):124-138
  402. Nicolaides NC, Charmandari E. Glucocorticoid Resistance. Exp Suppl. 2019; 111:85-102
  403. Chrousos GP, Vingerhoeds A, Brandon D, Eil C, Pugeat M, DeVroede M, Loriaux DL, Lipsett MB. Primary cortisol resistance in man. A glucocorticoid receptor-mediated disease. J Clin Invest 1982; 69:1261-1269
  404. Nicolaides NC, Charmandari E. Chrousos syndrome: from molecular pathogenesis to therapeutic management. Eur J Clin Invest. 2015; 45(5):504-14
  405. Vingerhoeds ACM, Thijssen JHH, Schwarts F. Spontaneous hypercortisolism without Cushing's syndrome. J Clin Endocrinol Metab 1976; 43:1128-1133
  406. Lamberts SW, Poldermans D, Zweens M, de Jong FH. Familial cortisol resistance: differential diagnostic and therapeutic aspects. J Clin Endocrinol Metab 1986; 63:1328-1333
  407. Nawata H, Sekiya K, Higuchi K, Kato K, Ibayashi H. Decreased deoxyribonucleic acid binding of glucocorticoid-receptor complex in cultured skin fibroblasts from a patient with the glucocorticoid resistance syndrome. J Clin Endocrinol Metab 1987; 65:219-226
  408. Iida S, Gomi M, Moriwaki K, Itoh Y, Hirobe K, Matsuzawa Y, Katagiri S, Yonezawa T, Tarui S. Primary cortisol resistance accompanied by a reduction in glucocorticoid receptors in two members of the same family. J Clin Endocrinol Metab 1985; 60:967-971
  409. Vecsei P, Frank K, Haack D, Heinze V, Ho AD, Honour JW, Lewicka S, Schoosch M, Ziegler R. Primary glucocorticoid receptor defect with likely familial involvement. Cancer Res 1989; 49:2220s-2221s
  410. Lamberts SW, Koper JW, Biemond P, den Holder FH, de Jong FH. Cortisol receptor resistance: the variability of its clinical presentation and response to treatment. J Clin Endocrinol Metab 1992; 74:313-321
  411. Hurley DM, Accili D, Stratakis CA, Karl M, Vamvakopoulos N, Rorer E, Constantine K, Taylor SI, Chrousos GP. Point mutation causing a single amino acid substitution in the hormone binding domain of the glucocorticoid receptor in familial glucocorticoid resistance. J Clin Invest 1991; 87:680-686
  412. Karl M, Lamberts SW, Detera-Wadleigh SD, Encio IJ, Stratakis CA, Hurley DM, Accili D, Chrousos GP. Familial glucocorticoid resistance caused by a splice site deletion in the human glucocorticoid receptor gene. J Clin Endocrinol Metab 1993; 76:683-689
  413. Karl M, Lamberts SW, Koper JW, Katz DA, Huizenga NE, Kino T, Haddad BR, Hughes MR, Chrousos GP. Cushing's disease preceded by generalized glucocorticoid resistance: clinical consequences of a novel, dominant-negative glucocorticoid receptor mutation. Proc Assoc Am Physicians 1996; 108:296-307
  414. Malchoff DM, Brufsky A, Reardon G, McDermott P, Javier EC, Bergh CH, Rowe D, Malchoff CD. A mutation of the glucocorticoid receptor in primary cortisol resistance. J Clin Invest 1993; 91:1918-1925
  415. Michailidou Z, Carter RN, Marshall E, Sutherland HG, Brownstein DG, Owen E, Cockett K, Kelly V, Ramage L, Al-Dujaili EA, Ross M, Maraki I, Newton K, Holmes MC, Seckl JR, Morton NM, Kenyon CJ, Chapman KE. Glucocorticoid receptor haploinsufficiency causes hypertension and attenuates hypothalamic-pituitary-adrenal axis and blood pressure adaptions to high-fat diet. FASEB J 2008; 22:3896-3907
  416. Kino T, Stauber RH, Resau JH, Pavlakis GN, Chrousos GP. Pathologic human GR mutant has a transdominant negative effect on the wild-type GR by inhibiting its translocation into the nucleus: Importance of the ligand-binding domain for intracellular GR trafficking. J Clin Endocrinol Metab 2001; 86:5600-5608
  417. Mendonca BB, Leite MV, de Castro M, Kino T, Elias LL, Bachega TA, Arnhold IJ, Chrousos GP, Latronico AC. Female pseudohermaphroditism caused by a novel homozygous missense mutation of the GR gene. J Clin Endocrinol Metab 2002; 87:1805-1809
  418. Ruiz M, Lind U, Gafvels M, Eggertsen G, Carlstedt-Duke J, Nilsson L, Holtmann M, Stierna P, Wikstrom AC, Werner S. Characterization of two novel mutations in the glucocorticoid receptor gene in patients with primary cortisol resistance. Clin Endocrinol (Oxf) 2001; 55:363-371
  419. Charmandari E, Kino T, Ichijo T, Zachman K, Alatsatianos A, Chrousos GP. Functional characterization of the natural human glucocorticoid receptor (hGR) mutants hGRaR477H and hGRaG679S associated with generalized glucocorticoid resistance. J Clin Endocrinol Metab 2006; 91:1535-1543
  420. Vottero A, Kino T, Combe H, Lecomte P, Chrousos GP. A novel, C-terminal dominant negative mutation of the GR causes familial glucocorticoid resistance through abnormal interactions with p160 steroid receptor coactivators. J Clin Endocrinol Metab 2002; 87:2658-2667
  421. Charmandari E, Raji A, Kino T, Ichijo T, Tiulpakov A, Zachman K, Chrousos GP. A novel point mutation in the ligand-binding domain (LBD) of the human glucocorticoid receptor (hGR) causing generalized glucocorticoid resistance: the importance of the C terminus of hGR LBD in conferring transactivational activity. J Clin Endocrinol Metab 2005; 90:3696-3705
  422. Nader N, Bachrach BE, Hurt DE, Gajula S, Pittman A, Lescher R, Kino T. A novel point mutation in helix 10 of the human glucocorticoid receptor causes generalized glucocorticoid resistance by disrupting the structure of the ligand-binding domain. J Clin Endocrinol Metab 2010; 95:2281-2285
  423. Zhu HJ, Dai YF, Wang O, Li M, Lu L, Zhao WG, Xing XP, Pan H, Li NS, Gong FY. Generalized glucocorticoid resistance accompanied with an adrenocortical adenoma and caused by a novel point mutation of human glucocorticoid receptor gene. Chin Med J (Engl) 2011; 124:551-555
  424. Nicolaides NC, Skyrla E, Vlachakis D, Psarra AM, Moutsatsou P, Sertedaki A, Kossida S, Charmandari E. Functional characterization of the hGRaT556I causing Chrousos syndrome. Eur J Clin Invest 2016; 46:42-49
  425. Nicolaides NC, Geer EB, Vlachakis D, Roberts ML, Psarra AM, Moutsatsou P, Sertedaki A, Kossida S, Charmandari E. A novel mutation of the hGR gene causing Chrousos syndrome. Eur J Clin Invest 2015; 45:782-791
  426. McMahon SK, Pretorius CJ, Ungerer JP, Salmon NJ, Conwell LS, Pearen MA, Batch JA. Neonatal complete generalized glucocorticoid resistance and growth hormone deficiency caused by a novel homozygous mutation in helix 12 of the ligand binding domain of the glucocorticoid receptor gene (NR3C1). J Clin Endocrinol Metab 2010; 95:297-302
  427. Charmandari E, Kino T, Souvatzoglou E, Vottero A, Bhattacharyya N, Chrousos GP. Natural glucocorticoid receptor mutants causing generalized glucocorticoid resistance: molecular genotype, genetic transmission, and clinical phenotype. J Clin Endocrinol Metab 2004; 89:1939-1949
  428. Roberts ML, Kino T, Nicolaides NC, Hurt DE, Katsantoni E, Sertedaki A, Komianou F, Kassiou K, Chrousos GP, Charmandari E. A novel point mutation in the DNA-binding domain (DBD) of the human glucocorticoid receptor causes primary generalized glucocorticoid resistance by disrupting the hydrophobic structure of its DBD. J Clin Endocrinol Metab 2013; 98:E790-795
  429. Bouligand J, Delemer B, Hecart AC, Meduri G, Viengchareun S, Amazit L, Trabado S, Feve B, Guiochon-Mantel A, Young J, Lombes M. Familial glucocorticoid receptor haploinsufficiency by non-sense mediated mRNA decay, adrenal hyperplasia and apparent mineralocorticoid excess. PLoS One 2010; 5:e13563
  430. Charmandari E, Ichijo T, Jubiz W, Baid S, Zachman K, Chrousos GP, Kino T. A novel point mutation in the amino terminal domain of the human glucocorticoid receptor (hGR) gene enhancing hGR-mediated gene expression. J Clin Endocrinol Metab 2008; 93:4963-4968
  431. Charmandari E, Kino T, Ichijo T, Jubiz W, Mejia L, Zachman K, Chrousos GP. A novel point mutation in helix 11 of the ligand-binding domain of the human glucocorticoid receptor gene causing generalized glucocorticoid resistance. J Clin Endocrinol Metab 2007; 92:3986-3990
  432. Lin L, Wu X, Hou Y, Zheng F, Xu R. A novel mutation in the glucocorticoid receptor gene causing resistant hypertension: a case report. Am J Hypertens. 2019; 32:1126-1128
  433. Paragliola RM, Costella A, Corsello A, Urbani A, Concolino P. A Novel Pathogenic Variant in the N-Terminal Domain of the Glucocorticoid Receptor, Causing Glucocorticoid Resistance. Mol Diagn Ther. 2020; 24(4):473-485
  434. Tatsi C, Xekouki P, Nioti O, Bachrach B, Belyavskaya E, Lyssikatos C, Stratakis CA. A novel mutation in the glucocorticoid receptor gene as a cause of severe glucocorticoid resistance complicated by hypertensive encephalopathy. J Hypertens. 2019; 37:1475-1481
  435. Al Argan R, Saskin A, Yang JW, D’Agostino MD, Rivera J. Glucocorticoid resistance syndrome caused by a novel NR3C1 point mutation. Endocr J. 2018; 65:1139-1146
  436. Vitellius G, Fagart J, Delemer B, Amazit L, Ramos N, Bouligand J, Le Billan F, Castinetti F, Guiochon-Mantel A, Trabado S, Lombès M. Three novel heterozygous point mutations of NR3C1 causing glucocorticoid resistance. Hum Mutat. 2016; 37:794-803
  437. Velayos T, Grau G, Rica I, Pérez-Nanclares G, Gaztambide S. Glucocorticoid resistance syndrome caused by two novel mutations in the NR3C1 gene. Endocrinol Nutr. 2016; 63:369-371
  438. Vitellius G, Trabado S, Hoeffel C, Bouligand J, Bennet A, Castinetti F, Decoudier B, Guiochon-Mantel A, Lombes M, Delemer B; investigators of the MUTA-GR Study. Significant prevalence of NR3C1 mutations in incidentally discovered bilateral adrenal hyperplasia: results of the French MUTA-GR Study. Eur J Endocrinol. 2018;178:411-423
  439. Ma L, Tan X, Li J, Long Y, Xiao Z, De J, Ren Y, Tian H, Md TC. A novel glucocorticoid receptor mutation in primary generalized glucocorticoid resistance disease. Endocr Pract. 2020; 11. doi: 10.4158/EP-2019–0475. Online ahead of print
  440. Cannavò S, Benvenga S, Messina E, Moleti M, Ferraù F. Comment to ’Glucocorticoid resistance syndrome caused by a novel NR3C1 point mutation’ by Al Argan et al. Endocr J. 2019;66:657
  441. Trebble P, Matthews L, Blaikley J, Wayte AW, Black GC, Wilton A, Ray DW. Familial glucocorticoid resistance caused by a novel frameshift glucocorticoid receptor mutation. J Clin Endocrinol Metab. 2010; 95:E490-E499
  442. Vitellius G, Delemer B, Caron P, Chabre O, Bouligand J, Pussard E, Trabado S, Lombes M. Impaired 11β-hydroxysteroid dehydrogenase type 2 in glucocorticoid-resistant patients. J Clin Endocrinol Metab. 2019; 104:5205-5216
  443. Molnár Á, Patócs A, Likó I, Nyírő G, Rácz K, Tóth M, Sármán B. An unexpected, mild phenotype of glucocorticoid resistance associated with glucocorticoid receptor gene mutation case report and review of the literature. BMC Med Genet. 2018; 19:37
  444. Donner KM, Hiltunen TP, Jänne OA, Sane T, Kontula K. Generalized glucocorticoid resistance caused by a novel two-nucleotide deletion in the hormone-binding domain of the glucocorticoid receptor gene NR3C1. Eur J Endocrinol. 2012; 168:K9-K18
  445. Murani E, Reyer H, Ponsuksili S, Fritschka S, Wimmers K. A substitution in the ligand binding domain of the porcine glucocorticoid receptor affects activity of the adrenal gland. PLoS One 2012; 7:e45518
  446. Kino T. Single Nucleotide Variations of the Human GR Gene Manifested as Pathologic Mutations or Polymorphisms. Endocrinology. 2018; 159(7):2506-2519
  447. Rosmond R, Bouchard C, Bjorntorp P. Tsp509I polymorphism in exon 2 of the glucocorticoid receptor gene in relation to obesity and cortisol secretion: cohort study. BMJ 2001; 322:652-653
  448. Huizenga NA, Koper JW, De Lange P, Pols HA, Stolk RP, Burger H, Grobbee DE, Brinkmann AO, De Jong FH, Lamberts SW. A polymorphism in the glucocorticoid receptor gene may be associated with and increased sensitivity to glucocorticoids in vivo. J Clin Endocrinol Metab 1998; 83:144-151
  449. Dobson MG, Redfern CP, Unwin N, Weaver JU. The N363S polymorphism of the glucocorticoid receptor: potential contribution to central obesity in men and lack of association with other risk factors for coronary heart disease and diabetes mellitus. J Clin Endocrinol Metab 2001; 86:2270-2274
  450. Russcher H, van Rossum EF, de Jong FH, Brinkmann AO, Lamberts SW, Koper JW. Increased expression of the glucocorticoid receptor-A translational isoform as a result of the ER22/23EK polymorphism. Mol Endocrinol 2005; 19:1687-1696
  451. van Rossum EF, Voorhoeve PG, te Velde SJ, Koper JW, Delemarre-van de Waal HA, Kemper HC, Lamberts SW. The ER22/23EK polymorphism in the glucocorticoid receptor gene is associated with a beneficial body composition and muscle strength in young adults. J Clin Endocrinol Metab 2004; 89:4004-4009
  452. van Rossum EF, Koper JW, Huizenga NA, Uitterlinden AG, Janssen JA, Brinkmann AO, Grobbee DE, de Jong FH, van Duyn CM, Pols HA, Lamberts SW. A polymorphism in the glucocorticoid receptor gene, which decreases sensitivity to glucocorticoids in vivo, is associated with low insulin and cholesterol levels. Diabetes 2002; 51:3128-3134
  453. van der Voorn B, Wit JM, van der Pal SM, Rotteveel J, Finken MJ. Antenatal glucocorticoid treatment and polymorphisms of the glucocorticoid and mineralocorticoid receptors are associated with IQ and behavior in young adults born very preterm. J Clin Endocrinol Metab 2015; 100:500-507
  454. van Rossum EF, Koper JW, van den Beld AW, Uitterlinden AG, Arp P, Ester W, Janssen JA, Brinkmann AO, de Jong FH, Grobbee DE, Pols HA, Lamberts SW. Identification of the BclI polymorphism in the glucocorticoid receptor gene: association with sensitivity to glucocorticoids in vivo and body mass index. Clin Endocrinol (Oxf) 2003; 59:585-592
  455. Manenschijn L, van den Akker EL, Lamberts SW, van Rossum EF. Clinical features associated with glucocorticoid receptor polymorphisms. An overview. Ann N Y Acad Sci 2009; 1179:179-198
  456. van Moorsel D, van Greevenbroek MM, Schaper NC, Henry RM, Geelen CC, van Rossum EF, Nijpels G, t Hart LM, Schalkwijk CG, van der Kallen CJ, Sauerwein HP, Dekker JM, Stehouwer CD, Havekes B. BclI glucocorticoid receptor polymorphism in relation to cardiovascular variables: the Hoorn and CODAM studies. Eur J Endocrinol 2015; 173:455-464
  457. Koetz KR, van Rossum EF, Ventz M, Diederich S, Quinkler M. BclI polymorphism of the glucocorticoid receptor gene is associated with increased bone resorption in patients on glucocorticoid replacement therapy. Clin Endocrinol (Oxf) 2013; 78:831-837
  458. Bouma EM, Riese H, Nolte IM, Oosterom E, Verhulst FC, Ormel J, Oldehinkel AJ. No associations between single nucleotide polymorphisms in corticoid receptor genes and heart rate and cortisol responses to a standardized social stress test in adolescents: the TRAILS study. Behav Genet 2011; 41:253-261
  459. Lian Y, Xiao J, Wang Q, Ning L, Guan S, Ge H, Li F, Liu J. The relationship between glucocorticoid receptor polymorphisms, stressful life events, social support, and post-traumatic stress disorder. BMC Psychiatry 2014; 14:232
  460. Maciel GA, Moreira RP, Bugano DD, Hayashida SA, Marcondes JA, Gomes LG, Mendonca BB, Bachega TA, Baracat EC. Association of glucocorticoid receptor polymorphisms with clinical and metabolic profiles in polycystic ovary syndrome. Clinics (Sao Paulo) 2014; 69:179-184
  461. Syed AA, Irving JA, Redfern CP, Hall AG, Unwin NC, White M, Bhopal RS, Weaver JU. Association of glucocorticoid receptor polymorphism A3669G in exon 9b with reduced central adiposity in women. Obesity (Silver Spring) 2006; 14:759-764
  462. Simpson DM, Bender AN. Human immunodeficiency virus-associated myopathy: analysis of 11 patients. Ann Neurol 1988; 24:79-84
  463. Kotler DP, Rosenbaum K, Wang J, Pierson RN. Studies of body composition and fat distribution in HIV-infected and control subjects. J Acquir Immune Defic Syndr Hum Retrovirol 1999; 20:228-237
  464. Yanovski JA, Miller KD, Kino T, Friedman TC, Chrousos GP, Tsigos C, Falloon J. Endocrine and metabolic evaluation of human immunodeficiency virus-infected patients with evidence of protease inhibitor-associated lipodystrophy. J Clin Endocrinol Metab 1999; 84:1925-1931
  465. Hadigan C, Miller K, Corcoran C, Anderson E, Basgoz N, Grinspoon S. Fasting hyperinsulinemia and changes in regional body composition in human immunodeficiency virus-infected women. J Clin Endocrinol Metab 1999; 84:1932-1937
  466. Dube MP. Disorders of Glucose Metabolism in Patients Infected with Human Immunodeficiency Virus. Clin Infect Dis 2000; 31:1467-1475
  467. Pavlakis GN. The molecular biology of HIV-1. In: DeVita VT, Hellman S, Rosenberg SA, eds. AIDS: Diagnosis, Treatment and Prevention. 4 ed. Philadelphia: Lippincott Raven; 1996:45-74.
  468. Emerman M. HIV-1, Vpr and the cell cycle. Curr Biol 1996; 6:1096-1103
  469. Kino T, Gragerov A, Kopp JB, Stauber RH, Pavlakis GN, Chrousos GP. The HIV-1 virion-associated protein vpr is a coactivator of the human glucocorticoid receptor. J Exp Med 1999; 189:51-62
  470. Kino T, Gragerov A, Slobodskaya O, Tsopanomichalou M, Chrousos GP, Pavlakis GN. Human immunodeficiency virus type-1 (HIV-1) accessory protein Vpr induces transcription of the HIV-1 and glucocorticoid-responsive promoters by binding directly to p300/CBP coactivators. J Virol 2002; 76:9724-9734
  471. Levy DN, Refaeli Y, MacGregor RR, Weiner DB. Serum Vpr regulates productive infection and latency of human immunodeficiency virus type 1. Proc Natl Acad Sci U S A 1994; 91:10873-10877
  472. Henklein P, Bruns K, Sherman MP, Tessmer U, Licha K, Kopp J, de Noronha CM, Greene WC, Wray V, Schubert U. Functional and structural characterization of synthetic HIV-1 vpr that transduces cells, localizes to the nucleus, and induces G2 cell cycle arrest. J Biol Chem 2000; 275:32016-32026
  473. Mirani M, Elenkov I, Volpi S, Hiroi N, Chrousos GP, Kino T. HIV-1 protein Vpr suppresses IL-12 production from human monocytes by enhancing glucocorticoid action: potential implications of Vpr coactivator activity for the innate and cellular immunity deficits observed in HIV-1 infection. J Immunol 2002; 169:6361-6368
  474. Shrivastav S, Kino T, Cunningham T, Ichijo T, Schubert U, Heinklein P, Chrousos GP, Kopp JB. Human immunodeficiency virus (HIV)-1 viral protein R suppresses transcriptional activity of peroxisome proliferator-activated receptor g and inhibits adipocyte differentiation: implications for HIV-associated lipodystrophy. Mol Endocrinol 2008; 22:234-247
  475. Shrivastav S, Zhang L, Okamoto K, Lee H, Lagranha C, Abe Y, Balasubramanyam A, Lopaschuk GD, Kino T, Kopp JB. HIV-1 Vpr enhances PPARb/d-mediated transcription, increases PDK4 expression, and reduces PDC activity. Mol Endocrinol 2013; 27:1564-1576
  476. Balasubramanyam A, Mersmann H, Jahoor F, Phillips TM, Sekhar RV, Schubert U, Brar B, Iyer D, Smith EO, Takahashi H, Lu H, Anderson P, Kino T, Henklein P, Kopp JB. Effects of transgenic expression of HIV-1 Vpr on lipid and energy metabolism in mice. Am J Physiol Endocrinol Metab 2007; 292:E40-48
  477. Agarwal N, Iyer D, Patel SG, Sekhar RV, Phillips TM, Schubert U, Oplt T, Buras ED, Samson SL, Couturier J, Lewis DE, Rodriguez-Barradas MC, Jahoor F, Kino T, Kopp JB, Balasubramanyam A. HIV-1 Vpr induces adipose dysfunction in vivo through reciprocal effects on PPAR/GR co-regulation. Sci Transl Med 2013; 5:ra164
  478. Kino T, Chrousos GP. Virus-mediated modulation of the host endocrine signaling systems: Clinical implications. Trends Endocrinol Metab 2007; 18:159-166
  479. Jeang KT, Xiao H, Rich EA. Multifaceted activities of the HIV-1 transactivator of transcription, Tat. J Biol Chem 1999; 274:28837-28840
  480. Kino T, Chrousos GP. Glucocorticoid and mineralocorticoid resistance/hypersensitivity syndromes. J Endocrinol 2001; 169:437-445
  481. Kino T, Slobodskaya O, Pavlakis GN, Chrousos GP. Nuclear receptor coactivator p160 proteins enhance the HIV-1 long terminal repeat promoter by bridging promoter-bound factors and the Tat-P-TEFb complex. J Biol Chem 2002; 277:2396-2405
  482. Price DH. P-TEFb, a cyclin-dependent kinase controlling elongation by RNA polymerase II. Mol Cell Biol 2000; 20:2629-2634
  483. Fawell S, Seery J, Daikh Y, Moore C, Chen LL, Pepinsky B, Barsoum J. Tat-mediated delivery of heterologous proteins into cells. Proc Natl Acad Sci U S A 1994; 91:664-668
  484. Kino T, Mirani M, Alesci S, Chrousos GP. AIDS-related lipodystrophy/insulin resistance syndrome. Horm Metab Res 2003; 35:129-136
  485. Liu C. Adenoviruses. In: Belshe RB, ed. Textbook of human virology. 2nd ed. St. Louis: Mosby-Year Book, Inc.; 1991.
  486. Brockmann D, Esche H. The multifunctional role of E1A in the transcriptional regulation of CREB/CBP-dependent target genes. Curr Top Microbiol Immunol 2003; 272:97-129
  487. Chinnadurai G. CtBP, an unconventional transcriptional corepressor in development and oncogenesis. Mol Cell 2002; 9:213-224
  488. Ng SS, Li A, Pavlakis GN, Ozato K, Kino T. Viral infection increases glucocorticoid-induced interleukin-10 production through ERK-mediated phosphorylation of the glucocorticoid receptor in dendritic cells: potential clinical implications. PLoS One 2013; 8:e63587
  489. Hinzey A, Alexander J, Corry J, Adams KM, Claggett AM, Traylor ZP, Davis IC, Webster Marketon JI. Respiratory syncytial virus represses glucocorticoid receptor-mediated gene activation. Endocrinology 2011; 152:483-494
  490. Webster Marketon JI, Corry J, Teng MN. The respiratory syncytial virus (RSV) nonstructural proteins mediate RSV suppression of glucocorticoid receptor transactivation. Virology. 2014; 449:62-69
  491. Xie J, Long X, Gao L, Chen S, Zhao K, Li W, Zhou N, Zang N, Deng Y, Ren L, Wang L, Luo Z, Tu W, Zhao X, Fu Z, Xie X, Liu E. Respiratory Syncytial Virus Nonstructural Protein 1 Blocks Glucocorticoid Receptor Nuclear Translocation by Targeting IPO13 and May Account for Glucocorticoid Insensitivity. J Infect Dis. 2017; 217(1):35-46

HPA Axis and Sleep

ABSTRACT


Sleep is an important component of mammalian homeostasis, vital for our survival. Sleep disorders are common in the general population and are associated with significant adverse behavioral and health consequences. Sleep, in particular deep sleep, has an inhibitory influence on the hypothalamic-pituitary- adrenal (HPA) axis, whereas activation of the HPA axis or administration of glucocorticoids can lead to arousal and sleeplessness. Insomnia, the most common sleep disorder, is associated with a 24­hour increase of ACTH and cortisol secretion, consistent with a disorder of central nervous system hyperarousal. On the other hand, sleepiness and fatigue are very prevalent in the general population, and studies have demonstrated that the pro­ inflammatory cytokines IL­6 and/or TNF-alpha are elevated in disorders associated with excessive daytime sleepiness, such as sleep apnea, narcolepsy and idiopathic hypersomnia. Sleep deprivation leads to sleepiness and daytime hypersecretion of IL­6, whereas daytime napping following a night of total sleep loss appears to be beneficial both for the suppression of IL­6 secretion and for the improvement of alertness. These findings suggest that the HPA axis stimulates arousal, while IL­6 and TNF-alpha are possible mediators of excessive daytime sleepiness in humans. It appears that the interactions of and disturbances between the HPA axis and inflammatory cytokines determine whether a human being will experience deep sleep/sleepiness or poor sleep/fatigue.

NORMAL SLEEP

Sleep is an important component of mammalian homeostasis, vital for the survival of self and species. We, humans spend at least one third of our lives asleep, yet we have little understanding of why we need sleep and what mechanisms underlie its capacities for physical and mental restoration. Sleep has been proposed to play a fundamental role in the conservation, utilization, and reallocation of energy to maintain cellular homeostasis, anabolism, proper immune function, and normal neural plasticity (1, 2). In addition, sleep contributes substantially to the achievement of synaptic homeostasis by re-normalization of the potentiation of synaptic connections that occurs during wakefulness, in order to support learning and memory functions (2-4). In spite of this though, there has been a significant increase of empirical knowledge that is useful in the evaluation and management of most sleep complaints and their underlying disorders (5). The interaction of circadian effects, i.e., usual time to go to sleep, and amount of prior wakefulness (homeostatic response), determines the onset and amount of sleep (6). Regulated by a strong circadian pacemaker, free running natural sleep­wake rhythms cycle at about 25 hours rather than coinciding with the solar 24-hour schedule (7). However, cues from the environment (zeitgebers) entrain sleep's rhythm to a 24-hour schedule. As a result, persons depend on external cues to keep their diurnal cycle "on time." The normal diurnal clock resists natural changes in its pattern by more than about 1 hour per day, which explains the sleep difficulties that usually accompany adaptation to new time zones or switches in work shifts.

Individuals differ considerably in their natural sleep patterns. Most adults in non-tropical areas are comfortable with 6.5 to 8 hours daily, taken in a single period. Children and adolescents sleep more than adults, and young adults sleep more than older ones. Normal sleep consists of four to six behaviorally and electroencephalographically (EEG) defined cycles, including periods during which the brain is active (associated with rapid eye movements, called REM sleep), preceded by four progressively deeper, quieter sleep stages graded 1 to 4 on the basis of increasingly slow EEG patterns (8) (Figure 1). Deep sleep or slow wave sleep (SWS) (stages 3 and 4) gradually lessens with age and usually disappears in the elderly.

Figure 1. Effects of age on normal sleep cycles. REM sleep (darkened area) occurs cyclically throughout the night at intervals of approximately 90 minutes in all age groups. REM sleep decreases slightly in the elderly, whereas stage 4 sleep decreases progressively with age, so that little, if any, is present in the elderly. In addition, the elderly has frequent awakenings and a notable increase in wake time after sleep onset.

SLEEP DISORDERS

Sleep disorders are common in the general population and are associated with significant behavioral and health consequences (9, 10). Insomnia, the most common sleep disorder, is often associated with psychologic difficulties (11-13) and significant cardiometabolic morbidity and mortality (14-24). Excessive daytime sleepiness is the predominant complaint of most patients evaluated in sleep disorders clinics and often reflects organic dysfunction. Sleep apnea, narcolepsy, and idiopathic hypersomnia are the most common disorders associated with excessive daytime sleepiness. Sleep apnea occurs predominantly in middle-aged men and post­menopausal women and is associated with obesity and cardiovascular complications, including hypertension, while narcolepsy and idiopathic hypersomnia are chronic brain disorders with an onset at a young age (5). In the general population, excessive daytime sleepiness and fatigue are frequent complaints of patients with obesity (13, 25, 26), depression (13, 27, 28) and diabetes (27). The parasomnias, including sleepwalking, night terrors, and nightmares, have benign implications in childhood, but often reflect psychopathology or significant stress in adolescents and adults and organic etiology in the elderly.

SLEEP AND THE STRESS SYSTEM

In mammalian organisms, including human beings, the stress system consists of central and peripheral components, whose main function is to maintain homeostasis, both in the resting and stress states (29-31). The central components include: (i) the paraventricular nuclei (PVN) of the hypothalamus, which secrete corticotropin-releasing hormone (CRH and arginine vasopressin (AVP); ii) the CRH neurons of the paragigantocellular and parabranchial nuclei of the medulla and (iii) the noradrenergic nuclei of the medulla and pons, including the locus caeruleus (LC), regulating arousal, and other nuclei mostly secreting norepinephrine (NE) and regulating the systemic sympathetic and adrenomedullary, as well as the parasympathetic nervous systems. The peripheral components include (i) the neuroendocrine hypothalamic-pituitary-adrenal (HPA) axis; (ii) the efferent systemic sympathetic and adrenomedullary (SNS) and parasympathetic nervous systems (31).

Normal Sleep and the Hypothalamic­Pituitary­Adrenal (HPA) Axis

Although the association between sleep and stress has been noted for hundreds of years, a more systematic approach in the relation between several features of sleep and stress system activity has only taken place in the last two decades (Figure 2). In 1983, Weitzman and colleagues reported that sleep, in particular SWS, appears to have an inhibitory influence on the HPA axis and cortisol secretion (32). Since then, several studies have replicated this finding. In turn, central (intracerebroventricular) administration of CRH (33, 34) or systemic administration of glucocorticoids (35) can lead to arousal and sleeplessness. In normal individuals, wakefulness and stage 1 sleep (light sleep) accompany cortisol increases (36), while slow wave sleep or deep sleep is associated with declining plasma cortisol levels (37). In addition, in normals, induced sleep disruption (frequently repeated arousals) is associated with significant increases of plasma cortisol levels (38). Furthermore, mean 24-hour plasma cortisol levels are significantly higher in subjects with a shorter total sleep time than those with a longer total sleep time (39).

Figure 2. A simplified, heuristic model of the interactions between central and peripheral components of the stress systems with sleep and REM sleep. ACTH: corticotropin; AVP: arginine vasopressin; CRH: corticotropin­releasing hormone; GH: growth hormone; LC/NE: locus caeruleus­norepinephrine/sympathetic nervous system. A solid green line denotes promotion/stimulation; a dashed red line denotes suppression.

The amount of REM sleep, a state of central nervous system activation that resembles unconscious wakefulness (paradoxic sleep), appears to be associated with a higher activity of the HPA axis. An early study showed that 24­hour urinary 17­hydroxycorticoids were increased during REM epochs in urological patients (40). More recently, a study in healthy, normal sleepers showed that the amount of REM sleep was positively correlated with 24-hour urinary free cortisol excretion (41). These results are consistent with the co­existence of HPA axis activation, and REM sleep increases in patients with melancholic depression (30).

Corticotropin Releasing Hormone and ACTH in Sleep/Wake Regulation

CRH produced and released from parvocellular neurons of the paraventricular nucleus is the key regulator of the HPA axis (31). Release of CRH is followed by enhanced secretion of adrenocorticotropin hormone (ACTH) from the anterior pituitary and cortisol from the adrenal cortex. In addition, CRH exerts various influences on behavior, including cerebral activation and waking maintenance, through activation of CRH receptors, which are expressed in the basal prosencephalic areas, thalamus, hypothalamus, mesencephalus, brainstem, and pons (42).


In animals, central (intracerebroventricular) administration of CRH induces increased waking (34, 43, 44), decreased NREM and REM sleep (44, 45), and altered locomotor activity (44, 46). Also, specific CRH antisense oligodeoxynucleotides caused a reduction in spontaneous wakefulness during the dark period, but not during the light period in rats (47). Several reports indicate that CRH is excitatory in the locus caeruleus (LC), amygdala, hippocampus, cerebral cortex, and some portions of the hypothalamus (30, 31). Spontaneous discharge rates in the LC are highest during arousal and lowest during sleep.

In humans, the majority of the studies suggest that the sleep of young individuals is rather resistant to the arousing effects of CRH (48-51). In contrast, middle-aged individuals responded to an equivalent dose of CRH with significantly more wakefulness and suppression of slow wave sleep compared to baseline (51). Based on these findings, we concluded that middle-aged men show increased vulnerability of sleep to stress hormones, possibly resulting in impairments in the quality of sleep during periods of stress. These findings suggest that changes in sleep physiology associated with middle­ age play a significant role in the marked increase of prevalence of insomnia in middle­age. Also, peripheral administration of CRH is associated with a REM suppression, which is stronger in the young than in the middle aged.

The administration of ACTH and its analogues in humans has been associated with general CNS activation consisting of a decreased sleep period time and sleep efficiency, and an increase of sleep latency (39, 44). Continuous administration of ACTH produced a marked reduction in NREM sleep (44).

Glucocorticoid Effects On Sleep

The administration of glucocorticoids causes a robust suppression of REM sleep (44, 52). In addition to the well-established decrease of REM sleep in some studies, the continuous or pulsatile nocturnal administration of cortisol was paradoxically associated with a modest increase of SWS (48,53). It has been suggested that this effect of cortisol on SWS compared to CRH may be mediated by a feedback inhibition of CRH by cortisol.


A study in Addisonian patients demonstrated that an evening replacement dose of hydrocortisone was necessary for proper expression of REM sleep, (vide infra) suggesting that glucocorticoids have some permissive action for this sleep parameter, possibly reflecting an inverse u-shaped dose response curve (54).

In clinical practice, the use of pharmacologic doses of glucocorticoids is associated with sleep disturbance. In fact, in a multicenter, placebo­controlled study in which steroids were used on a short-term basis, insomnia was one of the most common side effects (35).

In addition to their direct effects on sleep, glucocorticoids might also modulate sleep indirectly by influencing the activity of the circadian clock system (from the Latin “circa diem” meaning “approximately a day”), a highly conserved timekeeping system that creates internal rhythmicity under the influence of day/night cycles (55-57). At the cellular and molecular level, glucocorticoids influence peripheral clocks at multiple sites through their intracellular receptor, the glucocorticoid receptor (GR), which functions as a ligand-activated transcription factor (58). Besides this molecular cross-talk, accumulating evidence suggests that glucocorticoids might play a fundamental role in the entrainment of wake-sleep cycle rhythmicity through regulation of behavioral adaptation to phase shifts, possibly through an indirect feedback to the SCN (44, 59).

AGING, HPA AXIS AND SLEEP

Old age is associated with marked sleep changes consisting of increased wake, minimal amounts of SWS, declining amounts of REM sleep, and earlier retiring and rising times. Some studies have shown that older adults have elevated cortisol levels at the time of the circadian nadir and have higher basal cortisol levels than younger adults (60-62). It is difficult to discern whether the latter changes are associated with aging or increased medical morbidity common in this group. It has been suggested that the effect of aging on the levels and diurnal variation of human adrenocorticotropic activity could be involved in the etiology of poor sleep in the elderly (60). Higher evening cortisol concentrations are associated with lower amounts of REM sleep (60, 62), and increased wake (62). More recently, it was shown that older women without estrogen replacement therapy (ERT), when subjected to mild stress, showed greater disturbances in sleep parameters than women on ERT (63).

SLEEP DEPRIVATION AND HPA AXIS

If sleep is important for our sense of well­being, then it is conceivable that sleep deprivation represents a stressor to human bodies and should be associated with activation of the stress system (64). However, several studies that have assessed the effects of one night's sleep deprivation on the HPA axis have shown that cortisol secretion is either not or minimally affected by sleep following prolonged wakefulness (65-67). More recent studies have reported somewhat antithetical results, with some studies showing that cortisol secretion is elevated the next evening following sleep deprivation (68-71) and the other studies showing a significant decrease of plasma cortisol levels the next day (72-74). Additionally, the study by Vgontzas et al (72) indicated that this inhibition of the HPA axis activity was associated with an enhanced activity of the growth hormone axis. Also, similarly to these inconsistent results from studies of total sleep deprivation, partial sleep loss (4 hours of sleep for 6 days) has been reported to be associated with evening cortisol elevation (75) while a modest restriction of sleep to 6 hours per night for one week was associated with a significant decrease of the peak cortisol secretion (76). Newer studies using different sleep restriction experimental protocols have also found inconsistent results, with the majority of them reporting no effect of sleep restriction on the HPA axis (77-82). Methodological differences primarily related on the way subjects were handled during deprivation may explain these opposing findings. The finding that sleep deprivation leads to lower cortisol levels post­ deprivation (primarily during the subsequent night of sleep) suggests that lowering the level of HPA activity, which is increased in depression, may be the mechanism through which sleep deprivation improves the mood of depressed individuals. In one study, we assessed the effects of a 2-hour midafternoon nap following a night of total sleep deprivation on sleepiness, proinflammatory cytokines (IL­6, TNFα) and cortisol levels. Parameters of interest (subjective feeling of sleepiness, psychomotor vigilance­ PVT, IL­6, TNFa and cortisol levels) were measured on the fourth (predeprivation) and sixth days (postdeprivation). We observed a marked and significant drop of cortisol levels during napping, which was followed by a transient increase during the postnap period (83). These findings suggest that sleep and particularly SWS has an inhibiting effect on cortisol secretion and that wake and alertness are associated with higher levels of cortisol.

Prolonged sleep deprivation in rats results in increased plasma norepinephrine levels, higher ACTH and corticosteroid levels at the later phase of sleep deprivation (84). It is postulated that these increases are due to the stress of dying from septicemia rather than to sleep loss. The effects of prolonged sleep deprivation on the HPA axis in humans have not been studied. It is possible that there is activation of stress response when a certain tolerability threshold has been reached.

SLEEP DISORDERS AND HPA AXIS

Although sleep disorders/disturbances with their various physical and mental effects on the individual should be expected to affect the stress system, information regarding the effects of sleep disorders/disturbances on this system is limited.

Insomnia and HPA Axis

Insomnia, a symptom of various psychiatric or medical disorders, may also be the result of an environmental disturbance or a stressful situation. When insomnia is chronic and severe, it may itself become a stressor that affects the patient's life so greatly that it is perceived by the patient as a distinct disorder itself. Either way, as a manifestation of stress or a stressor itself, insomnia is expected to be related to the stress system. Few studies have measured cortisol levels in "poor" sleepers or insomniacs, and those results are inconsistent. The majority of these studies reported no difference between controls and poor sleepers in 24-hour cortisol or 17­hydroxysteroid excretion (85). In a 1998 study in 15 young adult insomniacs, 24-hour urinary free cortisol (UFC) excretion levels were positively correlated with total wake time (86). In addition, 24-hour urinary levels of catecholamines and their metabolites DHPG and DOPAC were positively correlated with percent stage 1 sleep and wake time after sleep onset. However, the total amount of the 24-hour UFC or catecholamine excretion was not different from normative values.

These preliminary findings were confirmed and extended in a controlled study in which objective sleep testing and frequent blood sampling was employed; the 24-hour ACTH and cortisol plasma concentrations were significantly higher in insomniacs than matched normal controls (87). Within the 24-hour period, the greatest elevations were observed in the evening and first half of the night (Figure 3). Also, insomniacs with a high degree of objective sleep disturbance (% sleep time < 70) secreted a higher amount of cortisol, compared to those with a low degree of sleep disturbance. Pulsatile analysis revealed a significantly higher number of peaks per 24h in insomniacs than in controls (p < 0.05), while cosinor analysis showed no differences in the circadian pattern of ACTH or cortisol secretion between insomniacs and controls. Thus, insomnia is associated with an overall increase of ACTH and cortisol secretion, which, however, retains a normal circadian pattern. Also, this increase relates positively to the degree of objective sleep disturbance. These findings are consistent with a disorder of CNS hyperarousal not only during the night but during the day as well, rather than one of sleep loss, which is usually associated with no change or a decrease in cortisol secretion, or a circadian disturbance. Increased evening and nocturnal cortisol peripheral concentrations have been reported in one study (88), while another study that included insomniacs without evidence of objective sleep disturbance did not report differences between insomniacs and controls (89).

Figure 3. Twenty-four-hour plasma cortisol concentrations in insomniacs (■) and controls (O). The thick black line indicates the sleep recording period. The error bar indicates SE, P < 0.01.

It appears that the difference between these two groups of studies is the degree of polysomnographically documented sleep disturbance. For example, in the study by Rodenbeck et al (88) the correlation between the area under the curve (AUC) of cortisol and % sleep efficiency was ­0.91 suggesting that high cortisol levels are present in those insomniacs with an objective short sleep duration. In contrast, in the study by Riemann et al (89), in which no cortisol differences were observed between insomniacs and controls, the objective sleep of insomniacs was very similar to that of controls (88.2% Sleep efficiency vs 88.6%). In another study that applied constant routine conditions, all indices of physiological arousal were increased but not to a significant degree due to lack of power and controls not being selected carefully (90). Interestingly, in the latter study a visual inspection of cortisol data suggested an elevation of cortisol values of 15% to 20% in the insomnia group, a difference similar to that reported in the study by Vgontzas et al. (87) and which should be considered of clinical significance. These preliminary findings on the role of objective sleep disturbance, were recently corroborated by newer studies in experimental or community samples of insomnia patients using polysomnography or actigraphy to objectively assess nighttime sleep (91-93).  In all these three studies, insomnia coupled with objective short sleep duration was associated with higher cortisol levels both in adults (91, 92), as well as in children (93). 


Based on our observations from the studies on Insomnia and HPA axis, that cortisol levels are higher in those with objective short sleep duration (Figure 4) we expected that insomnia with short sleep duration should be associated with significant medical morbidity and mortality. A study, which used a large general random sample of men and women (n=1,754), demonstrated that insomnia with objective short sleep duration (<5h nighttime sleep) entailed the highest risk for hypertension, followed by the insomnia group who slept 5­6 hours, compared to the normal sleeping and >6h sleep duration group (14). In the same population sample, chronic insomnia with objective short sleep duration was also found to be associated with increased odds for type 2 diabetes (15), as well as neuropsychological deficits in speed processing, attention, visual memory and verbal fluency (16). In order to examine the mortality risk in this sample, we followed up men and women for 14 and 10 years respectively. After controlling for several confounders, the mortality rate in insomniac men with objective short sleep duration was four times higher than in control normal sleepers (17).

Figure 4. Twenty-four-hour plasma cortisol concentrations in insomniacs, with low total ST (■) vs. those with high total ST (O) (MANOVA). The thick black line indicates the sleep recording period. The error bar indicates SE, P < 0.01.

More recently, from the same random, general population sample of the Penn State Cohort, 1395 adults were followed up after 7.5 years (22). All of the subjects underwent 8-hour polysomnography. We used the median polysomnographic percentage of sleep time to define short sleep duration (i.e. < 6 hours). Compared with normal sleepers who slept ≥6 hours, the highest risk for incident hypertension was in chronic insomniacs with short sleep duration. This study was the first longitudinal study to have examined the association of insomnia with objective short sleep duration with incident hypertension using polysonomnography (22). 

Finally, another cross-sectional study on a research sample on chronic insomniacs, showed that chronic insomnia (based on standard diagnostic criteria with symptoms lasting ≥6 months) when associated with physiological hyperarousal, (as defined by long MSLT values) is associated with a high risk for hypertension (19). Collectively, the above data further support that objective sleep measures in insomnia are an important index of the medical severity of the disorder, and they also point out the need for validation of practical, feasible, inexpensive methods, such as actigraphy, to measure sleep duration outside of the sleep laboratory. From a clinical standpoint, these data suggest that the therapeutic goal in insomnia should not be just to improve the quality or quantity of nighttime sleep. Rather, they suggest that the common practice of prescribing only hypnotics for patients with chronic insomnia at most is of limited efficacy. Furthermore, the focus of psychotherapeutic and behavioral modalities, including sleep hygiene measures, should not be to just improve the emotional and physiological state of the insomniac pre­ or during sleep, but rather to decrease the overall emotional and physiologic hyperarousal and its underlying factors, present throughout the 24-hour sleep/wake period.

It is possible that medications that suppress the activity of the HPA axis, such as antidepressants (94), could be a promising tool in our pharmacologic approaches. The effects of antidepressants on sleep, as well as on the daytime function and well­being of insomniacs, have not been assessed systematically yet some preliminary studies have reported improvement on sleep (95, 96). The potential usefulness of antidepressants in insomnia was further supported by a study by Rodenbeck et al. (97), who demonstrated the beneficial role of doxepin (a TCA) on both sleep and cortisol secretion in patients with primary insomnia without a clinically diagnosed depression. Moreover, two other studies have also underlined the efficacy and the safety of small doses of doxepin in adults suffering from primary insomnia, as well as in a model of transient insomnia (98, 99).


In conclusion, more studies are needed in order to confirm the possible therapeutic role of antidepressants on chronic insomnia as well as to clarify their underlying sleep­promoting mechanisms.

DISORDERS OF EXCESSIVE DAYTIME SLEEPINESS AND THE HPA AXIS

Obstructive sleep apnea (OSAS), the most common sleep disorder associated with excessive daytime sleepiness and fatigue, is accompanied by nocturnal hypoxia and sleep fragmentation. The latter conditions should be expected to be associated with an activation of the stress system. Indeed, it has been shown that urinary catecholamines, as well as plasma catecholamines measured during the nighttime, are elevated in sleep apneics compared to controls (100). Also, using microneurography, it has been shown that obstructive apneic events are associated with a surge of sympathetic nerve activity (101). In addition, another study lately demonstrated the beneficial effect of CPAP treatment on the stress system of sleep apneic patients (102). It has also been proposed that sympathetic activation in sleep apnea is one of the mechanisms leading to the development of hypertension, a condition commonly associated with sleep apnea. This proposal was supported by a study which showed that 3-month CPAP therapy could moderate hypertension in obese apneic men, an effect that may be attributed to the normalizing actions of CPAP on the stress system by eliminating chronic intermittent hypoxia and repetitive microawakenings (103).

Similarly, it was expected that sleep apnea would also be associated with an activation of the HPA axis. However, findings from different studies are inconsistent. Few studies that have assessed the plasma cortisol levels in sleep apneics have failed to show any differences between sleep apneics and controls (104-107), or more recently, sleep apnea was even reported to be associated with relative hypocortisolemia (108). In addition, no differences were reported in the plasma or urinary free cortisol levels following the abrupt withdrawal of CPAP, the most commonly recommended treatment for sleep apnea (109). However, another study reported that CPAP corrected preexisting hypercortisolemia, particularly after prolonged use (110). In accordance with the latter study, a more recent one demonstrated an association between OSAS and a mild but significant at night elevation of cortisol levels, in obese apneics compared to obese nonapneic controls. The increased levels of cortisol were corrected after the 3­month use of CPAP (111). These results were confirmed later by Henley et al., who showed that untreated compared to treated OSAS was associated with marked disturbances in ACTH and cortisol secretory dynamics (112). Two other studies lately reported increased cortisol levels in sleep apnea (113, 114). This latter study by Kritikou and collaborators showed that sleep apnea in non-obese men was associated with HPA axis activation, similar albeit stronger compared with obese individuals with sleep apnea. The same study was also the first to show that women, similarly to men, suffer from the same degree of the HPA axis activation. Finally, similarly to our previous study in obese men (111), short-term CPAP use had a significant effect on cortisol levels compared with baseline. 

Of interest is also that, in nondepressed, normally sleeping, nonapneic obese men, plasma levels of cortisol were lower than those in nonobese controls and exogenous administration of CRH provoked an enhanced ACTH response (111). These results suggest that in obesity there is hyposecretion of hypothalamic CRH, associated with hypotrophic adrenal cortices requiring compensatorily elevated amounts of ACTH to produce normal amounts of cortisol (111).

The association of the two other major organic disorders of excessive daytime sleepiness, narcolepsy and idiopathic hypersomnia, with the stress system has not been assessed. Preliminary data from a study that assessed the responsiveness of plasma cortisol and ACTH to the exogenous administration of ovine CRH in idiopathic hypersomniacs was associated with a normal or reduced plasma cortisol response, while the ACTH response to CRH tended to be significantly higher in the patients than controls (115). These preliminary findings suggested a subtle hypocortisolism and an inferred hypothalamic CRH deficiency in patients with idiopathic hypersomnia. A central CRH deficiency in these patients is consistent with their clinical profile of increased daytime sleepiness and deep nocturnal sleep (generalized hypoarousal). Consistent with these findings, it was reported that narcolepsy is associated with reduced basal ACTH secretion and a putative reduction of central CRH (116).

FATIGUE, SLEEPINESS AND SLEEP APNEA, AND ADRENAL FUNCTION

Patients with Cushing's syndrome frequently complain of daytime fatigue and sleepiness. In one controlled study, it was demonstrated that Cushing's syndrome was associated with increased frequency of sleep apnea (117). In that study, about 32% of patients with Cushing's syndrome were diagnosed with at least mild sleep apnea, and about 18% had significant sleep apnea (apnea/hypopnea index > 17.5 events per hour). Interestingly, those patients with sleep apnea were not more obese or different in any craniofacial features compared to those patients without sleep apnea. These findings are interesting in light of the new findings that visceral obesity, which is prominent in Cushing's syndrome, is a predisposing factor to sleep apnea (118). Also, Cushing's syndrome in the absence of sleep apnea was associated with increased sleep fragmentation, increased stage 1 and wake, and decreased delta sleep (119).

Adrenal insufficiency or Addison's disease is associated also with chronic fatigue. A study indicated that untreated patients with adrenal insufficiency demonstrated increased sleep fragmentation, increased REM latency, and decreased amount of time in REM sleep, findings that may explain the patients' fatigue (54). These sleep abnormalities were reversed following treatment with a replacement dose of hydrocortisone. These results suggest that cortisol secretion may be needed to facilitate both initiation and maintenance of REM sleep. It should be noted that in normal individuals, exogenous glucocorticoids have been found to reduce REM sleep (52). The authors interpreted their findings that the inhibitory role of glucocorticoids on REM sleep in normals, along with their permissive role in Addison's patients, demonstrate that some cortisol is needed for REM sleep, with excess cortisol inhibiting REM sleep, perhaps indirectly by suppression of CRH.

Also, fatigue and excessive daytime sleepiness are prominent in patients with secondary adrenal insufficiency, e.g., steroid withdrawal, and African trypanosomiasis. The latter conditions are associated with decreased adrenocortical function and elevated TNFα and/or IL­6 levels (120, 121), which may be the mediators of the excessive sleepiness and fatigue associated with primary or secondary adrenal insufficiency, as well of the profound somnolence of patients with African trypanosomiasis.

SLEEP AND CYTOKINES

Research has shown a strong interaction between the HPA axis and the immune system (29). Cytokines have a strong stimulating effect on the HPA axis, whereas cortisol, the end­product of the HPA axis, suppresses secretion (Figure 2). In this section, we will describe what is known on the role of cytokines in sleep regulation and sleep disorders, as well as the interaction effect of cytokines and HPA axis on sleep and its disorders.

Feelings of fatigue and sleepiness are common symptoms associated with infectious diseases and many other physical and mental pathologic conditions. Physicians for millennia have advised their patients to sleep during the course of an illness. However, it is only within the past 20 years that there has been a systematic study on changes in sleep that occur with infection or following microbial product­induced cytokine production (reviewed in 122).

The first reports of the effects of IL­1 on sleep in animals were published in 1984 (123, 124). Following the observation that astrocytes (neuroglia) produce IL­1 (125), which provided the basis to explore whether IL­1 was somnogenic, several studies by Krueger and collaborators established the role of this cytokine in the sleep physiology of the rabbit. These studies (123, 126, 127) indicated that: 1) administration of IL­1 increased electroencephalogram (EEG) slow wave activity in the delta frequency band; 2) the effects of IL­1 on sleep were dose­related; and 3) the enhancement of induction of slow wave sleep (SWS) by IL­1 was not merely a byproduct of fever because pretreatment of animals with anisomycin abolished IL­1­induced fever but not IL­1­induced SWS. Since then, IL­1 has proven to be somnogenic in species other than rabbits, including rats, mice, cats, and monkeys.

The same group of investigators demonstrated that TNFα induced SWS in several species (126, 128), whereas TNFα mRNA (129) and protein in brain (130), exhibit circadian rhythms that coincide with sleep­wake activity. Also, direct intervention with the TNF system by the use of antibodies, binding proteins, or soluble receptors or receptor fragments reduced SWS in otherwise normal animals (131). In addition, mice that lack the 55 kDa TNF receptor sleep less than background strain controls (132). The effects of IL­6 on sleep in animals have not been assessed systematically.

Normal Sleep in Humans and Circadian Secretion of Cytokines

There are several reports that in normal people plasma levels of cytokines are related to the sleep­wake cycle. Moldofsky et al. first described such relations in human beings, showing that IL­1 activity was related to the onset of slow­wave sleep (133). Subsequently, other investigators showed that plasma levels of TNFα vary in phase with EEG slow wave amplitudes (134), and that there is a temporal relation between sleep and IL­1b activity (135, 136). Other studies, using indirect ex vivo methods or direct in vivo measures of plasma concentrations, have demonstrated that IL­6 and TNFα levels in young healthy individuals peak during sleep (103, 136, 137).

Specifically, in the study by Vgontzas et al. (137), at baseline, IL­6 is secreted in a biphasic circadian pattern, with two nadirs at 08.00 and 21.00 h and two zeniths at about 19.00­20.00 and 04.00­05.00 h, with the stronger peak at 05.00 h (Figure 5). Previous studies noted the circadian pattern of IL­6 secretion and its late-night peak (138-140). That these studies did not report on the daytime zenith of IL­6 at about 19.00­20.00 h could be attributable to their using infrequent sampling or a small number of subjects.

Figure 5. Twenty-four-hour plasma IL­6 concentrations pre­ and post­sleep deprivation in eight healthy young men. Each data point represents the mean + SE. *, P < 0.05 indicates statistical significance from the peak value within 24 h for each condition (MANOVA followed by Dunnett, post hoc test). The darkened area indicates the sleep recording period.

In the same study, we demonstrated that daytime IL­6 levels are negatively related to the amount of nocturnal sleep (137). Thus, decreased overall secretion of IL­6 is associated with a good night's sleep and a good sense of well­being the next day, and good sleep is associated with decreased exposure of tissues to the proinflammatory and potentially detrimental actions of IL­6 on the cardiovascular system, insulin sensitivity, and bones (141, 142).

These findings on the circadian pattern of IL­6 secretion were also illustrated in two studies that assessed the effects of modest sleep restriction (76) (Figure 6) as well as the effects of a 2­hour midafternoon nap following a night of total sleep loss (83) (Figure 7) on sleepiness, psychomotor performance and finally plasma levels of proinflammatory cytokines (IL­6, TNFα) and cortisol.

Figure 6. Twenty-four-hour circadian secretory pattern of IL­6 Before (◊) and after (▪) partial sleep restriction. Bar indicates SE. The thick black bar on the abscissa represents the sleep recording period during baseline. The open bar on the abscissa represents the sleep recording period during partial sleep restriction. *, P<0.05.

Figure 7. Twenty-four-hour IL­6 values pre­( ♦ ) and post­(□) sleep deprivation in the no­nap group (top) and the nap group (bottom). Thick black lines on the abscissa indicate nighttime and nap recording periods. Significant reduction of IL­6 during the nap period (1400­1600), P<0.05 

Recently, we assessed the effects of recovery sleep after one week of mild sleep restriction on IL-6, sleepiness and performance (79). Serial 24-h IL-6 plasma levels increased significantly during sleep restriction and returned to baseline after recovery sleep (Figure 8). Subjective and objective sleepiness increased significantly after restriction and returned to baseline after recovery. In contrast, performance deteriorated significantly after restriction and did not improve after recovery.

Figure 8. Serial 24-h IL-6 values at baseline (♦), restriction (■), and recovery (▲). Thick white, gray, and black lines on the abscissa indicate the nighttime sleep recording period at baseline, restriction, and recovery, respectively.


The view that IL­6 is involved in sleep regulation is further supported by the observation that exogenous administration of IL­6 in humans caused profound somnolence and fatigue (143), while in another study, its administration was associated with an increase of SWS in the second half of the night, suggesting a direct action of IL­6 on central nervous system sleep mechanisms (144). The sleep­disturbing effect of exogenous IL­6 noted in the first half of the night might be attributed to increased secretion of CRH, ACTH and cortisol induced by IL­6 during the early part of the night. An alternative, not mutually exclusive, hypothesis is that high levels of IL­6 per se may compromise early nighttime sleep.

Sleep Disturbance, Cytokines and Normal Aging

In a study in which we compared older adults to young subjects, the mean 24­h IL­6 and cortisol secretion was significantly higher in older adults (P < 0.05) (62) (Figure 9). IL­6 secretion in older adults was increased both during the daytime and nighttime, whereas cortisol secretion was more pronounced during the evening and nighttime periods. TNFα secretion in young adults showed a statistically significant circadian rhythm with a peak close to the offset of sleep; such a rhythm was not present in older adults. Both IL­6 and cortisol levels were positively associated with total wake time. The effect of IL­6 on wake time was markedly stronger for the older group than for the young group. The combined effect of cortisol and IL­6 on wake time was additive. IL­6 had a negative association with REM sleep only in the young, while cortisol was associated negatively with REM sleep both in the young and old, with a stronger effect in the young. These results suggest that in healthy adults, age-related alterations in nocturnal wake time are associated with elevation of both plasma IL­6 and cortisol concentrations, while REM sleep declines with age is primarily associated with cortisol increases.

Figure 9. Twenty-four-hour plasma concentrations of IL­6 (top), TNFα (middle), and cortisol (bottom) in healthy young (□) and old (■) individuals. Each data point represents the mean ± SE. The darkened area indicates the sleep recording period.


It has been previously suggested that increased HPA axis activity associated with aging is a result of the "wear and tear" of lifelong exposure to stress (53, 54). An alternative, not mutually exclusive, explanation is that the significant alteration of HPA axis activity associated with age is at least partially secondary to the hypersecretion of IL­6, whose peripheral levels are a good marker of increased morbidity and mortality (145). The source of IL­6 hypersecretion in the elderly is not known. However, we know that IL­6 peripheral levels correlate negatively with sex­steroids levels, positively with the amount of adipose tissue, are decreased after a good night's sleep, and are elevated in chronic pain/inflammatory syndromes (62,137,142,146-148). Old age is associated with decreased sex­steroid concentrations, increased proportional body fat, decreased quantity and quality of sleep, and frequent chronic pain/inflammatory conditions. Reducing the secretion of IL­6 in elderly, either by (a) administration of sex steroids, (b) decreasing fat through diet and exercise, (c) improving nighttime sleep, and (d) controlling adequately chronic pain and inflammation with nonsteroidal anti­inflammatory agents, may improve sleep, daytime alertness, and performance, and decrease the risk of common ailments of old age, e.g., metabolic and cardiovascular problems, cognitive disorders, and osteoporosis (118, 149, 150).

Cytokines as Potential Mediators of Pathological or Experimentally Induced Excessive Daytime Sleepiness

Excessive daytime sleepiness (EDS) occurs in about 5­9% of the general population (9, 13, 151) and is the chief complaint of the majority of patients evaluated at sleep disorders centers. EDS is one of the major physiological consequences of obstructive sleep apnea. Besides the obvious effects of daytime sleepiness on patients' occupational and social life, daytime sleepiness appears to be a major concern of public safety.

There has been a number of studies of cytokine profiles in patients with excessive daytime sleepiness (pathologic or experimentally­ induced) within the last 20 years. In one of the first studies in 1996, Entzian et al. studied 10 hospitalized patients requiring therapy for obstructive sleep apnea (104). Blood samples were collected every 4 hours during the day (08.00 to 20.00 h) and at 2­h intervals during nighttime sleep. Whole blood cultures stimulated with lipopolysaccharide were used to determine cytokine release. The circadian rhythm of TNFα was significantly altered in sleep apnea patients; the peak concentrations that occurred during the night in normal control subjects were not present in sleep apnea patients. Rather, sleep apnea patients exhibited increased TNFα concentrations in the afternoon, the time period during which concentrations in normal control subjects are at a minimum. It is also interesting to note that in spite of a lack of statistical differences due to inherent inter­individual variability, infrequent sampling and a small sample size, absolute IL­1 concentrations in the sleep apnea patients were more than twice those obtained from normal controls, and IFN concentrations were more than three times those of normal controls. Finally, IL­6 in sleep apneics reached maximum concentrations in the evening, in contrast to normal subjects where IL­6 peaked at about 2.00 a.m.

In 1997, we published a study in which cytokine profiles were obtained from several patient populations with disorders of excessive daytime sleepiness (152). Three populations were studied; those with obstructive sleep apnea (n = 12); narcoleptics (n = 11); and idiopathic hypersomniacs (n = 8). Single blood samples were drawn in the morning after the completion of the nighttime sleep laboratory recordings. Plasma concentrations of IL­1β, TNFα, and IL­6 were determined by ELISA. Relative to control subjects, plasma IL­1 concentrations did not differ between the three groups. TNFα was elevated in sleep apnea patients and narcoleptics, and IL­6 was elevated only in sleep apnea patients. Correlational analyses indicated that TNFα and IL­6 correlated positively with measures of excessive daytime sleepiness; TNF was positively correlated with the degree of nocturnal sleep disturbance, and the degree of hypoxia, whereas IL­6 concentrations were correlated with degree of nocturnal sleep disturbance, degree of hypoxia, and body mass index. The potential role of IL­6 as a mediator of daytime sleepiness was further suggested in a study by Hinze­Selch et al. that showed that IL­6 secretion by monocytes was higher in narcoleptics than controls and plasma levels of IL­6 were non-significantly higher in patients compared to controls (153).

The results of our first study prompted us to study further the role of IL­6 and TNFα as potential mediators of EDS in disorders of EDS, i.e., sleep apnea, and in conditions of experimentally­induced daytime sleepiness following sleep deprivation. Those preliminary findings were later corroborated by several studies by us or other researchers that showed that: (a) Single and 24­hour TNFα and IL­6 plasma levels are elevated in adults and children with sleep apnea independently of obesity (103, 118,154-158) (Figure 10); (b) body mass index (BMI) positively correlates with both TNFα and IL­6 levels, suggesting that these two cytokines may play a role in daytime sleepiness experienced by obese individuals in the absence of sleep apnea (25); (c) daytime levels of IL­6 and TNFα are elevated in healthy humans experiencing somnolence and fatigue as a result of total sleep deprivation (137) or even after a modest sleep loss by restricting sleep to 6 hours a night per week (76,159); and (d) a midafternoon nap following a night of total sleep deprivation is beneficial for both the suppression of IL­6 secretion and for the improvement of alertness (83). In the latter studies, greater pre­sleep deprivation amounts of slow wave (deep) sleep rendered the subjects resistant to the effect of sleep deprivation. It is common experience that individuals differ significantly in terms of their ability to sustain sleep loss or curtailment. Those with greater amounts of SWS are inherently more capable of tolerating sleep loss, possibly avoiding exposure to the potentially harmful effects of increased IL­6 secretion. Other studies have confirmed these findings by showing that IL­6 and TNFα are elevated following an 88­hour period of wakefulness (160) and that the nighttime rise of IL­6 levels is delayed during partial sleep deprivation (161). TNFα plasma levels are also elevated in other diseases associated with excessive daytime sleepiness, such as chronic fatigue syndrome, post­dialysis fatigue, HIV patients (162). In 2004, a pilot, placebo­ controlled, double­blind study further supported the somnogenic actions of IL­6 and TNFa. In this study, researchers tested the results of etanercept, a TNFα antagonist in eight obese male apneics suffering from excessive daytime sleepiness. Both sleepiness and AHI (number of apneas/hypopneas per hour) were reduced significantly by the drug compared to the placebo. IL­6 levels were also significantly decreased (163).

Figure 10. Plasma TNF, IL­6, and leptin levels in sleep apneics and BMI­matched obese and normal weight controls. A *, P <0.01 vs. normal weight (nl wt) controls, B *, P < 0. 5 vs. nl wt controls, C *, < 0.05 vs. obese and lean controls.

These studies collectively provide evidence that cytokines are elevated in individuals suffering from a disorder of EDS, e.g., apnea, or healthy individuals experiencing EDS secondary to acute or short­term sleep loss and support the hypothesis that EDS (pathologic or experimentally-induced) may be mediated in part by somnogenic cytokines.

Insomnia and Cytokines

Chronic insomnia, by far the most commonly encountered sleep disorder in medical practice, is characterized by long sleep latencies or increased wake time during the night and increased fatigue during the day, although in objective daytime sleep testing, insomniacs are unable to fall asleep (164, 165).

In a 2002 study, we demonstrated that the mean 24­hour IL­6 and TNF secretions were not different between insomniacs and controls. However, mean IL­6 levels were significantly elevated in insomniacs compared to controls in the mid­afternoon and evening pre­sleep period (15.00­23.00, P < 0.05) (146) (Figure 11). Furthermore, cosinor analysis showed a significant shift of the major peak of IL­6 secretion from early morning (05.00) to evening (20.00) in insomniacs compared to controls. Also, TNFα secretion in controls showed a statistically significant circadian rhythm with a peak close to the offset of sleep; such a rhythm was not present in insomniacs (Figure 12).

Figure 11. Twenty-four-hour circadian secretory pattern of IL­6 in insomniacs (○) and controls (●). The thick black line on the abscissa indicates the sleep recording period. Error bar indicates SE, * P < .05.

Moreover, the daytime secretion of TNF in insomniacs was associated with a regular periodicity of about 4 hours, and its amplitude was significantly different from zero. Controls showed a similar rhythm, which, however, was not significant.

Figure 12. Twenty-four-hour circadian secretory pattern of TNFα in insomniacs (○) and controls (●). The thick black line on the abscissa indicates the sleep recording period. Error bar indicates SE.

Based on these findings, we concluded that chronic insomnia was associated with a shift of IL­6 and TNF secretion from nighttime to daytime, which may explain the daytime fatigue and performance decrements associated with this disorder. The daytime shift of IL­6 and TNF secretion, combined with a 24h hypersecretion of CRH and cortisol, both arousal hormones, may explain the insomniacs' daytime fatigue and difficulty falling asleep during the daytime and/or the nighttime.

In conclusion, despite the fact that the above findings show abnormal secretion patterns of TNFα and IL­6 in insomnia, further studies are needed in order to get better insight into the association between cytokine secretion pattern and chronic insomnia.

Sleepiness vs. Fatigue: The Role of the Interaction of HPA Axis with Cytokines

From our previous studies, it became evident that cytokines are elevated both in disorders of deep sleep/EDS as well as in disorders of poor sleep/fatigue. These seemingly inconsistent findings can be better understood if we clarify the terms sleepiness vs. fatigue and understand the effects of cytokines on sleep/sleepiness in terms of their interaction with HPA axis.

“Sleepiness” and “fatigue” have been considered to be either the same state, different states on a continuum or finally fundamentally different states. In medical practice and literature, these terms are often used interchangeably; however, there is enough clinical evidence to propose a separate definition for these 2 terms in sleep disorders medicine. Sleepiness is a subjective feeling of physical and mental tiredness associated with increased sleep propensity. Fatigue is also a subjective feeling of physical and/or mental tiredness; however, it is not associated with increased sleep propensity. Based on these definitions, sleep disorders or conditions associated with sleepiness include sleep apnea, narcolepsy, and sleep deprivation. On the other hand, sleep disorders associated with fatigue include chronic insomnia, sleep disturbances in the elderly, and psychogenic hypersomnia. This distinction between “sleepiness” and “fatigue” was adopted unanimously as useful for the field of insomnia research by an expert panel of 25 sleep researchers who convened in Pittsburgh on March 10­11, 2005 (166).

Based on our studies, we propose that daytime cytokine hypersecretion and/or circadian shift of cytokine secretion not associated with HPA axis activation leads to sleepiness and deeper sleep, and a good example of this is sleep deprivation. On the other hand, we suggest that daytime cytokine hypersecretion and/or circadian alteration of cytokine secretion associated with HPA axis activation, e.g., insomnia, leads to fatigue and poor sleep.

Such a model, which combines cytokine secretion and HPA axis function to explain sleepiness and increased sleep versus fatigue and poor sleep, is supported by experiments on the effects of exogenous activation of the host defense system on sleep in humans. For example, exogenous administration of IL­6 in healthy humans in the evening was associated with both fatigue and a sleep disturbing effect in the first half of the night, most likely due to increased secretion of corticotrophin­releasing hormone, ACTH, and cortisol, during the early part of the night, induced by IL­6 (144). Also, in dose­response experiments using endotoxin, it was shown that subtle host defense activation not associated with HPA axis activation and increased body temperature enhanced the amount of non­REM sleep, whereas higher doses associated with increased cortisol secretion and increased body temperature, resulted in reduced non­REM sleep and increased wakefulness (167).

REFERENCES 

  1. Schmidt MH. The energy allocation function of sleep: a unifying theory of sleep, torpor, and continuous wakefulness. Neurosci. Biobehav. Rev. 2014;47:122-153
  2. Nollet M, Wisden W, Franks NP. Sleep deprivation and stress: a reciprocal relationship. Interface Focus. 2020;10(3):20190092
  3. Tononi G, Cirelli C. Sleep and the price of plasticity: from synaptic and cellular homeostasis to memory consolidation and integration. Neuron 2014;81:12-34
  4. Bringmann H. Genetic sleep deprivation: using sleep mutants to study sleep functions. EMBO Rep. 2019;20:e46807
  5. Vgontzas AN, Kales A. Sleep and its disorders. Annu Rev Med 1999;50:387-400
  6. Borbely AA. A two process model of sleep regulation. Hum Neurobiol 1982;1:195-204
  7. Czeisler CA, Weitzman E, Moore-Ede MC, Zimmerman JC, Knauer RS. Human sleep: its duration and organization depend on its circadian phase. Science 1980;210:1264-1267
  8. Hori T, Sugita Y, Koga E, et al. Proposed supplements and amendments to 'A Manual of Standardized Terminology, Techniques and Scoring System for Sleep Stages of Human Subjects', the Rechtschaffen & Kales (1968) standard. Psychiatry Clin Neurosci 2001;55:305-310
  9. Bixler EO, Kales A, Soldatos CR, Kales JD, Healey S. Prevalence of sleep disorders in the Los Angeles metropolitan area. Am J Psychiatry 1979;136:1257-1262
  10. Lugaresi E, Cirignotta F, Zucconi M, al e. Good and poor sleepers: An epidemiological survey of the San Marino population. In, Guilleminault, C Lugaresi, C New York: Plenum Press; 1983:1-12
  11. Kales A, Kales J. Evaluation and Treatment of Insomnia. In. New York: Oxford University Press; 1984
  12. Buysse DJ, Reynolds CF, 3rd, Hauri PJ, et al. Diagnostic concordance for DSM-IV sleep disorders: a report from the APA/NIMH DSM-IV field trial. Am J Psychiatry 1994;151:1351-1360
  13. Ford DE, Kamerow DB. Epidemiologic study of sleep disturbances and psychiatric disorders. An opportunity for prevention? JAMA 1989;262:1479-1484
  14. Vgontzas AN, Liao D, Bixler EO, Chrousos GP, Vela-Bueno A. Insomnia with objective short sleep duration is associated with a high risk for hypertension. Sleep 2009;32:491-497
  15. Vgontzas AN, Liao D, Pejovic S, et al. Insomnia with objective short sleep duration is associated with type 2 diabetes: A population-based study. Diabetes Care 2009;32:1980-1985
  16. Fernandez-Mendoza J, Calhoun S, Bixler EO, et al. Insomnia with objective short sleep duration is associated with deficits in neuropsychological performance: a general population study. Sleep 2010;33:459-465
  17. Vgontzas AN, Liao D, Pejovic S, et al. Insomnia with short sleep duration and mortality: the Penn State cohort. Sleep 2010;33:1159-1164
  18. Li Y, Zhang X, Winkelman JW, et al. Association between insomnia symptoms and mortality: a prospective study of U.S. men. Circulation 2014;129:737-746
  19. Li Y, Vgontzas AN, Fernandez-Mendoza J, et al. Insomnia with physiological hyperarousal is associated with hypertension. Hypertension 2015;65:644-650
  20. Vgontzas AN, Fernandez-Mendoza J. Insomnia with Short Sleep Duration: Nosological, Diagnostic, and Treatment Implications. Sleep Med Clin 2013;8:309-322
  21. Laugsand LE, Vatten LJ, Platou C, Janszky I. Insomnia and the risk of acute myocardial infarction: a population study. Circulation 2011;124:2073-2081
  22. Fernandez-Mendoza J, Vgontzas AN, Liao D, et al. Insomnia with objective short sleep duration and incident hypertension: the Penn State Cohort. Hypertension 2012;60:929-935
  23. De Zambotti M, Covassin N, De Min Tona G, Sarlo M, Stegagno L. Sleep onset and cardiovascular activity in primary insomnia. J Sleep Res 2011;20:318-325
  24. Knutson KL, Van Cauter E, Zee P, Liu K, Lauderdale DS. Cross-sectional associations between measures of sleep and markers of glucose metabolism among subjects with and without diabetes: the Coronary Artery Risk Development in Young Adults (CARDIA) Sleep Study. Diabetes Care 2011;34:1171-1176
  25. Vgontzas AN, Bixler EO, Tan TL, et al. Obesity without sleep apnea is associated with daytime sleepiness. Arch Intern Med 1998;158:1333-1337
  26. Bixler EO, Vgontzas AN, Lin HM, et al. Excessive daytime sleepiness in a general population sample: the role of sleep apnea, age, obesity, diabetes, and depression. J Clin Endocrinol Metab 2005;90:4510-4515
  27. Bixler E, Vgontzas A, Lin H, Leiby B, Kales A. Excessive daytime sleepiness: association with diabetes. In. Denver, CO: Endocrine Society's 83rd Annual Meeting; 2001
  28. Basta M, Lin HM, Pejovic S, et al. Lack of regular exercise, depression, and degree of apnea are predictors of excessive daytime sleepiness in patients with sleep apnea: sex differences. J Clin Sleep Med 2008;4:19-25
  29. Chrousos GP. The hypothalamic-pituitary-adrenal axis and immune-mediated inflammation. N Engl J Med 1995;332:1351-1362
  30. Chrousos GP, Gold PW. The concepts of stress and stress system disorders. Overview of physical and behavioral homeostasis. Jama 1992;267:1244-1252
  31. Nicolaides NC, Kyratzi E, Lamprokostopoulou A, Chrousos GP, Charmandari E. Stress, the stress system and the role of glucocorticoids. Neuroimmunomodulation. 2015;22(1-2):6-19
  32. Weitzman ED, Zimmerman JC, Czeisler CA, Ronda J. Cortisol secretion is inhibited during sleep in normal man. J Clin Endocrinol Metab 1983;56:352-358
  33. Opp M, Obal F, Jr., Krueger JM. Corticotropin-releasing factor attenuates interleukin 1-induced sleep and fever in rabbits. Am J Physiol 1989;257:R528-535
  34. Opp MR. Corticotropin-releasing hormone involvement in stressor-induced alterations in sleep and in the regulation of waking. Adv Neuroimmunol 1995;5:127-143
  35. Chrousos GA, Kattah JC, Beck RW, Cleary PA. Side effects of glucocorticoid treatment. Experience of the Optic Neuritis Treatment Trial. Jama 1993;269:2110-2112
  36. Born J, Kern W, Bieber K, et al. Night-time plasma cortisol secretion is associated with specific sleep stages. Biol Psychiatry 1986;21:1415-1424
  37. Follenius M, Brandenberger G, Bandesapt JJ, Libert JP, Ehrhart J. Nocturnal cortisol release in relation to sleep structure. Sleep 1992;15:21-27
  38. Spath-Schwalbe E, Gofferje M, Kern W, Born J, Fehm HL. Sleep disruption alters nocturnal ACTH and cortisol secretory patterns. Biol Psychiatry 1991;29:575-584
  39. Steiger A, Holsboer F. Neuropeptides and human sleep. Sleep 1997;20:1038-1052
  40. Mandell MP, Mandell AJ, Rubin RT, et al. Activation of the pituitary-adrenal axis during rapid eye movement sleep in man. Life Sci 1966;5:583-587
  41. Vgontzas AN, Bixler EO, Papanicolaou DA, et al. Rapid eye movement sleep correlates with the overall activities of the hypothalamic-pituitary-adrenal axis and sympathetic system in healthy humans. J Clin Endocrinol Metab 1997;82:3278-3280
  42. De Souza EB. Corticotropin-releasing factor receptors in the rat central nervous system: characterization and regional distribution. J. Neurosci. 1987;7:88-100
  43. Chang FC & Opp MR. Blockade of corticotropin-releasing hormone receptors reduces spontaneous waking in the rat. Am. J. Physiol. 1998;275:R793-802
  44. Lo Martire V, Caruso D, Palagini L, Zoccoli G, Bastianini S. Stress & sleep: A relationship lasting a lifetime. Neurosci Biobehav Rev. 2019;S0149-7634(19)30149-6
  45. Romanowski CP, Fenzl T, Flachskamm C, Wurst W, Holsboer F, Deussing JM, Kimura M. Central deficiency of corticotropin-releasing hormone receptor type 1 (CRH-R1) abolishes effects of CRH on NREM but not on REM sleep in mice. Sleep 2010;33:427-436
  46. Swerdlow NR, Geyer MA, Vale WW, Koob GF. Corticotropin-releasing factor potentiates acoustic startle in rats: blockade by chlordiazepoxide. Psychopharmacology (Berl.) 1986;88:147-152
  47. Chang FC, Opp MR. A corticotropin-releasing hormone antisense oligodeoxynucleotide reduces spontaneous waking in the rat. Regul. Pept. 2004;117:43-52
  48. Born J, Spath-Schwalbe E, Schwakenhofer H, Kern W, Fehm HL. Influences of corticotropin-releasing hormone, adrenocorticotropin, and cortisol on sleep in normal man. J Clin Endocrinol Metab 1989;68:904-911
  49. Kellner M, Yassouridis A, Manz B, et al. Corticotropin-releasing hormone inhibits melatonin secretion in healthy volunteers--a potential link to low-melatonin syndrome in depression? Neuroendocrinology 1997;65:284-290
  50. Mann K, Roschke J, Benkert O, et al. Effects of corticotropin-releasing hormone on respiratory parameters during sleep in normal men. Exp Clin Endocrinol Diabetes 1995;103:233-240
  51. Vgontzas AN, Bixler EO, Wittman AM, et al. Middle-aged men show higher sensitivity of sleep to the arousing effects of corticotropin-releasing hormone than young men: clinical implications. J Clin Endocrinol Metab 2001;86:1489-1495
  52. Gillin JC, Jacobs LS, Fram DH, Snyder F. Acute effect of a glucocorticoid on normal human sleep. Nature 1972;237:398-399
  53. Steiger A, Antonijevic IA, Bohlhalter S, et al. Effects of hormones on sleep. Horm Res 1998;49:125-130
  54. Garcia-Borreguero D, Wehr TA, Larrosa O, et al. Glucocorticoid replacement is permissive for rapid eye movement sleep and sleep consolidation in patients with adrenal insufficiency. J Clin Endocrinol Metab 2000;85:4201-4206
  55. Nicolaides NC, Charmandari E, Chrousos GP, Kino T. Circadian endocrine rhythms: the hypothalamic-pituitary-adrenal axis and its actions. Ann N Y Acad Sci. 2014;1318:71-80
  56. Nicolaides NC, Charmandari E, Kino T, Chrousos GP. Stress-Related and Circadian Secretion and Target Tissue Actions of Glucocorticoids: Impact on Health. Front Endocrinol (Lausanne). 2017;8:70
  57. Agorastos A, Nicolaides NC, Bozikas VP, Chrousos GP, Pervanidou P. Multilevel Interactions of Stress and Circadian System: Implications for Traumatic Stress. Front Psychiatry. 2020;10:1003
  58. Nicolaides NC, Galata Z, Kino T, Chrousos GP, Charmandari E. The human glucocorticoid receptor: molecular basis of biologic function. Steroids. 2010;75(1):1-12
  59. Kalsbeek A, van der Spek R, Lei J, Endert E, Buijs RM, Fliers E. Circadian rhythms in the hypothalamo-pituitary-adrenal (HPA) axis. Mol. Cell. Endocrinol. 2012;349:20-29
  60. Van Cauter E, Leproult R, Plat L. Age-related changes in slow wave sleep and REM sleep and relationship with growth hormone and cortisol levels in healthy men. Jama 2000;284:861-868
  61. Van Cauter E, Leproult R, Kupfer DJ. Effects of gender and age on the levels and circadian rhythmicity of plasma cortisol. J Clin Endocrinol Metab 1996;81:2468-2473
  62. Vgontzas AN, Zoumakis M, Bixler EO, et al. Impaired nighttime sleep in healthy old versus young adults is associated with elevated plasma interleukin-6 and cortisol levels: physiologic and therapeutic implications. J Clin Endocrinol Metab 2003;88:2087-2095
  63. Prinz P, Bailey S, Moe K, Wilkinson C, Scanlan J. Urinary free cortisol and sleep under baseline and stressed conditions in healthy senior women: effects of estrogen replacement therapy. J Sleep Res 2001;10:19-26
  64. Nollet M, Wisden W, Franks NP. Sleep deprivation and stress: a reciprocal relationship. Interface Focus. 2020;10(3):20190092
  65. Brun J, Chamba G, Khalfallah Y, et al. Effect of modafinil on plasma melatonin, cortisol and growth hormone rhythms, rectal temperature and performance in healthy subjects during a 36 h sleep deprivation. J Sleep Res 1998;7:105-114
  66. Moldofsky H, Lue FA, Davidson JR, Gorczynski R. Effects of sleep deprivation on human immune functions. Faseb j 1989;3:1972-1977
  67. Scheen AJ, Byrne MM, Plat L, Leproult R, Van Cauter E. Relationships between sleep quality and glucose regulation in normal humans. Am J Physiol 1996;271:E261-270
  68. Leproult R, Copinschi G, Buxton O, Van Cauter E. Sleep loss results in an elevation of cortisol levels the next evening. Sleep 1997;20:865-870
  69. Wright KP, Jr., Drake AL, Frey DJ, et al. Influence of sleep deprivation and circadian misalignment on cortisol, inflammatory markers, and cytokine balance. Brain Behav Immun 2015;47:24-34
  70. Minkel J, Moreta M, Muto J, et al. Sleep deprivation potentiates HPA axis stress reactivity in healthy adults. Health Psychol 2014;33:1430-1434
  71. Joo EY, Yoon CW, Koo DL, Kim D, Hong SB. Adverse effects of 24 hours of sleep deprivation on cognition and stress hormones. J Clin Neurol 2012;8:146-150
  72. Vgontzas AN, Mastorakos G, Bixler EO, et al. Sleep deprivation effects on the activity of the hypothalamic-pituitary-adrenal and growth axes: potential clinical implications. Clin Endocrinol (Oxf) 1999;51:205-215
  73. Klumpers UM, Veltman DJ, van Tol MJ, et al. Neurophysiological effects of sleep deprivation in healthy adults, a pilot study. PLoS One 2015;10:e0116906
  74. Ernst F, Rauchenzauner M, Zoller H, et al. Effects of 24 h working on-call on psychoneuroendocrine and oculomotor function: a randomized cross-over trial. Psychoneuroendocrinology 2014;47:221-231
  75. Spiegel K, Leproult R, Van Cauter E. Impact of sleep debt on metabolic and endocrine function. Lancet 1999;354:1435-1439
  76. Vgontzas AN, Zoumakis E, Bixler EO, et al. Adverse effects of modest sleep restriction on sleepiness, performance, and inflammatory cytokines. J Clin Endocrinol Metab 2004;89:2119-2126
  77. Guyon A, Balbo M, Morselli LL, et al. Adverse effects of two nights of sleep restriction on the hypothalamic-pituitary-adrenal axis in healthy men. J Clin Endocrinol Metab 2014;99:2861-2868
  78. Reynolds AC, Dorrian J, Liu PY, et al. Impact of five nights of sleep restriction on glucose metabolism, leptin and testosterone in young adult men. PLoS One 2012;7:e41218
  79. Pejovic S, Basta M, Vgontzas AN, et al. Effects of recovery sleep after one work week of mild sleep restriction on interleukin-6 and cortisol secretion and daytime sleepiness and performance. Am J Physiol Endocrinol Metab 2013;305:E890-896
  80. Voderholzer U, Piosczyk H, Holz J, et al. The impact of increasing sleep restriction on cortisol and daytime sleepiness in adolescents. Neurosci Lett 2012;507:161-166
  81. Schmid SM, Hallschmid M, Jauch-Chara K, et al. Disturbed glucoregulatory response to food intake after moderate sleep restriction. Sleep 2011;34:371-377
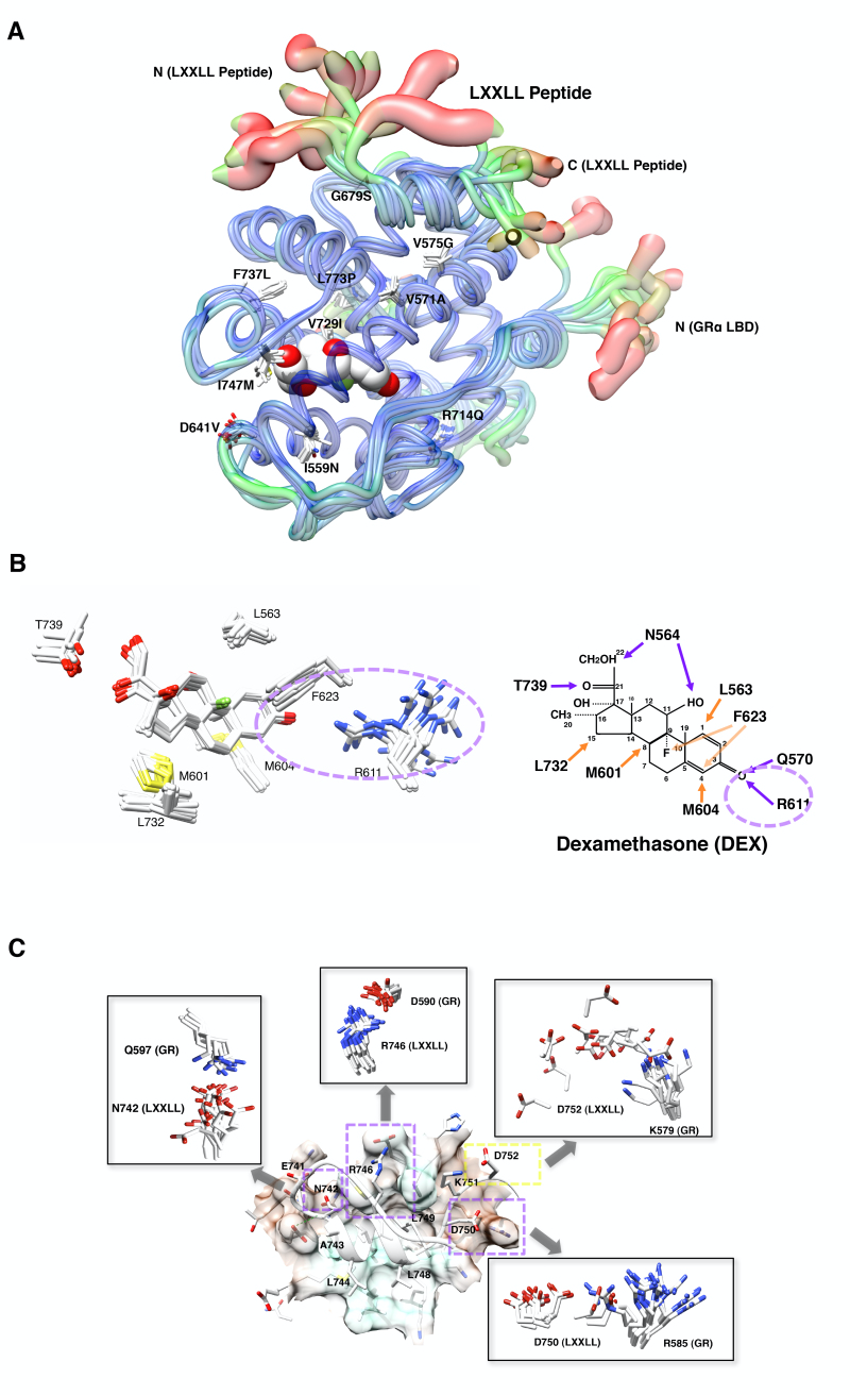
  82. Faraut B, Boudjeltia KZ, Dyzma M, et al. Benefits of napping and an extended duration of recovery sleep on alertness and immune cells after acute sleep restriction. Brain Behav Immun 2011;25:16-24
  83. Vgontzas AN, Pejovic S, Zoumakis E, et al. Daytime napping after a night of sleep loss decreases sleepiness, improves performance, and causes beneficial changes in cortisol and interleukin-6 secretion. Am J Physiol Endocrinol Metab 2007;292:E253-261
  84. Rechtschaffen A, Bergmann BM, Everson CA, Kushida CA, Gilliland MA. Sleep deprivation in the rat: X. Integration and discussion of the findings. Sleep 1989;12:68-87
  85. Adam K, Tomeny M, Oswald I. Physiological and psychological differences between good and poor sleepers. J Psychiatr Res 1986;20:301-316
  86. Vgontzas AN, Tsigos C, Bixler EO, et al. Chronic insomnia and activity of the stress system: a preliminary study. J Psychosom Res 1998;45:21-31
  87. Vgontzas AN, Bixler EO, Lin HM, et al. Chronic insomnia is associated with nyctohemeral activation of the hypothalamic-pituitary-adrenal axis: clinical implications. J Clin Endocrinol Metab 2001;86:3787-3794
  88. Rodenbeck A, Huether G, Rüther E, Hajak G. Interactions between evening and nocturnal cortisol secretion and sleep parameters in patients with severe chronic primary insomnia. Neurosci Lett 2002;324:159-163
  89. Riemann D, Klein T, Rodenbeck A, et al. Nocturnal cortisol and melatonin secretion in primary insomnia. Psychiatry Res 2002;113:17-27
  90. Varkevisser M, Van Dongen HP, Kerkhof GA. Physiologic indexes in chronic insomnia during a constant routine: evidence for general hyperarousal? Sleep 2005;28:1588-1596
  91. D'Aurea C, Poyares D, Piovezan RD, et al. Objective short sleep duration is associated with the activity of the hypothalamic-pituitary-adrenal axis in insomnia. Arq Neuropsiquiatr 2015;73:516-519
  92. Floam S, Simpson N, Nemeth E, et al. Sleep characteristics as predictor variables of stress systems markers in insomnia disorder. J Sleep Res 2015;24:296-304
  93. Fernandez-Mendoza J, Vgontzas AN, Calhoun SL, et al. Insomnia symptoms, objective sleep duration and hypothalamic-pituitary-adrenal activity in children. Eur J Clin Invest 2014;44:493-500
  94. Michelson D, Galliven E, Hill L, et al. Chronic imipramine is associated with diminished hypothalamic-pituitary-adrenal axis responsivity in healthy humans. J Clin Endocrinol Metab 1997;82:2601-2606
  95. Hajak G, Rodenbeck A, Adler L, et al. Nocturnal melatonin secretion and sleep after doxepin administration in chronic primary insomnia. Pharmacopsychiatry 1996;29:187-192
  96. Hohagen F, Montero RF, Weiss E, et al. Treatment of primary insomnia with trimipramine: an alternative to benzodiazepine hypnotics? Eur Arch Psychiatry Clin Neurosci 1994;244:65-72
  97. Rodenbeck A, Cohrs S, Jordan W, et al. The sleep-improving effects of doxepin are paralleled by a normalized plasma cortisol secretion in primary insomnia. A placebo-controlled, double-blind, randomized, cross-over study followed by an open treatment over 3 weeks. Psychopharmacology (Berl) 2003;170:423-428
  98. Roth T, Rogowski R, Hull S, et al. Efficacy and safety of doxepin 1 mg, 3 mg, and 6 mg in adults with primary insomnia. Sleep 2007;30:1555-1561
  99. Roth T, Heith Durrence H, Jochelson P, et al. Efficacy and safety of doxepin 6 mg in a model of transient insomnia. Sleep Med 2010;11:843-847
  100. Fletcher EC, Miller J, Schaaf JW, Fletcher JG. Urinary catecholamines before and after tracheostomy in patients with obstructive sleep apnea and hypertension. Sleep 1987;10:35-44
  101. Waradekar NV, Sinoway LI, Zwillich CW, Leuenberger UA. Influence of treatment on muscle sympathetic nerve activity in sleep apnea. Am J Respir Crit Care Med 1996;153:1333-1338
  102. Mills PJ, Kennedy BP, Loredo JS, Dimsdale JE, Ziegler MG. Effects of nasal continuous positive airway pressure and oxygen supplementation on norepinephrine kinetics and cardiovascular responses in obstructive sleep apnea. J Appl Physiol (1985) 2006;100:343-348
  103. Vgontzas AN, Zoumakis E, Bixler EO, et al. Selective effects of CPAP on sleep apnoea-associated manifestations. Eur J Clin Invest 2008;38:585-595
  104. Entzian P, Linnemann K, Schlaak M, Zabel P. Obstructive sleep apnea syndrome and circadian rhythms of hormones and cytokines. Am J Respir Crit Care Med 1996;153:1080-1086
  105. Guilleminault C, Dement W. Sleep Apnea Syndromes. In. New York: Alan R Liss; 1978
  106. Panaree B, Chantana M, Wasana S, Chairat N. Effects of obstructive sleep apnea on serum brain-derived neurotrophic factor protein, cortisol, and lipid levels. Sleep Breath 2011;15:649-656
  107. Barcelo A, Barbe F, de la Pena M, et al. Insulin resistance and daytime sleepiness in patients with sleep apnoea. Thorax 2008;63:946-950
  108. Karaca Z, Ismailogullari S, Korkmaz S, et al. Obstructive sleep apnoea syndrome is associated with relative hypocortisolemia and decreased hypothalamo-pituitary-adrenal axis response to 1 and 250mug ACTH and glucagon stimulation tests. Sleep Med 2013;14:160-164
  109. Grunstein RR, Stewart DA, Lloyd H, et al. Acute withdrawal of nasal CPAP in obstructive sleep apnea does not cause a rise in stress hormones. Sleep 1996;19:774-782
  110. Bratel T, Wennlund A, Carlstrom K. Pituitary reactivity, androgens and catecholamines in obstructive sleep apnoea. Effects of continuous positive airway pressure treatment (CPAP). Respir Med 1999;93:1-7
  111. Vgontzas AN, Pejovic S, Zoumakis E, et al. Hypothalamic-pituitary-adrenal axis activity in obese men with and without sleep apnea: effects of continuous positive airway pressure therapy. J Clin Endocrinol Metab 2007;92:4199-4207
  112. Henley DE, Russell GM, Douthwaite JA, et al. Hypothalamic-pituitary-adrenal axis activation in obstructive sleep apnea: the effect of continuous positive airway pressure therapy. J Clin Endocrinol Metab 2009;94:4234-4242
  113. Edwards KM, Kamat R, Tomfohr LM, Ancoli-Israel S, Dimsdale JE. Obstructive sleep apnea and neurocognitive performance: the role of cortisol. Sleep Med 2014;15:27-32
  114. Kritikou I, Basta M, Vgontzas AN, et al. Sleep apnoea and the hypothalamic-pituitary-adrenal axis in men and women: effects of continuous positive airway pressure. Eur Respir J 2015
  115. Vgontzas A, Papanicolaou D, Bixler E, et al. Evidence of corticotropin-releasing hormone (CRH) deficiency in patients with idiopathic hypersomnia: Clinical and pathophysiological implications. In. Minneapolis, MN: Endocrine Society's 79th Annual Meeting; 1997
  116. Kok SW, Roelfsema F, Overeem S, et al. Dynamics of the pituitary-adrenal ensemble in hypocretin-deficient narcoleptic humans: blunted basal adrenocorticotropin release and evidence for normal time-keeping by the master pacemaker. J Clin Endocrinol Metab 2002;87:5085-5091
  117. Shipley JE, Schteingart DE, Tandon R, Starkman MN. Sleep architecture and sleep apnea in patients with Cushing's disease. Sleep 1992;15:514-518
  118. Vgontzas AN, Papanicolaou DA, Bixler EO, et al. Sleep apnea and daytime sleepiness and fatigue: relation to visceral obesity, insulin resistance, and hypercytokinemia. J Clin Endocrinol Metab 2000;85:1151-1158
  119. Friedman TC, Garcia-Borreguero D, Hardwick D, et al. Decreased delta-sleep and plasma delta-sleep-inducing peptide in patients with Cushing syndrome. Neuroendocrinology 1994;60:626-634
  120. Papanicolaou DA, Tsigos C, Oldfield EH, Chrousos GP. Acute glucocorticoid deficiency is associated with plasma elevations of interleukin-6: does the latter participate in the symptomatology of the steroid withdrawal syndrome and adrenal insufficiency? J Clin Endocrinol Metab 1996;81:2303-2306
  121. Reincke M, Heppner C, Petzke F, et al. Impairment of adrenocortical function associated with increased plasma tumor necrosis factor-alpha and interleukin-6 concentrations in African trypanosomiasis. Neuroimmunomodulation 1994;1:14-22
  122. Irwin MR. Sleep and inflammation: partners in sickness and in health. Nat Rev Immunol. 2019 Nov;19(11):702-715
  123. Krueger JM, Walter J, Dinarello CA, Wolff SM, Chedid L. Sleep-promoting effects of endogenous pyrogen (interleukin-1). Am J Physiol 1984;246:R994-999
  124. Tobler I, Borbely AA, Schwyzer M, Fontana A. Interleukin-1 derived from astrocytes enhances slow wave activity in sleep EEG of the rat. Eur J Pharmacol 1984;104:191-192
  125. Fontana A, Kristensen F, Dubs R, Gemsa D, Weber E. Production of prostaglandin E and an interleukin-1 like factor by cultured astrocytes and C6 glioma cells. J Immunol 1982;129:2413-2419
  126. Shoham S, Davenne D, Cady AB, Dinarello CA, Krueger JM. Recombinant tumor necrosis factor and interleukin 1 enhance slow-wave sleep. Am J Physiol 1987;253:R142-149
  127. Walter JS, Meyers P, Krueger JM. Microinjection of interleukin-1 into brain: separation of sleep and fever responses. Physiol Behav 1989;45:169-176
  128. Kapas L, Krueger JM. Tumor necrosis factor-beta induces sleep, fever, and anorexia. Am J Physiol 1992;263:R703-707
  129. Bredow S, Guha-Thakurta N, Taishi P, Obal F, Jr., Krueger JM. Diurnal variations of tumor necrosis factor alpha mRNA and alpha-tubulin mRNA in rat brain. Neuroimmunomodulation 1997;4:84-90
  130. Floyd RA, Krueger JM. Diurnal variation of TNF alpha in the rat brain. Neuroreport 1997;8:915-918
  131. Takahashi S, Kapas L, Fang J, Krueger JM. An anti-tumor necrosis factor antibody suppresses sleep in rats and rabbits. Brain Res 1995;690:241-244
  132. Fang J, Wang Y, Krueger JM. Mice lacking the TNF 55 kDa receptor fail to sleep more after TNFalpha treatment. J Neurosci 1997;17:5949-5955
  133. Moldofsky H, Lue FA, Eisen J, Keystone E, Gorczynski RM. The relationship of interleukin-1 and immune functions to sleep in humans. Psychosom Med 1986;48:309-318
  134. Darko DF, Miller JC, Gallen C, et al. Sleep electroencephalogram delta-frequency amplitude, night plasma levels of tumor necrosis factor alpha, and human immunodeficiency virus infection. Proc Natl Acad Sci U S A 1995;92:12080-12084
  135. Covelli V, D'Andrea L, Savastano S, et al. Interleukin-1 beta plasma secretion during diurnal spontaneous and induced sleeping in healthy volunteers. Acta Neurol (Napoli) 1994;16:79-86
  136. Gudewill S, Pollmacher T, Vedder H, et al. Nocturnal plasma levels of cytokines in healthy men. Eur Arch Psychiatry Clin Neurosci 1992;242:53-56
  137. Vgontzas AN, Papanicolaou DA, Bixler EO, et al. Circadian interleukin-6 secretion and quantity and depth of sleep. J Clin Endocrinol Metab 1999;84:2603-2607
  138. Bauer J, Hohagen F, Ebert T, et al. Interleukin-6 serum levels in healthy persons correspond to the sleep-wake cycle. Clin Investig 1994;72:315
  139. Crofford LJ, Kalogeras KT, Mastorakos G, et al. Circadian relationships between interleukin (IL)-6 and hypothalamic-pituitary-adrenal axis hormones: failure of IL-6 to cause sustained hypercortisolism in patients with early untreated rheumatoid arthritis. J Clin Endocrinol Metab 1997;82:1279-1283
  140. Sothern RB, Roitman-Johnson B, Kanabrocki EL, et al. Circadian characteristics of interleukin-6 in blood and urine of clinically healthy men. In Vivo 1995;9:331-339
  141. Fernandez-Real JM, Vayreda M, Richart C, et al. Circulating interleukin 6 levels, blood pressure, and insulin sensitivity in apparently healthy men and women. J Clin Endocrinol Metab 2001;86:1154-1159
  142. Papanicolaou DA, Wilder RL, Manolagas SC, Chrousos GP. The pathophysiologic roles of interleukin-6 in human disease. Ann Intern Med 1998;128:127-137
  143. Mastorakos G, Chrousos GP, Weber JS. Recombinant interleukin-6 activates the hypothalamic-pituitary-adrenal axis in humans. J Clin Endocrinol Metab 1993;77:1690-1694
  144. Spath-Schwalbe E, Hansen K, Schmidt F, et al. Acute effects of recombinant human interleukin-6 on endocrine and central nervous sleep functions in healthy men. J Clin Endocrinol Metab 1998;83:1573-1579
  145. Ershler WB, Keller ET. Age-associated increased interleukin-6 gene expression, late-life diseases, and frailty. Annu Rev Med 2000;51:245-270
  146. Vgontzas AN, Zoumakis M, Papanicolaou DA, et al. Chronic insomnia is associated with a shift of interleukin-6 and tumor necrosis factor secretion from nighttime to daytime. Metabolism 2002;51:887-892
  147. Vgontzas AN, Chrousos GP. Sleep, the hypothalamic-pituitary-adrenal axis, and cytokines: multiple interactions and disturbances in sleep disorders. Endocrinol Metab Clin North Am 2002;31:15-36
  148. Gold PW, Chrousos GP. Organization of the stress system and its dysregulation in melancholic and atypical depression: high vs low CRH/NE states. Mol Psychiatry 2002;7:254-275
  149. Chrousos GP, Gold PW. A healthy body in a healthy mind--and vice versa--the damaging power of "uncontrollable" stress. J Clin Endocrinol Metab 1998;83:1842-1845
  150. Clauw DJ, Chrousos GP. Chronic pain and fatigue syndromes: overlapping clinical and neuroendocrine features and potential pathogenic mechanisms. Neuroimmunomodulation 1997;4:134-153
  151. Partinen M. Sleeping habits and sleep disorders of Finnish men before, during, and after military service. In: Ann Med Milit Fenn; 1982
  152. Vgontzas AN, Papanicolaou DA, Bixler EO, et al. Elevation of plasma cytokines in disorders of excessive daytime sleepiness: role of sleep disturbance and obesity. J Clin Endocrinol Metab 1997;82:1313-1316
  153. Hinze-Selch D, Wetter TC, Zhang Y, et al. In vivo and in vitro immune variables in patients with narcolepsy and HLA-DR2 matched controls. Neurology 1998;50:1149-1152
  154. Kritikou I, Basta M, Vgontzas AN, et al. Sleep apnoea, sleepiness, inflammation and insulin resistance in middle-aged males and females. Eur Respir J 2014;43:145-155
  155. Gozal D, Serpero LD, Sans Capdevila O, Kheirandish-Gozal L. Systemic inflammation in non-obese children with obstructive sleep apnea. Sleep Med 2008;9:254-259
  156. Tsaoussoglou M, Bixler EO, Calhoun S, et al. Sleep-disordered breathing in obese children is associated with prevalent excessive daytime sleepiness, inflammation, and metabolic abnormalities. J Clin Endocrinol Metab 2010;95:143-150
  157. Svensson M, Venge P, Janson C, Lindberg E. Relationship between sleep-disordered breathing and markers of systemic inflammation in women from the general population. J Sleep Res 2012;21:147-154
  158. Khalyfa A, Serpero LD, Kheirandish-Gozal L, Capdevila OS, Gozal D. TNF-alpha gene polymorphisms and excessive daytime sleepiness in pediatric obstructive sleep apnea. J Pediatr 2011;158:77-82
  159. Haack M, Sanchez E, Mullington JM. Elevated inflammatory markers in response to prolonged sleep restriction are associated with increased pain experience in healthy volunteers. Sleep 2007;30:1145-1152
  160. Shearer WT, Reuben JM, Mullington JM, et al. Soluble TNF-alpha receptor 1 and IL-6 plasma levels in humans subjected to the sleep deprivation model of spaceflight. J Allergy Clin Immunol 2001;107:165-170
  161. Redwine L, Hauger RL, Gillin JC, Irwin M. Effects of sleep and sleep deprivation on interleukin-6, growth hormone, cortisol, and melatonin levels in humans. J Clin Endocrinol Metab 2000;85:3597-3603
  162. Obal F, Jr., Krueger JM. Biochemical regulation of non-rapid-eye-movement sleep. Front Biosci 2003;8:d520-550
  163. Vgontzas AN, Zoumakis E, Lin HM, et al. Marked decrease in sleepiness in patients with sleep apnea by etanercept, a tumor necrosis factor-alpha antagonist. J Clin Endocrinol Metab 2004;89:4409-4413
  164. Bonnet MH, Arand DL. The consequences of a week of insomnia. Sleep 1996;19:453-461
  165. Stepanski E, Zorick F, Roehrs T, Young D, Roth T. Daytime alertness in patients with chronic insomnia compared with asymptomatic control subjects. Sleep 1988;11:54-60
  166. Buysse DJ, Ancoli-Israel S, Edinger JD, Lichstein KL, Morin CM. Recommendations for a standard research assessment of insomnia. Sleep 2006;29:1155-1173
  167. Mullington J, Korth C, Hermann DM, et al. Dose-dependent effects of endotoxin on human sleep. Am J Physiol Regul Integr Comp Physiol 2000;278:R947-955


Aldosterone Deficiency and Resistance

ABSTRACT


Aldosterone is crucial for regulating sodium conservation in the kidney, salivary glands, sweat glands, and colon. This adrenal steroid hormone acts via the mineralocorticoid receptor (MR) to promote active transport of sodium and potassium excretion in its target tissues, through activation of specific amiloride-sensitive sodium channels (ENaC) and a Na-K ATP-ase pump. Defective aldosterone biosynthesis or action results in various clinical and laboratory test manifestations, such as hypotension, hyponatremia, hyperkalemia, and acidosis. Primary adrenal insufficiency and congenital adrenal hypoplasia are discussed in other chapters. In this chapter the mechanisms underlying aldosterone-deficient conditions, such as hyporeninemic hypoaldosteronism, primary hypoaldosteronism, including aldosterone synthase deficiency (ASD), acquired forms of the disease, and pseudohypoaldosteronism, an aldosterone resistance syndrome due to insensitivity of target tissues to aldosterone, are reviewed. 

INTRODUCTION

Aldosterone is crucial for sodium conservation in the kidney, salivary glands, sweat glands, and colon. Aldosterone is synthesized exclusively in the zona glomerulosa of the adrenal gland. Destruction or dysfunction of the adrenal gland in conditions such as primary adrenal insufficiency, congenital adrenal hypoplasia, isolated mineralocorticoid deficiency, acquired secondary aldosterone deficiency (hyporeninemic hypoaldosteronism), acquired primary aldosterone deficiency, and inherited enzymatic defects in aldosterone biosynthesis cause clinical symptoms and laboratory characteristics owing to aldosterone deficiency. Pseudohypoaldosteronism is an aldosterone resistance syndrome i.e. a condition due to the insensitivity of target tissues to aldosterone. In this chapter, aldosterone-deficiency conditions other than primary adrenal insufficiency and congenital adrenal hypoplasia are reviewed.

ALDOSTERONE BIOSYNSTHESIS

All human steroid hormones are derived from cholesterol. Aldosterone is synthesized in the zona glomerulosa of the adrenal cortex through four enzymes, cholesterol desmolase (CYP11A1), 21-hydroxylase (CYP21A2), aldosterone synthase (CYP11B2), and 3β-hydroxysteroid dehydrogenase (3β-HSD) (Figure 1). CYP11A1, CYP21A2 and CYP11B2 are cytochrome 450 enzymes (CYP), which are membrane-bound, heme-containing enzymes that accept electrons from NADPH through accessory proteins and use molecular oxygen to perform hydroxylation or other oxidative conversions (1). CYP11A1, which is a side-chain cleavage enzyme, cleaves the side chain from C21 of cholesterol, converting cholesterol to pregnenolone in adrenal mitochondria and this is the first step in steroidogenesis. The CYP11A1 gene is located on the long arm of human chromosome 15q24-q25 (2). Pregnenolone is returned to the cytosolic compartment and is converted to progesterone by 3β-HSD. Progesterone is then hydroxylated at C21 by CYP21A2, an enzyme located in the smooth endoplasmic reticulum, to yield deoxycorticosterone (DOC). The CYP21A2 gene is located on the short arm of human chromosome 6 (3). Only CYP21A2 is active in humans, the other, CYP21A1P is a pseudogene (4). CYP11B1, which is a mitochondrial enzyme, catalyzes β-hydroxylation at C11 and converts DOC to corticosterone. The terminal two steps in the conversion of corticosterone to aldosterone (18-hydroxylation and 18-methyloxidation) are catalyzed by CYP11B2 (aldosterone synthase) (5) which was previously named corticosterone 18-hydroxylase/18-methyloxidase (CMO I/CMO II) or 18-hydroxylase/isomerase. These two steps previously proposed to be catalyzed by separate enzyme, CMO 1 and II, are known to involve only one enzyme substrate interaction, aldosterone synthase encoded by CYP11B2 gene (6). The CYP11B1 and CYP11B2 genes are located on the long arm of chromosome 8 and the amino acid sequence of CYP11B2 shares more than 90% homology with that of CYP11B1 (7). In humans, the expression of CYP11B1 and CYP11B2 in the adrenal glands is spatially separated. While expression of CYP11B1 takes place in the zona reticularis/fasciculata, CYP11B2 expression and aldosterone synthesis are restricted to the zona glomerulus (8).

Figure 1. Aldosterone Biosynthesis. Aldosterone is derived from cholesterol. Biosynthetic pathway of aldosterone and structure of adrenal steroids and their biosynthetic precursors are shown in the figure. The enzymes that catalyze each step are listed in the adjacent box at the right side of the figure.

Epigenetic Regulation Of Cyp11b2 Expression

CYP11B2 gene expression is epigenetically controlled. DNA methylation at CpG dinucleotides alter gene expression by affecting transcription factor binding activity (9). Cyclic AMP responsive element binding protein 1 (CREB 1) /ATF family members and nuclear receptor subfamily 4, group A (NR4A) members bind the CYP11B2 promoter at Ad1  (cAMP response element at -71/-64) and Ad5 (cAMP response element at -129/-114), respectively, leading to activation of transcription. DNA methylation at CpG1 greatly decreased CREB 1 binding to Ad1 in the promoter lesion of CYP11B2  gene (10). In addition, DNA methylation at CpG2 reduced basal binding activities of NR4A1 and NR4A2 with Ad5 by 30% and 50%, respectivly (10). Ang II infusion in the rat decreased the methylation ratio of CYP11B2 gene  and increased gene expression in the adrenal gland (10). A low-salt diet induced hypomethylation of rat CYP11B2 and increased CYP11B2 mRNA levels parallel with aldosterone synthesis (10).

REGULATION OF ALDOSTERONE SECRETION

Aldosterone secretion is regulated by multiple factors. The renin-angiotensin system and potassium ion are the major regulators, whereas ACTH and other POMC peptides, sodium ion, vasopressin, dopamine, ANP, β-adrenergic agents, serotonin and somatostatin are minor modulators.

The Renin-Angiotensin System

Renin is a 430 amino acid enzyme that cleaves renin substrate or angiotensinogen, which is a 453 amino acid alpha-globulin product of the liver, to produce the decapeptide, angiotensin I. Angiotensin I is rapidly cleaved by angiotensin-converting enzyme (ACE) in the lung and other tissues to form the octapeptide, angiotensin II. Moreover, angiotensinase cleaves the NH2-terminal Asp residue from angiotensin II and produces the heptapeptide, angiotensin III, then to the hexapeptide angiotensin IV. The circulating levels of angiotensin III are 15 to 25% of those of angiotensin II. Angiotensin II, III and IV stimulate aldosterone secretion and vasoconstriction, while angiotensin II is more potent for vasoconstriction. The angiotensins are inactivated within minutes by tissue and plasma peptidase. The levels of the circulating renin are the rate-limiting factor in this process.

Renin is synthesized by the juxtaglomerular cells in the renal cortex and its secretion is controlled by renal arterial blood pressure, sodium concentrations of tubular fluid sensed by the macula densa, and renal sympathetic nervous activity (11). Factors that decrease renal blood flow, such as hemorrhage, dehydration, salt restriction, upright posture, and renal artery narrowing, increase renin levels. In contrast, factors that increase blood pressure, such as high salt intake, peripheral vasoconstrictors, and supine posture, decrease renin levels. Hypokalemia increases and hyperkalemia decreases renin release.

The effect of angiotensin II and III on the adrenal glomerulosa is initiated by binding to G-protein coupled receptors. The first mechanism of the intracellular signal transduction is activation of phospholipase C, which hydrolyzes PIP2 to IP3, which then releases intracellular calcium ions (12). Interestingly, angiotensin II does not stimulate adenylate cyclase activity. Angiotensin II stimulation leads to increased transfer of cholesterol to the inner mitochondrial membrane and increased conversion of cholesterol to pregnenolone and corticosterone to aldosterone (13).

Potassium

Potassium directly increases aldosterone secretion by the adrenal cortex and aldosterone then lowers serum potassium by stimulating its excretion by the kidney. High dietary potassium intake increases plasma aldosterone and enhances the aldosterone response to a subsequent potassium or angiotensin II infusion (12). The primary action of potassium for stimulating aldosterone secretion is to depolarize the plasma membrane, which activates voltage-dependent calcium channels, that permit influx or efflux of extracellular calcium (12–14), leading to the activation of calmodulin and calmodulin-dependent kinase, subsequently. The activated kinase phosphorylates both activating transcription factor and members of CRE-binding protein family which bind to 5’ flanking promotor regions of the CYP11B2 gene and trigger gene transcription in the zona glomerulosa, followed by increased aldosterone biosynthesis (13,14).

Pituitary Factors

ACTH and possibly other POMC-derived peptides, including α-MSH, α-MSH, β-LPH, and β-END, influence aldosterone secretion, however, the role of ACTH in aldosterone secretion is minor (12). ACTH increases aldosterone secretion by binding to glomerulosa cell-surface melanocortin-2 receptor, by activating adenylate cyclase, and increasing intracellular cAMP (15). Like other agents, ACTH stimulates the same two early and late steps of aldosterone biosynthesis.

Vasopressin has a modest and transient stimulatory effect on aldosterone secretion from zona granulosa cells in vitro. This effect is probably mediated via V2 receptors and phospholipase C generating IP3 and diacylglycerol (16).

Sodium

Sodium intake influences aldosterone secretion by an indirect effect through renin and to a minor extent by direct effects on zona glomerulosa responsiveness to angiotensin II. High sodium intake increases vascular volume, which suppresses renin secretion and angiotensin II generation and decreases the sensitivity of aldosterone response to angiotensin II.

Inhibitory Agents

Dopamine inhibits aldosterone secretion in humans by a mechanism that is independent of the effects of prolactin, ACTH, electrolytes, and the renin-angiotensin system (17,18). This inhibitory effect may involve binding to D2 receptors on glomerulosa cells (19). Atrial natriuretic peptide (ANP) directly inhibits aldosterone secretion and blocks the stimulatory effects of angiotensin II, potassium and ACTH, at least in part, by interfering with extracellular calcium influx (20).

MECHANISMS OF ALDOSTERONE ACTION

Effect of Aldosterone

Aldosterone is crucial for sodium conservation in the kidney, salivary glands, sweat glands, and colon. Aldosterone promotes active sodium transport and excretion of potassium in its major target tissues. It exerts its effects via the mineralocorticoid receptor (MR) and the resultant activation of specific amiloride-sensitive sodium channels (ENaC) and the Na-K ATP-ase pump (21). Aldosterone and the MR may be involved in the regulation of genes coding for the subunits of the amiloride sensitive sodium channel and the Na-K ATP-ase pump, serum and glucocorticoid regulated kinase (SGK), channel-inducing factor, as well as of other proteins (22,23). Activated SGK1 phosphorylates the neural precursor cell-expressed, developmentally down-regulated protein 4-2 (Nedd4-2) which allows binding of 14-3-3 proteins (24). Then, the interaction of Nedd4-2 and ENaC causes an accumulation of ENaC at the plasma membrane and enhances epithelial sodium transport by increasing open probability of ENaC. In a later phase translation and allocation of ENaC, basolateral Na-K ATP-ase and apical K channel (ROMK) are enhanced in its target tissues (25–27).

On the other hand, rapid effects in response to aldosterone but independent of the MR were described as so-called non-genomic or rapid signaling of aldosterone. The G protein-coupled estrogen receptor (GPER) [previously known as G protein-coupled receptor 30 (GPR30)], a member of the seven transmembrane domain family of cell surface receptors, has been reported to be a membrane receptor for aldosterone (28). The expression of GPER is ubiquitous, including in vascular cells (both endothelial cells and smooth muscle cells) and is required for rapid MR-independent effects of aldosterone in vascular smooth muscle cells (28). Aldosterone has both vasodilator and vasoconstrictor effects. The effect of aldosterone on endothelial function would vary depending on the balance between GPER and MR expression. In vascular endothelial cells, aldosterone activation of GPER mediates vasodilation, while activation of endothelial MR has been linked to enhanced vasoconstrictor and/or impaired vasodilator response (28–30).

Mineralocorticoid Receptor

The mineralocorticoid receptor (MR) is found in the cytoplasm and nucleus and the sodium channels are expressed in the apical membrane of epithelial cells of the distal convoluted tubule as well as in cells of other tissues involved with conservation of salt, such as colon, sweat glands, lung, and tongue. MR is a member of the nuclear receptor superfamily. Together with the glucocorticoid, progesterone, and androgen receptors, MR forms the steroid receptor subfamily (30). Steroid receptors display a modular structure comprised of five regions (A-E). The N-terminal A/B region harbors an autonomous activation function. The central C region, corresponding to the DNA-binding domain, is highly conserved and is composed of two zinc fingers involved in DNA binding and receptor dimerization. The D region is a hydrophilic region and it forms a hinge between DNA-binding domain and ligand-binding domain. The E region corresponds to the C-terminal ligand-binding domain and mediates numerous functions, including ligand binding, interaction with heat-shock proteins, dimerization, nuclear targeting, and hormone-dependent activation (31) (Figure 2). The human MR (hMR) and human glucocorticoid receptor (hGR) have almost identical DNA-binding domains (94% homology in the amino acid) and very similar ligand-binding domains (57%), but divergent N-terminal A/B regions (<15%) (32). The hMR gene was mapped on chromosome 4q31.1-31.2 (33,34) and hMR cDNA encodes a 107 kilodalton polypeptide with 984 amino acids (32). The hMR gene consists of 10 exons, including two exons 1 that encode different 5'-untranslated sequences (35). Expression of the two different hMR variants is under the control of two different promoters that contain no obvious TATA element, but multiple GC boxes. Both hMRα and hMRβ mRNAs are expressed at approximately the same level in the mineralocorticoid target tissues (36).

Figure 2. The linearized structures of the mineralocorticoid receptor gene, mRNAs and protein. The MR gene consists of 10 exons. The MR has two exons 1 (exon 1α and exon 1β), each with an alternative promoter; however, the finally translated MR protein is the same. Exons 1 are untranslated regions, exon 2 codes for the immunogenic domain (A/B), exons 3 and 4 for the DNA-binding domain (C), and exons 5-9 for the hinge region (D) and the ligand-binding domain (E) (37)

Molecular and Cellular Mechanisms of the Aldosterone Action

MRs in its unliganded state is located in the cytoplasm, as part of hetero-oligomeric complexes containing heat shock proteins 90, 70 and 50 (38). Upon binding with their ligand, the receptor-ligand complex dissociates from the heat shock proteins, homo- or heterodimerizes and translocates into the nucleus. Homodimers or heterodimers of the MR interact with hormone-responsive elements (HRE) and/or other transcription factors in the promoter regions of target genes, including the subunits of the ENaC or other proteins related to this channel and sodium transport in general, and modulates the transcription rates of these genes (39) (Figure 3).

Figure 3. Mechanism of aldosterone action on sodium reabsorption at the distal convoluted tubule of the nephron. Aldosterone binds to the MR, which is located in the cytoplasm in complex with heat shock proteins 90, 70 and 50. After binding, the receptor-ligand complex translocates into the nucleus, binds to hormone-responsive elements (HRE) of target genes where it modulates their transcription rate. Amiloride-sensitive sodium channel (ENaC) subunits or other related proteins may be targets of such regulation (40).

Pre-Receptor Regulation

Since cortisol circulates at plasma concentrations several orders of magnitude higher than those of aldosterone does, and since it has a high affinity for the MR, it would be expected to overwhelm this receptor in mineralocorticoid target tissues and cause mineralocorticoid excess. A local enzyme, 11β-hydroxysteroid dehydrogenase type 2 (11β-HSD2), however, converts active cortisol to inactive cortisone, and protects the MRs from the effects of cortisol (40) 11β-HSD catalyzes the inter-conversion of hormonally active C11-hydroxylated corticosteroids (cortisol in humans or corticosterone in rodents) and their inactive C11-keto metabolites (cortisone in humans or 11-dehydrocorticosterone in rodents). Two isozymes of 11β-HSD have been identified, 11β-HSD type 1 (11β-HSD1) and 11β-HSD2, which differ in their biological properties and tissue distributions. 11β-HSD2, a potent NAD-dependent 11β-hydrogenase, rapidly inactivates glucocorticoids. The human 11β-HSD2 gene encodes 405 amino acids and its molecular weight is approximately 40-kilodalton (41). 11β-HSD2 has a hydrophilic N-terminal domain that is thought to anchor the protein into membranes (42). 11β-HSD2 is localized as a dimer in the nucleus and cytoplasm of cells of the cortical collecting duct and colon (42,43). Prednisolone and prednisone are substrates for both 11β-HSD isozymes (44,45) and dexamethasone is metabolized slightly by 11β-HSD2 (46). Licorice derivatives, such as glycyrrhizic acid, and the hemisuccinate derivative carbenoxolone are inhibitors of 11β-HSD2. Inhibition of 11β-HSD2 with such agents, confers mineralocorticoid potency to physiologic concentrations of endogenous glucocorticoids in the kidney and colon (47). Thus, in normal physiology, 11β-HSD2 protects the MR by converting cortisol to the inactive cortisone and allows aldosterone-selective access to the inherently nonselective MR in mineralocorticoid target tissues.

Amiloride-Sensitive Sodium Channel (Epithelial Sodium Channel; ENaC)

The cDNA of the α-subunit of the ENaC (αENaC) was cloned from the rat colon in 1993 (48) and soon after the cDNAs of the β- and γ-subunits of this channel were cloned for the same species (49). The human α-, β- and γ-subunits of ENaC were also cloned (50,51). In vitro studies demonstrated that the α subunit of the ENaC itself had the majority of Na channel function, while, the β- and γ- subunits alone were not shown to play as major a role in sodium transport (48). However, the β- and γ-subunits enhanced the function of the α-subunit and all subunits are required for full ENaC activity (52). It appears then that this channel consists of the α-, β- and γ-subunits and an amiloride-binding protein (Figure 4). Aldosterone increases transcription of αENaC but not β- and γ-subunits, resulting enhanced channel assembly and transported from endoplasmic reticulum to Golgi (53). In Golgi, furin proteolytically cleaves specific sites in the extracellular domains of α- and γ-ENaC, resulting in channel activation. At the cell surface, Nedd4-2 binds to ENaC, increasing endocytosis and degeneration (54).The proline-rich region of the C-terminal of the αENaC is important for binding to α-spectrin and for stabilization of the sodium channel in the membrane (55). Recently, several studies demonstrated abnormalities of the β- and γ-subunits of the ENaC in patients with Liddle's syndrome, characterized by mineralocorticoid excess (hypertension and hypokalemic alkalosis), and suppressed aldosterone secretion (56–59). The truncation caused by these mutations influenced the PY motif at the N-terminal of the molecule. This motif is responsible for the binding of the channel subunits with NEDD4, a carrier protein facilitating clearance of the channel (60). Moreover, a point mutation of the αENaC gene, located close to the N-terminal of the protein, was reported to cause a decrease of the probability of an open sodium channel, resulting in defective reabsorption (40,61).

The ENaC-Regulatory Complexes in Aldosterone-Mediated Sodium Transport

Aldosterone-induced trans-epithelial Na+ transport via ENaC involves the coordinate functioning of stimulatory signaling proteins such as serum- and glucocorticoid-induce kinase-1 (SGK1) (23,62), glucocorticoid-induced leucine zipper protein-1 (GILZ1) (63) and connector enhancer of kinase suppressor of Ras 3 (CNK3) (64), with inhibitory proteins, such as neural precursor cell expressed, developmentally downregulated protein (Nedd4-2) (24) and extracellular signal-regulated kinase (ERK) 1/2 (23,24,62,65).


SGK1 is an aldosterone-regulated protein kinase that stimulates renal ENaC through many mechanisms. First, SGK1 phosphorylates the E3 ubiquitin ligase and Nedd4-2, and inhibits its actions. Nedd4-2 interacts with the C-terminal tail of ENaC subunits, decrease surface expression of the channel via channel ubiquitinoylation (23,24,62). Second, SGK1 phosphorylates kinase with no lysine (WNK) 4 and prevents ENaC endocytosis (66). Third, SGK1 directly phosphorylates alpha ENaC and transforms silent ENaC channels to active ones (67). Then, SGK1 alters ENaC expression, trafficking and activity, and stimulates Na+ transport in the kidney cortical collecting duct (CCD) (68). However, SGK1 is a short-lived protein. Following synthesis, SGK1 is rapidly targeted to the endoplasmic reticulum (ER), where ER-associated ubiquitin ligases CHIP and HRD1 aid in its ubiquitinoylation and subsequent proteasome-mediated degradation (69). Another aldosterone-induced ENaC-regulator, GILZ, which protects SGK1 from rapid ER-associated degradation by controlling protein-protein interaction (53.6). In kidney CCD, GILZ1 is robustly induced by aldosterone (70). GILZ1 stimulates ENaC cell surface expression and activity at least in part by inhibiting ERK1/2, which abrogates ENaC function (65,71,72).

The recently identified MR target gene CNKSR3 (connector enhancer of kinase suppressor of Ras 3), commonly referred as CNK3, is highly expressed in the connecting tubule (CNT) and the CCD (73). CNK3, like SGK1 and GILZ1, is rapidly induced by physiological concentrations of aldosterone (64). CNK3 acts to assembly various ENaC-regulatory components in close vicinity of the channel and thereby exerts its stimulatory effects on channel function (74).

Epigenetic Control of  ENaC Transcription by Aldosterone-Sensitive Dot1A-Af9 Complex

Chromatin regulates gene transcription by the post-translational modification of histone N-terminal tails such as acetylation and methylation. The histone H3 Lys 79 methyltransferase disruptor of telomeric silencing alternative splice variant a (Dot1a) methylates histone H3 Lys79, which resides in the globular domain (75). ALL-1 fused gene from chromatin 9 (Af9), putative transcription factor, physically and functionally interact with Dot1a to form a nuclear repressor complex that directly or indirectly binds specific site of the alpha ENaC promoter. Aldosterone reduces the level of Af9 mRNA and protein. Then, Af9 overexpression induces hypermethylation of histone H3 Lys 79 and repression of alpha ENaC transcription (76). Aldosterone impairs the formation of Dot1a -Af9 complex associated with alpha ENaC promoter by 1) decreasing abundance of Dot1a and Af9; 2) attenuating the interaction between Dot1a and Af9 via Sgk-1-catalyzed phosphorylation of Af9 at Ser 435; 3) counterbalancing the repression through binding to mineralocorticoid receptor (MR) and facilitating its translocation into the cell nucleus, where MR and Dot1a compete for binding to Af9.  These are aldosterone-dependent and -independent mechanisms for Dot1a-Af9-mediated repression of alpha ENaC transcription. While aldosterone -independent de-repression achieved through the action of ALL-1 fused gene from chromatin 17 (Af17), Af17 upregulates alpha ENaC transcription by decreasing Af9 binding to Dot1a and relieving Dot1a-Af9-mediated repression of ENaC (77). 4) SGK1 phosphorylates Af9, thus, down-regulating Dot1a-Af9 complex, and relieving the basal repression on alpha ENaC transcription (67,78).

Figure 4. Model of a putative amiloride-sensitive sodium channel (ENaC). The amiloride-sensitive sodium channel appears to consist of the α-, β- and γ- subunits and an amiloride-binding protein. This channel is located at the apical site of the renal epithelium and plays a role in passive sodium transport, which is mainly regulated by mineralocorticoids (79).

THE RENIN-ANGIOTENSIN-ALDOSTERONE SYSTEM IN NEWBORNS AND INFANTS                

Aldosterone secretion rate of newborns and infants was similar to that of older children and adults. Therefore, the aldosterone secretion rate corrected by body surface was much higher in infancy than later in life (80). Urinary aldosterone at birth depends on gestational age and increases progressively, concurrently with the levels of plasma aldosterone. Plasma renin activity, plasma aldosterone and urinary excretion rate of aldosterone decrease with age (81). At  birth, human kidneys display tubular immaturity leading to sodium wasting and impaired ability to reabsorb water. Past studies showed that plasma potassium concentrations were significantly higher in newborns than in their respective mothers, while neonatal and maternal plasma sodium concentrations were closely related. Aldosterone and renin levels in newborns differs significantly from the corresponding maternal concentrations (82). The aldosterone-renin ratio significantly increases with gestational age. Thus, neonatal partial aldosterone resistance was previously suggested because of the high urinary sodium loss in the presence of hyperactivity of the renin-angiotensin-aldosterone system (83). Previous study found that the highest aldosterone levels detected in the cord blood originated from de novo synthesis by the fetal adrenal glands (84). In addition, neonatal aldosterone resistance was associated with weak or undetectable renal MR expression at birth. MR mRNA is transiently expressed between 15 and 24 weeks of gestation, but it is undetectable in late gestational age and neonatal kidney (85). 11 beta-hydroxysteroid dehydrogenase type 2 (11 beta HSD2) and alpha ENaC are closely correlated with cyclic MR expression.

CLASSIFICATION OF HYPOALDOSTERONISM

Various syndromes are characterized by or associated with hypoaldosteronism. Hypoaldosteronism is classified in three large categories, defective stimulation of aldosterone secretion, primary defects in adrenal synthesis or secretion of aldosterone, and aldosterone resistance, according to their pathophysiology and summarized in Table 1.

Table 1. Causes of Hypoaldosteronism and Hormonal Profiles

Causes of Hypoaldosteronism

Hormonal Profiles

DEFECTIVE STIMULATION OF ALDOSTERONE

v  Congenital keep tablehyporeninemic hypoaldosteronism

v  Acquired hyporeninemic hypoaldosteronism

Ø Associated with diabetes mellitus

Ø Associated with nephropathy

Ø Glomerulonephritis

Ø Gouty nephritis

Ø Pyelonephritis

Ø Nephropathy associated with multiple myeloma

Ø Nephropathy associated with systemic lupus erythematosa

Ø Mixed cryoglobulinemia

Ø Nephrolithiasis

Ø Analgesic nephropathy

Ø Renal amyloidosis

Ø Iga nephropathy

v  Associated with autonomic insufficiency

v  Associated with liver cirrhosis

v  Associated with sickle cell anemia

v  Associated with acquired immune deficiency syndrome

v  Associated with polyneuropathy, organomegaly, endocrinopathy, m protein and skin changes syndrome

v  Lead poisning

v  Excess sodium bicarbonate

v  Sjogren's syndrome

v  Drugs interfering with renin production

Ø Β-blocker

Ø Prostaglandin synthetase inhibitors

Ø Non-steroidal anti-inflammatory drugs

Ø Calcium channel blocker

v  Other drugs

Ø Cyclosporin a

Ø Mitomycin c

Ø Cosyntropin

Low plasma renin;

Low plasma and urinary aldosterone

Drugs interfering with angiotensin ii production

Ø  Angiotensin ii converting enzyme inhibitors

High plasma renin; low plasma aldosterone; low angiotensin ii

PRIMARY DEFECTS IN ADRENAL SECRETION OF ALDOSTERONE

Combined with defective cortisol synthesis

a) Congenital causes

Ø Congenital adrenal hypoplasia (dax-1 mutation)

Ø Congenital adrenal hyperplasia

§  Cholesterol desmolase deficiency (lipoid adrenal hyperplasia)

§  3β-hydroxysteroid dehydrogenase deficiency

§  21-hydroxylase deficiency

§  11β-hydroxylase deficiency


Adrenoleukodystrophy, adrenomyeloneuropathy

Low plasma renin; low plasma aldosterone; low plasma cortisol


High plasma deoxycorticosteorne

b) Acquired causes

Ø  Autoimmune adrenal destruction

·       Addison's disease

·       Multiple autoimmune endocrinopathy

Ø  Infectious adrenal destruction

·       Bacterial infection

·       Fungal infection

Ø  Infiltration of adrenal glands

·       Amyloidosis

·       Hemochromatosis

·       Sarcoidosis

·       Metastatic or infiltrative malignant disease

Ø  Bilateral adrenalectomy

Ø  Drug induced

§  Mitotane

§  Aminoglutethimide

§  Torilostane

§  Ketoconazole

Low plasma renin; low plasma aldosterone; low plasma cortisol

v  Isolated deficiency of aldosterone secretion

Ø Congenital causes

§  Cyp11b2 (aldosterone syntase) deficiency

¨     Corticosterone methyloxidase type i (cmo i) deficiency


¨     Corticosterone methyloxidase type ii (cmo ii) deficiency

¨      

High plasma renin; low plasma aldosterone


Normal plasma 18-hydroxycorticosterone/aldosterone ratio

High plasma 18-hydroxycorticosterone/aldosterone ratio

Ø Acquired causes

§  Critically ill patients associated with hypotension or hypovolemia

¨     Sepsis

¨     Pneumonia

¨     Peritonitis

¨     Cholangitis

¨     Liver failure

·       After removal of mineralocorticoid secreting adrenal tumor

·       Discontinuation of agents with mineralocorticod activity

·       Heparin or chlorbutol administration


Low plasma aldosterone concentration; inappropriate elevated plasma renin

DEFECTIVE ALDOSTERONE ACTION

v  Pseudohypoaldosteronism (pha) type 1

Ø Renal (autosomal dominant pha)

Ø Systemic pha (autosomal recessive pha)

v  Secondary pseudohypoaldosteronism

§  Associated with urinary tract infection

§  Associated with medication that blocks epithelial sodium channel (enac)

¨     Amiloride

¨     Triamterene

¨     Trimethoprim

¨     Pentamidine

§  Administration of aldosterone antagonists

¨     Spironolactone

¨     Progesterone

¨     17-hydroxyprogesterone

¨     Synthetic progestin

§  Drugs that may lead to aldosterone resistance

                Caludinerin inhibitor (cyclosporin a, tacrolimus)

High plasma renin; high plasma and urinary aldosterone


Defective Stimulation of Aldosterone

The first category of conditions, which is characterized by defective stimulation of aldosterone secretion, includes the syndromes of congenital and acquired hyporeninemic hypoaldosteronism. One of these conditions is due to a defect of renin secretion such as hyporeninemia resulting from β-blockers, prostaglandin synthetase inhibitors, and calcium channel blockers. Another condition is due to decrease in the conversion of angiotensin I to angiotensin II mediated by converting enzyme inhibitor medications and is associated with hyperreninemia.

Primary Defects in Adrenal Biosynthesis or Secretion of Aldosterone

The second category of conditions, which are characterized by primary defects in adrenal synthesis or secretion of aldosterone, includes all causes of primary adrenal insufficiency and primary hypoaldosteronism caused by aldosterone synthase (CYP11B2) deficiency or as an acquired state. Primary adrenal insufficiency causes include congenital adrenal hypoplasia, congenital adrenal hyperplasia, adrenoleukodystrophy/ adrenomyeloneuropathy, acquired adrenal insufficiency due to autoimmune, infectious and infiltrative disease, bilateral adrenalectomy and use of adrenolytic agents and enzyme inhibitors that block cortisol and aldosterone biosynthesis. These conditions are usually combined with defective cortisol synthesis. Aldosterone synthase (CYP11B2) deficiency (ASD) leads to reduced aldosterone production associated with low or high levels of 18-hydroxycorticosterone, referred to as CMO I or CMO II deficiency, respectively. Several conditions may be associated with aldosterone biosynthetic activity. Heparin suppresses aldosterone synthesis. Critically ill patients with persistent hypovolemia and hypotension also have inappropriately low plasma aldosterone concentrations in relation to the activity of the renin-angiotensin system. Isolated primary hypoaldosteronism in occasionally associated with metastatic cancer of the adrenal gland.

Defective Aldosterone Actions

The third category which is characterized by defective aldosterone action includes syndromes of aldosterone resistance such as pseudohypoaldosteronism type 1 and sodium-wasting states resulting from excessive amounts of circulating mineralocorticoid antagonists, such as spironolactone and its analogues, and synthetic progestin or natural agonists, such as progesterone or 17-hydroxyprogesterone. These mineralocorticoid antagonists may antagonize aldosterone at the levels of mineralocorticoid receptor (86) and frequently, these states are compensated for by elevated concentrations of plasma aldosterone.

HYPORENINEMIC HYPOALDOSTERONISM

The most common form of isolated hypoaldosteronism is caused by impaired renin release from the kidney. Hudson et al. first described this syndrome in 1957 (87), however, hyporeninemia was first recognized in 1972 (88) (89). The typical patient is 50 to 70 years old and usually presents with chronic and asymptomatic hyperkalemia and mild to moderate renal insufficiency with a 40-70% decrease in the glomerular filtration rate when compared to that of age matched healthy subjects. Hyperchloremic metabolic acidosis is seen in approximately half of the patients. This acidosis is classified as a renal tubular acidosis type IV (90). The acidosis is a consequence of decreased renal ammonia neogenesis, reduced hydrogen ion-secretory capacity in the distal nephron, and mild reduction in the proximal tubular threshold for bicarbonate reabsorption. Occasionally, muscle weakness or cardiac arrhythmias are present in some patients. More than a half of the patients have diabetes mellitus (91). Other frequently associated states include autonomic neuropathy, hypotension, and various nephropathies such as glomerulonephritis, gouty nephropathy, and pyelonephritis. Also, this syndrome is associated with nephropathies associated with multiple myeloma and systemic lupus erythematosus, mixed cryoglobulinemia, nephrolithiasis, analgesic nephropathy, renal amyloidosis, IgA nephropathy, cirrhosis, sickle cell anemia, acquired immune deficiency syndrome (AIDS), polyneuropathy, organomegaly, endocrinopathy, M protein and skin changes (POEMS) syndrome, lead poisoning, excess sodium bicarbonate, and Sjogren’s syndrome (90,92–101) . Moreover, this syndrome occurs transiently in association with use of non-steroidal anti-inflammatory drugs, cyclosporin A, mitomycin C, cosyntropin, and other agents in susceptible individuals (102–104).

Pathophysiology

Urinary aldosterone excretion is low under basal conditions and fails to increase after sodium restriction. Plasma renin activity is also low and does not increase appropriately during sodium restriction, periods of prolonged upright posture, or diuretic administration (88). Interstitial renal disease and damage to the juxtaglomerular apparatus seems the most likely cause for the primary defect in renin generation or release and secondary deficiency of aldosterone. However, in some patients with this syndrome there is an absent or blunted aldosterone response to angiotensin II (94,104), suggesting a coexisting primary defect in aldosterone secretion or it reflects atrophy of the zona glomerulosa caused by chronic renin deficiency.

There are various mechanisms to be explained for the hyporeninemia. First possible mechanism is the hypervolemia. The expanded extracellular fluid volume due to hypertension may suppress renin. In fact, long-term sodium restriction and diuretic administration increase plasma renin activity in these patients, however, the increments of plasma renin activity are less than those of normal subjects (97). A second possible mechanism is insufficiency of the autonomic nervous system, particularly in patients with diabetic neuropathy. Impaired adrenergic response to postural change may contribute to insufficient renin release. Besides, these patients exhibit decreased sensitivity to β-adrenergic agonists, suggesting defects in both production and action of catecholamines (96). A third proposed mechanism is secretion of abnormal forms of renin, such as a defect in the conversion of prorenin to renin. Insufficiency of autonomic nervous system may be associated with impaired conversion of prorenin to renin. Indeed, patients with diabetes mellitus and autonomic neuropathy have elevated plasma levels of prorenin (105). A fourth possibility is prostaglandin deficiency. Production of prostaglandin I2 (prostacyclin), which mediates renin release, is apparently diminished in patients with hyporeninemic hypoaldosteronism as assessed by measurement of the stable urinary metabolite 6-keto-prostaglandin F1α (95). Furthermore, the prostaglandin I2 in these patients was unresponsive to the potent stimulator’s norepinephrine and calcium. Prostaglandin I2 deficiency may cause hyporeninemic hypoaldosteronism by causing defects in the conversion of prorenin to renin and renin release (106).

Diagnosis

The diagnosis of hyporeninemic hypoaldosteronism must be considered in any patient with unexplained hyperkalemia. Excess potassium intake from food or drugs does not cause sustained hyperkalemia, if renal function is normal. Renal function should be evaluated and drugs that impair renal potassium excretion should be excluded as a cause. The clinical diagnosis is confirmed by low plasma renin activity and low plasma concentrations or urinary aldosterone excretion under conditions that activate the renin-angiotensin-aldosterone axis by maintenance of upright posture and/or furosemide administration. A low random plasma renin concentration associated with a normal ratio of aldosterone to plasma renin activity is also useful for the diagnosis (94).

Therapy

The therapeutic approach should be chosen after taking into consideration the age of the patients and other concurrent disorders. Only monitoring potassium concentrations is enough for patients with moderate hyperkalemia and without electro-cardiographic changes. Drugs that promote hyperkalemia, such as β-adrenergic antagonists, cyclooxygenase inhibitors, angiotensin-converting enzyme inhibitors, heparin, and potassium-sparing diuretics, should be avoided. Dietary potassium intake should be reduced, if possible. Diuretics are the initial treatment for patients who have disorders associated with sodium retention, such as hypertension and congestive heart failure. Mineralocorticoid replacement with fludrocortisone is reserved for patients with severe hyperkalemia without hypertension and congestive heart failure.

PRIMARY HYPOALDOSTERONISM- ALDOSTERONE SYNTHASE DEFICIENCY (ASD)

Congenital hypoaldosteronism is a rare inherited disorder transmitted as either an autosomal recessive or autosomal dominant trait with mixed penetrance. This disorder was previously termed "corticosterone methyloxidase (CMO)” deficiency and subdivided into two types according to the relative levels of aldosterone and its precursors in an affected person. Patients with "corticosterone methyloxidase I (CMO I)" deficiency have elevated serum levels of corticosterone and low levels of 18-hydroxycorticosterone and aldosterone. In contrast, patients with "corticosterone methyloxidase II (CMO II)" deficiency have high levels of 18-hydroxycorticosterone, the immediate precursor of aldosterone (107). With greater understanding of structure-activity relationships in the CYP11B2 enzyme, this disorder may be better considered a spectrum of hormonal deficiencies, depending on the nature of the CYP11B2 gene defect (108). Two steps of aldosterone biosynthesis from corticosterone previously proposed to be catalyzed by separate enzymes, CMO I and II, previously, are known to involve only one enzyme substrate interaction (6). Isolated aldosterone deficiency results from loss of activity of aldosterone synthase encoded by CYP11B2 gene (109–118). Therefore, the term aldosterone synthase deficiency type 1 (ASD1) and type 2 (ASD2) reflects more appropriately the molecular basis of this disease. In both ASD1 and 2, glomerulosa zone corticosterone is increased and aldosterone decreased, but 18-hydroxycorticosterone is increased in ASD2 (108).  ASD1 is associated with loss of both 18-hydroxilation and 18-oxidation enzyme activities. In ASD2, the ability to convert corticosterone (B) to 18-hydorxytetrahydro11-dehydrocorticosterone (18-OH-B) is preserved with failure of further oxidation of 18-hhdroxicorticosrerone to aldosterone (119). The deficiency of aldosterone is much more severe in ASD1. In contrast, aldosterone may reach normal levels under intense stimulation of renin-angiotensin system in ASD2 (108). The clinical presentations of these deficiencies are otherwise similar.

Clinical Presentation

The clinical presentation is typical of aldosterone deficiency, including electrolyte abnormalities such as a variable degree of hyponatremia, hyperkalemia and metabolic acidosis, with poor growth in childhood, but there are usually no symptoms in adults (107,120). Miao et al. reviewed 45 ASD patients (20 of ASD1, 12 of ASD2, 13 of undefined subtype) (121).  From their review, 95% of the patients having ASD1 and all of having ASD2 and an undefined subtype had hyponatremia, while 89% showed hyperkalemia. In infants, it is characterized by recurrent dehydration, salt wasting and failure to thrive. These symptoms are present generally within the first 3 months of life, and most often after the first 5 days of life. A modest uremia with a normal creatinine level reflects dehydration in the presence of intrinsically normal renal function. Plasma renin activity might vary, while elevated plasma renin activity levels were more likely to be found in the ASD1 (121).

Diagnosis and Therapy

The diagnosis can be established by measuring the appropriate corticosteroids or their major metabolic products, such as 11-deoxycorticosterone (DOC), corticosterone, 18-hydroxycorticosterone, 18-hydroxy-DOC, and aldosterone levels in plasma. The ratio of plasma 18-hydroxycorticosterone to plasma aldosterone differentiates the two disorders; it is less than 10 in ASD1 (CMO I deficiency) and more than 100 in ASD2 (CMO II deficiency) (121,122). Patients with ASD2 (CMO II deficiency) tend to have increased plasma cortisol levels that may result from increased adrenal sensitivity to ACTH induced by the increased plasma angiotensin II levels in response to sodium depletion (123).

Both forms of the syndrome are treated by replacement of mineralocorticoid with the usual dosage of fludrocortisone (0.1-0.3 mg/ day). Almost infants and children require oral sodium supplementation (2 g/day as NaCl alone or in combination with NaHCO3), although some infants with severe symptom need intravenous fluids. Oral sodium supplementation may be discontinued once plasma rennin activity has decreased to normal, but mineralocorticoid replacement is usually maintained through childhood.

Molecular Mechanism of CYP11B2 Deficiency

ASD has been identified in Jews of European, North American, and Iranian descent (119). In Asians, it was reported in the Thai (124), Indian (124), Japanese (125) and Chinese populations (120,126).

To date, approximately 40 mutations, such as missense and nonsense mutations, splicing mutations, small insertions/deletions, gross deletions, and complex rearrangements, in the CYP11B2 have been reported in cases of ASD; the most common mutations were missense and nonsense (121). Some variants, such as p.Q170X, p.E198D, c.1398+2T>A, p. F233fsX*295, p.L462R, p.Q337X and p.Q272W, were identified in patients without an ASD classification subtype (121). A majority of mutations led to complete loss of enzyme activity, while in some mutations, such as V386A and R181W, double homozygosity was required for clinical phenotype (112,113,121).

Some patients with ASD1 (CMO I deficiency) have a homozygous 5 nucleotide deletion in exon 1 which leads to a frameshift and premature stop codon, resulting in the complete lack of enzyme production (109,110). A male Caucasian patient with ASD1 (CMO I deficiency) had a homozygous point mutation causing a R384P substitution, resulting in complete loss of 11 β- and 18-hydroxylase activity (111) (Figure 5). This suggests that the arginine-384 in aldosterone synthase is highly conserved and apparently quite important for enzyme activity.

A male infant of Turkish parents who presented with ASD1 had a homozygous missense mutation (L451F) in exon 8 of CYP11B2 gene. The L451F mutant protein in vitro showed complete aldosterone deficiency with 11-deoxycirticosterone or corticosterone as substrates. The L451F mutation located immediately adjacent to the highly conserved heme-binding C450 of the cytochrome P450 (117). Computer modeling of the molecule suggested that this substitute my lead a steric effect resulting in preventing the activity of CYP11B2 (117).

Three siblings of Pakistan origin who presented with ASD1 had a homozygous mutation (S308P) in exon 5 of CYP11B2 gene. The S308P mutant protein in vitro showed complete loss of enzyme activity. This mutated residue is likely to locate within the a-helix I, close to the heme-binding, active site of the enzyme. This structural change may be the cause of this disorder in this family (118). 

A large number of kindreds with ASD2 (CMO II deficiency) have been identified among Jews originally from Isfahan, Iran. Such patients are all homozygous for two mutations, R181W in exon 3 and V386A in exon 7 (109,112,113) (Figure 5). These mutations together reduce aldosterone synthase activity to 0.2 % of normal without affecting 11 β-hydroxylase activity (112,113). However, one non-Iranian patient with ASD2 (CMO II deficiency) carries mutations in the paternal allele, including V386A and T318A mutations, and maternal allele, including R181W and a deletion/frameshift mutation, resulting in complete loss of enzyme activity (113). This suggests that the high levels of 18-hydroxycorticosterone seen in ASD2 (CMO II deficiency) can be synthesized by CYP11B1, which has some 18-hydroxylase activity, and not by CYP11B2. A patient with apparent ASD 1 was homozygous for the mutations E198A and V386A, yet when assayed in vitro the double mutant enzyme behaved similarly to the mutant enzyme found in the Iranian Jewish ASD 2 patients (127). Thus, a difference in expression of CYP11B1 rather than allelic variation of CYP11B2 may be involved in the mechanism underlying the different levels of 18-hydroxycorticosterone between ASD1 and 2 (CMO I and CMO II deficiency). The distinction between ASD 1 and ASD 2 is not precise, and these disorders should be regarded as different degrees of severity on a continuous clinical spectrum.

 A male Japanese patient with ASD1 (CMO I) was a compound heterozygous for W56X in exon 1 and R384W in exon 7. W56X was inherited from his mother and R384X was from his father. Since both alleles contain nonsense mutations, a lack of CYP11B2 activity was speculated to cause his condition (125).

Two male Japanese patients with ASD2 (CMO II) had homozygous missense mutation (G435S) in the exon 8 of CYP11B2 gene. The expression studies indicated that the steroid 18-hydroxylase/oxidase activities of mutant enzyme were substantially reduced.

A female infant of Albanian origin with ASD2 (CMO II) revealed homozygosity for a pathogenic T185I mutation in Exon 3 of the CYP11B2 gene and two other homozygous polymorphisms F168F and K1738 in Exon3 (128). Both healthy parents revealed heterozygous for all three substitutions.

Another female Italian Caucasian patient was diagnosed with a compound heterozygous mutation located in exon 4 causing a premature stop codon (E255X) and a further mutation in exon 5, also causing a premature stop codon (Q272X). The patient’s CYP11B2 encoded two truncated forms of aldosterone synthase predicted to be inactive because they lack critical active site residues as well as the hormone-binding site. However, this case displays biochemical features intermediate between those of ASD1 and 2 (CMO I and II).

Some cases of ASD without causative mutations in CYP11B2 have also been reported (116,119).

Figure 5. Relative positions of CYP11B1 and CYP11B2 on chromosome 8 and mutations of CYP11B2. A, The relative positions of CYP11B1 and CYP11B2 on chromosome 8q22. Arrows indicate direction of transcription. B, Mutations of CYP11B2 in reported patients with CYP11B2 deficiency are summarized in the figure (109,121,126,128).

ACQUIRED FORMS OF PRIMARY HYPOALDOSTERONISM  

Several conditions may be associated with aldosterone biosynthetic defects. The administration of heparin causes natriuresis and hyperkalemia (129). Heparin preparations suppress aldosterone synthesis, leading to a compensatory rise in plasma renin activity. However, it has been demonstrated that this suppression of enzyme activity is attributable to chlorbutol (1,1,1-trichloro-2-methyl-2-propanol), the preservative used in commercial heparin, rather than to pure heparin (130).

Persistently hypotensive, critically ill patients with sepsis, pneumonia, peritonitis, cholangitis and liver failure, also have inappropriately low plasma aldosterone concentrations in relation to elevated plasma renin activity (131). The defect is at the level of the adrenal but has not been associated with any particular disease or therapy. Plasma cortisol levels are high, reflecting the stressed state. The response to angiotensin infusion is impaired, and the ratio of plasma 18-hydroxycorticosterone to aldosterone is increased, suggesting selective insufficiency of CMO II. It is possible that the hypoxia causes a relative zona glomerulosa insufficiency (132).

ALDOSTERONE RESISTANCE

Pseudohypoaldosteronism (PHA) Type 1

Mineralocorticoid resistance (pseudohypoaldosteronism type 1, PHA1) results from inability of aldosterone to exert its effect on its target tissues and was first reported by Cheek and Perry as a sporadic occurrence in 1958 (133). This disease, usually presents in infancy with severe salt-wasting and failure to thrive, accompanied by profound urinary sodium loss, severe hyponatremia, hyperkalemia, acidosis, hyperreninemia, and paradoxically markedly elevated plasma and urinary aldosterone concentrations. Usually, renal and adrenal functions are normal. This disease has been reported in over 70 patients (134). The prevalence, as estimated from recruitment through a genetic laboratory at the Hôpital Européen Georges Pompidou in France, which is a national reference center for a rare disease, is ~1 per 80,000 newborns (135)(136). Approximately one fifth of these cases are familial, and both an autosomal dominant and a recessive form of genetic transmission have been observed. A previous study found that all patients had renal tubular unresponsiveness to aldosterone, while some had involvement of other mineralocorticoid target-tissues, including the sweat and salivary glands, and the colonic epithelium, as well. Autosomal recessive PHA1 presents in the neonatal period with hyponatremia caused by multi-organ salt loss, including kidney, colon, and sweat and salivary glands. Autosomal recessive PHA1 persists into adulthood and shows no improvement over time. However, literature regarding follow-up of these patients after diagnosis is insufficient.  In contrast, autosomal dominant PHA1 is characterized by an isolated renal resistance to aldosterone, leading to renal salt loss. Particularly autosomal dominant form of PHA1 typically shows a gradual clinical improvement during childhood, allowing the cessation of sodium supplementation. 

PATHOPHYSIOLOGY

The mechanism(s) by which aldosterone controls sodium transport in its target tissues involves the mineralocorticoid receptor (MR) and proteins that are associated with the amiloride-sensitive sodium channel (ENaC). The latter proteins are expressed in the apical membrane of epithelial cells of the distal convoluted tubule and in the membranes of cells of other tissues involved in the conservation of salt, such as colon, sweat gland, lung and tongue. Thus, the MR and the ENaC were considered as potential candidate molecules for the pathogenesis of PHA1. In fact, mutations of α- and β-subunits of the ENaC were reported in PHA patients from autosomal recessive kindreds (61,137). Mutations of the MR were also reported in the patients with autosomal dominant PHA1 (138,139). However, no molecular defects were found in either MR or ENaC in some patients with PHA1, especially in those with the sporadic form PHA1, which suggests molecular heterogeneity in PHA1 (79,140–144).

DIAGNOSIS

Electrolyte profiles suggest mineralocorticoid deficiency or end-organ resistance, along with hyperkalemia, hyponatremia and metabolic acidosis associated with profound urinary salt loss. Renal and adrenal function is normal. The diagnosis is confirmed by the markedly elevated plasma aldosterone concentrations and plasma renin activity.

The differential diagnosis of PHA1 includes salt-wasting states due to hypoaldosteronism, including several forms of congenital adrenal hyperplasia, isolated hypoaldosteronism due to corticosterone methyloxidase (CMO) I and II deficiencies and congenital adrenal hypoplasia. Normal cortisol and excessive aldosterone responses to adrenocorticotropin (ACTH) are expected in patients with congenital PHA.

THERAPY         

The standard treatment of PHA has been replacement with high doses of salt, with a variable response among patients (134). Recently, carbenoxolone, an 11β-hydroxysteroid dehydrogenase inhibitor, was employed as therapy in PHA1 and an ameliorating effect was observed which was attributed to mediation by the MR (140). We studied a 17-yr-old male patient with congenital multifocal target-organ resistance to aldosterone. We examined his clinical response to carbenoxolone, expected to increase the intracellular level of cortisol in the kidney by preventing local conversion of cortisol to cortisone, and to high doses of fludrocortisone, a synthetic mineralocorticoid. Subsequently, and for a brief period of time, we administered dexamethasone, which has no intrinsic salt-retaining activity, in addition to carbenoxolone, to suppress endogenous cortisol, along with its intrinsic mineralocorticoid activity.

Figure 6. Effect of carbenoxolone, carbenoxolone plus dexamethasone, and fludrocortisone (top panel) on the serum sodium (middle panel) and potassium (bottom panel) concentrations of a patient with PHA. Carbenoxolone normalized plasma electrolytes, addition of dexamethasone reversed this effect, while fludrocortisone at high doses also normalized plasma electrolytes (140).

Carbenoxolone normalized the patient's serum electrolyte concentrations and decreased his urinary excretion of sodium within a week (Figure 6). Subsequent long-term therapy of this patient with carbenoxolone (450 mg/day p.o.) maintained his electrolyte concentrations within the normal range. His urinary 24 h free cortisol was increased during carbenoxolone therapy. Addition of dexamethasone suppressed his urinary free cortisol excretion and reversed the beneficial effect of carbenoxolone on serum and urinary electrolytes (Figure 6). These data suggest that an increase in urinary free cortisol observed during carbenoxolone therapy was due to a localized effect of this drug on the kidney rather than on tissues involved in the negative feedback effect of glucocorticoids. The effect of carbenoxolone does not seem to be mediated by GR but seems to be exerted purely via the MR (Figure 7). There were no adverse effects of long-term carbenoxolone therapy in this patient. He also reported increased stamina, a better ability to concentrate and less anxiety. On treatment, the patient grew 6 cm/y and progressed from -4SD to -3SD scores for mean height for age. He also progressed in his pubertal development from Tanner stage III to IV for pubic hair, while his bone age advanced from 12 to 14 y.

Figure 7. Mechanism of the effect of carbenoxolone. Carbenololone inhibits of conversion of cortisol to cortisone in the kidney, resulting in the enhancement of the effect of cortisol as a ligand for MR. Dexamethasone suppressed cortisol production and reversing the beneficial effect of carbenoxolone in our patient with PHA1.

Both carbenoxolone and fludrocortisone normalized the serum electrolytes of our patient, suggesting the presence of a functional, albeit possibly defective, renal MR. Interestingly, the same patient was unresponsive to intravenous infusion of aldosterone and fludrocortisone (up to 3 mg/day) when studied in infancy (145), suggesting that the clinical improvement that has been noted in the majority of PHA patients with age may be related to changes in their responsiveness to mineralocorticoid.

On the other hand, another study reported that carbenoxolone did not show any significant salt-retaining effect in two patients with multiple PHA, while carbenoxolone significantly suppressed the renin-aldosterone system in a patient with renal-form PHA (146).  This difference of responsiveness to carbenoxolone may be due to an age-dependent change on mineralocorticoid responsiveness. Additionally, the different mineralocorticoid responsiveness of renal and multisystem PHA patients indicates a difference in their MR function. The partial response to carbenoxolone in renal PHA suggests that there is at least a partly functional MR. This is also supported by the observation that spironolactone, a mineralocorticoid antagonist, aggravated sodium loss in several patients with renal PHA (147).

MOLECULAR MECHANISM(S) OF PSEUDOHYPOALDOSTERONISM TYPE 1          

In 1996, a study reported homozygous mutations introducing a stop codon or frame shift in the αENaC gene of affected members of families with autosomal recessive PHA (61).  To date, worldwide more than 40 different mutations have been described in the coding region of ENaC subunit genes (148–150). The majority of mutations appear in the αENaC gene SCNN1A, most frequently in exon 8 (61,150–152). Mutations are nonsense, single base deletions or insertions, or splice-site mutations, leading to abnormal length of mRNA and protein. Few missense mutations in αENaC gene have also been reported (149,153). Only a few cases of mutations in β and gamma ENaC genes have been reported (149,154,155). Phenotype and genotype correlations have been noted with more severe phenotype in nonsense, frameshift, and abnormal splicing mutations than patients with missense mutations (148,154,155).

A Swedish study regarding families with autosomal recessive PHA, homozygous or compound heterozygous mutations showed that a stop codon or a frame shift in the αENaC gene was associated with pulmonary disease as well (150). The truncation caused by these mutations influenced the PY motif at the N-terminal region of the molecule. This motif is responsible for the binding of the channel subunits with Nedd4, a carrier protein facilitating clearance of the channel (60). Moreover, a point mutation of the αENaC gene, located close to the N-terminal of the protein, was reported to cause a decrease of the probability of an open sodium channel, resulting in defective reabsorption (61,153). In the other four families with autosomal recessive PHA, insertion of a T in exon 8 and nonsense mutation (R508X) in exon 11 of the αENaC gene, resulting in a truncated αENaC subunit, was found (156). A splice site mutation in intron 12 of the βENaC gene, which preventing correct splicing of the mRNA was found in a Scottish patient (156). Also, other autosomal recessive families with PHA had a homozygous splice-site mutation in the γENaC, while a Japanese sporadic patient with the systemic form of PHA was a compound heterozygote for mutations in the αENaC, which resulted in the generation of a truncated channel subunit (137,157) . Compound heterozygous mutations (Q217X in exon 4 and Y306X in exon 6) of βENaC have been reported in the patient with multi-organ PHA1 of Ashkenazi family in Israel (154). These mutations produce shortened βENaC subunits with 253 and 317 residues respectively instead of the 640 residues present in βENaC subunit. Expression of cRNA carrying these mutations in Xenopas oocytes showed that the either mutation drastically reduced to only 3% of normal ENaC activity (154).  An African American female with PHA, who had persistent and symptom hyperkalemia, had compound heterozygous mutation in the βENaC gene: c.1288delC in exon 9, a one-base deletion that generated a frameshift mutation, and c.1466+1 G>A, an intronic base substitution in intron11 that leaded to a splice site mutation (158).

To date more than 50 different mutations in the human MR gene (NR3C2) causing autosomal dominant PHA1 have been described. NR3C2 mutations were found in 62% of patients with renal PHA1 referred to a genetics laboratory at the Hôpital Européen Georges Prompidou in France (135). Nonsense mutations, frameshift mutations, splice site mutations, and deletions of whole or part of the gene lead to gross change of the MR protein. Nonsense mutations are found in all exons and lead to truncated MR protein. A past study. reported families with autosomal dominant PHA, who had molecular defects of the MR resulting in non-expression of one of the 2 alleles (138) (Figure 8). In addition, another study reported a sporadic patient with PHA who had a heterozygous mutation in exon 9 of the MR that introduced a premature stop codon (144) (Figure 8). These results, may suggest that expression of only one allele of the MR is insufficient to prevent salt loss. Another case study did not identify any abnormalities of the MR in PHA patients from two families with the autosomal dominant form of the disease (144), while other authors reported a heterozygous missense mutation in exon 8 of the MR gene identified in PHA patients from a Japanese autosomal dominant family (139) (Figure 8). A heterozygous nonsense mutation in exon 2 (S163X, C436X) and in exon 9 (R947X) of the MR, leading to a premature stop codon of the MR gene were found in other patients with autosomal dominant PHA (159–161). It was previously reported a heterozygous splice acceptor site mutation, which results in exon 7 skipping and subsequently in premature termination in exon 8 of MR with Japanese female patients with PHA1 (162). This study showed that RT-PCR products of mRNA with that patient showed both wiled-type and mutated mRNA, suggesting that haploinsufficiency due to nonsense mediated mRNA decay with premature termination is not sufficient to give rise to the PHA phenotype (162). It was also reported that Q776R mutation in exon 5 or L979P mutation in exon 9, which is located in the ligand-binding domain of the MR, presented reduced or absent aldosterone binding, respectively (163). Three-dimensional structure of MR suggests that the residue Q776 is located in helix 3 and is locking aldosterone in the ligand-binding pocket (163). A study examined patients with PHA1 presenting isolated renal salt loss from six families in Italy and Germany and found one nonsense mutation (E378X), one frameshift mutation (A958R) and two missense mutations (S818L and E972G) (164). S818L does not bind aldosterone or activate transcription or translocate into the nucleus. Three-dimensional molecular structure showed that S818 was located in helix H5 and S818 was speculated to be necessary to stabilize helix H5 and the -sheet 1 via hydrogen bond to Y828. E972G mutation showed a significantly lower ligand-binding affinity and only 9% of wild-type transcriptional activity. Three-dimensional molecular structure showed that E972 is involved in a hydrogen-bond network with R947 anchoring helix H12 to H10. Thus, substitute of E972G suggested to be open up the hydrophobic core and displace helix H10, causing the decreased ligand-binding ability (164).

A Japanese study reported four sporadic patients and two siblings with a renal form of PHA (165). Two siblings and one sporadic patient had R651X of NR3C2 (MR) gene. One sporadic patient had R947X, another two patients had 603A deletion and 304-305CG deletion, respectively, both resulting in frameshift mutations (165).

Another study reported two female Japanese infants with the renal form of PHA1 and identified two heterozygous mutations. One had a c.4932_493insTT in Exon 2, resulting in a premature stop codon (p.Met166 LeufsX8) and another had a nonsense mutation of R861X in exon 7 (166).  These mutations resulted in haploinsufficiency of the MR and were the cause of aldosterone resistance in the kidney.

From the study of the genetics laboratory at the Hôpital Européen Georges Pompidou in France, 20 mutations were found in exon 2; all of them led to truncated receptors, Of the 22 mutations identified in exon 3 and 4, coding for the MR DBD, 11 were nonsense or frameshift mutations, the reminder missense mutations. Thirty variants were located in exon 5-9 and affected LBD; the majority were missense mutations. Nine were splice variants in different introns, 19 were large deletions encompassing single or multiple exons and the flanking intronic regions of the NR3C2 gene (135) (figure 8).

These studies suggest major molecular heterogeneity in PHA.

Figure 8. Mutations of the MR in patients with PHA1. Mutations of the MR that have been reported in patients with PHA1 are summarized in the figure (135,138,139,144,166)

Another study investigated 5 unrelated cases of sporadic PHA (79,140,143). The researchers found a nonconservative homozygous mutation (A241V) in the MR of 4 of the patients and a conservative heterozygous mutation (I180V) in one of these patients and his asymptomatic father, while no abnormalities were found in the DNA- or ligand-binding domains of the MR. The Val241 and Val180 substitutions were found also in the norm 6al population. The heterozygosity and homozygosity frequencies of the Val241 and Val180 mutations were 48%, 38%, 22% and 1.5%, respectively. Another finding was a nonconservative amino acid substitution (T663A) in the αENaC, which was located close to the C-terminal (79). Of the 5 patients, 2 were homozygous and 3 heterozygous for this variation, respectively. This amino acid substitution was also present at high frequency in apparently normal controls. The homozygosity and heterozygosity frequencies of the αENaC Ala663 were 31% and 64%, respectively. Three of the 4 (75%) patients with multiple tissue resistance to aldosterone had both αENaC (heterozygous or homozygous) and MR (homozygous) mutations as described above, while only 7% of our controls with apparently normal salt conservation had the same concurrent abnormalities (Table 2, p < 0.025).

Table 2. MR and aENaC Polymorphisms in PHA and Normal Subjects


 MR

 αENaC

 Target organ


 I180V

 A241V

 T663A


 Homo

 hetero

 homo

 Hetero

 homo

 Hetero


 Pt.1


+


+


+


 Multiple

 Pt.2


 +


 Multiple

 Pt.3


 +


 +


 Multiple


 Pt.4


+


 Multiple


 Pt.5


+


+


 Isolated


controls


1.5%


22%


38%


48%


31%


64%


controls


+


+


+


controls


+


+


controls


+


+


                (79) with permission

The researchers identified, in a Japanese patient with sporadic PHA, three homozygous substitutions in the MR gene: G215C, I180V or A241V, which had previously reported to occur in healthy populations. Luciferase activities induced by MR with either G215C, I180V or A241V substitution were significantly lower than those for wild-type MR with aldosterone at concentrations ranging from 10-11 to 10-9 M, 10-8M, or 10-11 to 10-6M, respectively. A homozygous A to G substitution of the donor splice site of αENaC intron 4 was found in the patient. These results suggest that each of three MR polymorphisms identified in our patient is functionally and structurally heterogeneous (167).

The authors suggested that the above polymorphisms may confer vulnerability in salt conservation, which might be expressed fully only when concurrently present with other genetic defects of the MR or other proteins that participate in sodium homeostasis, such as Nedd4 (168). This hypothesis, if true, would be compatible with a sporadic presentation or a digenic or multigenic expression and heredity as previously described in retinitis pigmentosa (169). In this case, hereditary transmission might be complex and appear either as a dominant and/or recessive trait with variable penetrance.

Secondary Pseudohypoaldosteronism (PHA)

Secondary PHA is a form of renal resistance to aldosterone. The cause of secondary PHA is either renal disease or medication. The clinical and laboratory findings resemble those of a transient PHA. Since Rodriguez-Soriano et al. reported the first case in 1983 (169), more than 68 cases have been reported. Secondary PHA may occur mainly in neonates and young infants with urinary tract infections, such as pyelonephritis, and/or malformation of urinary system causing obstructive uropathy, tubulointerstitial nephritis, sickle cell nephropathy, and systemic lupus erythematosus(170). Secondary PHA has been also related to drugs like non-steroidal anti-inflammatory agents and potassium-sparing diuretics (170–172). This state occurs in male infants more frequently than female infants because of the higher incidence of urinary tract infections and obstructive uropathy in male infants rather than in female infants(169). Patients present poor feeding, poor weight gain or failure to thrive, vomiting, diarrhea, polyuria, and dehydration. Acute worsening of their general condition may occur, with severe weight loss, peripheral circulatory failure, rise in serum urea and creatinine levels, and occasional life-threatening hyperkalemia (169). The laboratory features are hyponatremia, hyperkalemia, metabolic acidosis, elevation of plasma aldosterone concentrations and plasma renin activity, and inappropriately increased sodium and decreased potassium excretion in urine (173).  The aldosterone resistance of secondary PHA is transient and usually reverts with the resolution of the infection.

PATHOPHYSIOLOGY

The very high ratio of plasma aldosterone to potassium, together with diminished urinary K/Na values, strongly suggests that hyponatremia and hyperkalemia result from a lack of response of the renal tubule to endogenous mineralocorticoids (174). The intrarenal expression of several cytokines, such as tumor necrosis factor alpha, interleukin (IL) 1, IL-6, transforming growth factor beta-1, angiotensin II, endothelin, thromboxane A2, and prostaglandins, are increased in cases of urinary tract infections. These changes result in inhibition of aldosterone action through reduction of its expression and/or impairment of its receptor, vasoconstriction and reduction of glomerular filtration rate, increased natriuresis and/or decreased Na+-K+-ATPase activity(173) . A past study found that the number of mineralocorticoid receptors in obstructive uropathy were low in the acute phase but returned to normal after successful surgical correction of the obstruction (175). This suggests that a reduced aldosterone effect can also reflect down-regulation of the receptor sites, due to highly elevated aldosterone levels (175).

THERAPY

The clinical and laboratory findings improve within one or two days and disappear after the completion of medical treatment of urinary tract infection and/or surgical correction of obstructive uropathy, usually within a few days to one week after beginning of treatment (173). However, in some patients, sodium bicarbonate and/or sodium chloride supplementation may be necessary for a week or month (173)

REFERENCES

  1. Miller WL. Molecular biology of steroid hormone synthesis. Endocrine Reviews 1988;9(3):295–318.
  2. Chung BC, Matteson KJ, Voutilainen R, Mohandas TK, Miller WL. Human cholesterol side-chain cleavage enzyme, P450scc: cDNA cloning, assignment of the gene to chromosome 15, and expression in the placenta. Proceedings of the National Academy of Sciences of the United States of America 1986;83(23):8962–8966.
  3. White PC, Chaplin DD, Weis JH, Dupont B, New MI, Seidman JG. Two steroid 21-hydroxylase genes are located in the murine S region. Nature 1984;312(5993):465–467.
  4. White PC, New MI, Dupont B. HLA-linked congenital adrenal hyperplasia results from a defective gene encoding a cytochrome P-450 specific for steroid 21-hydroxylation. Proceedings of the National Academy of Sciences of the United States of America 1984;81(23 I):7505–7509.
  5. Curnow KM, Tusie-Lunaf MT, Pascoe L, Natarajan R, Gu JL, Nadler JL, Whitef PC. The product of the CYP11B2 gene is required for aldosterone biosynthesis in the human adrenal cortex. Molecular Endocrinology 1991;5(10):1513–1522.
  6. Kawamoto T, Mitsuuchi Y, Toda K, Yokoyama Y, Miyahara K, Miura S, Ohnishi T, Ichikawa Y, Nakao K, Imura H, Ulick S, Shizuta Y. Role of steroid 11β-hydroxylase and steroid 18-hydroxylase in the biosynthesis of glucocorticoids and mineralocorticoids in humans. Proceedings of the National Academy of Sciences of the United States of America 1992;89(4):1458–1462.
  7. Chua SC, Szabo P, Vitek A, Grzeschik KH, John M, White PC. Cloning of cDNA encoding steroid 11 beta-hydroxylase (P450c11). Proceedings of the National Academy of Sciences of the United States of America 1987;84(20):7193–7197.
  8. Rainey WE. Adrenal zonation: Clues from 11β-hydroxylase and aldosterone synthase. Molecular and Cellular Endocrinology 1999;151(1–2):151–160.
  9. Demura M, Bulun SE. CpG dinucleotide methylation of the CYP19 I.3/II promoter modulates cAMP-stimulated aromatase activity. Molecular and Cellular Endocrinology 2008;283(1–2):127–132.
  10. Takeda Y, Demura M, Wang F, Karashima S, Yoneda T, Kometani M, Hashimoto A, Aono D, Horike SI, Meguro-Horike M, Yamagishi M, Takeda Y. Epigenetic regulation of aldosterone synthase gene by sodium and angiotensin II. Journal of the American Heart Association 2018;7(10). doi:10.1161/JAHA.117.008281.
  11. Gibbons GH, Dzau VJ, Farhi ER, Barger AC. Interaction of Signals Influencing Renin Release. Annual Review of Physiology 1984;46(1):291–308.
  12. Quinn SJ, Williams GH. Regulation of aldosterone secretion. Annual Review of Physiology 1988;50:409–426.
  13. Kramer E, Gallant S, Brownie AC. Actions of Angiotensin 11 on Aldosterone Adrenal Cortex Biosynthesis in the Rat AND LATE PATHWAY* Animals and Tissue Preparation-Female Sprague-Dawley rats.
  14. Bassett MH, White PC, Rainey WE. The regulation of aldosterone synthase expression. In: Molecular and Cellular Endocrinology.Vol 217. Mol Cell Endocrinol; 2004:67–74.
  15. Kojima I, Kojima K, Rasmussen H. Role of calcium and cAMP in the action of adrenocorticotropin on aldosterone secretion. Journal of Biological Chemistry 1985;260(7):4248–4256.
  16. Woodcock EA, McLeod JK, Johnston CI. Vasopressin stimulates phosphatidylinositol turnover and aldosterone synthesis in rat adrenal glomerulosa cells: Comparison with angiotensin ii. Endocrinology 1986;118(6):2432–2436.
  17. Hollenberg NK, Chenitz WR, Adams DF, Williams GH. Reciprocal influence of salt intake on adrenal glomerulosa and renal vascular responses to angiotensin II in normal man. Journal of Clinical Investigation 1974;54(1):34–42.
  18. Carey RM. Acute Dopaminergic Inhibition of Aldosterone Secretion Is Independent of Angiotensin II and Adrenocorticotropin. Journal of Clinical Endocrinology and Metabolism 1982;54(2):463–469.
  19. Missale C, Liberini P, Memo M, Carruba MO, Spano P. Characterization of dopamine receptors associated with aldosterone secretion in rat adrenal glomerulosa. Endocrinology 1986;119(5):2227–2232.
  20. Chartier L, Schiffrin EL. Role of calcium in effects of atrial natriuretic peptide on aldosterone production in adrenal glomerulosa cells. American Journal of Physiology - Endocrinology and Metabolism 1987;252(4 (15/4)). doi:10.1152/ajpendo.1987.252.4.e485.
  21. Jorgensen PL. Structure, function and regulation of Na,K-ATPase in the kidney. Kidney International 1986;29(1):10–20.
  22. Oguchi A, Ikeda U, Kanbe T, Tsuruya Y, Yamamoto K, Kawakami K, Medford RM, Shimada K. Regulation of Na-K-ATPase gene expression by aldosterone in vascular smooth muscle cells. American Journal of Physiology - Heart and Circulatory Physiology 1993;265(4 34-4). doi:10.1152/ajpheart.1993.265.4.h1167.
  23. Pearce D. SGK1 regulation of epithelial sodium transport. Cellular Physiology and Biochemistry 2003;13(1):13–20.
  24. Bhalla V, Daidié D, Li H, Pao AC, LaGrange LP, Wang J, Vandewalle A, Stockand JD, Staub O, Pearce D. Serum- and glucocorticoid-regulated kinase 1 regulates ubiquitin ligase neural precursor cell-expressed, developmentally down-regulated protein 4-2 by inducing interaction with 14-3-3. Molecular Endocrinology 2005;19(12):3073–3084.
  25. Kornel L, Smoszna-Konaszewska B. Aldosterone (ALDO) increases transmembrane influx of Na+ in vascular smooth muscle (VSM) cells through increased synthesis of Na+ channels. Steroids 1995;60(1):114–119.
  26. Mick VE, Itani OA, Loftus RW, Husted RF, Schmidt TJ, Thomas CP. The α-Subunit of the Epithelial Sodium Channel Is an Aldosterone-Induced Transcript in Mammalian Collecting Ducts, and This Transcriptional Response Is Mediated via Distinct cis -Elements in the 5′-Flanking Region of the Gene . Molecular Endocrinology 2001;15(4):575–588.
  27. Yoo D, Kim BY, Campo C, Nance L, King A, Maouyo D, Welling PA. Cell surface expression of the ROMK (Kir 1.1) channel is regulated by the aldosterone-induced kinase, SGK-1, and protein kinase A. Journal of Biological Chemistry 2003;278(25):23066–23075.
  28. Gros R, Ding Q, Sklar LA, Prossnitz EE, Arterburn JB, Chorazyczewski J, Feldman RD. GPR30 expression is required for the mineralocorticoid receptor-independent rapid vascular effects of aldosterone. Hypertension 2011;57(3):442–451.
  29. Gros R, Ding Q, Liu B, Chorazyczewski J, Feldman RD. Aldosterone mediates its rapid effects in vascular endothelial cells through GPER activation. American Journal of Physiology - Cell Physiology 2013;304(6). doi:10.1152/ajpcell.00203.2012.
  30. Mangelsdorf DJ, Thummel C, Beato M, Herrlich P, Schütz G, Umesono K, Blumberg B, Kastner P, Mark M, Chambon P, Evans RM. The nuclear receptor superfamily: The second decade. Cell 1995;83(6):835–839.
  31. Hellal-Levy C, Fagart J, Souque A, Rafestin-Oblin ME. Mechanistic aspects of mineralocorticoid receptor activation. In: Kidney International.Vol 57. Blackwell Publishing Inc.; 2000:1250–1255.
  32. Arriza JL, Weinberger C, Cerelli G, Glaser TM, Handelin BL, Housman DE, Evans RM. Cloning of human mineralocorticoid receptor complementary DNA: Structural and functional kinship with the glucocorticoid receptor. Science 1987;237(4812):268–275.
  33. Fan YS, Eddy RL, Byers MG, Haley LL, Henry WM, Novvak NJ, Shows TB. The human mineralocorticoid receptor gene (MLR) is located on chromosome 4 at q31.2. Cytogenetic and Genome Research 1989;52(1–2):83–84.
  34. Morrison N, Harrap SB, Arriza JL, Boyd E, Connor JM. Regional chromosomal assignment of the human mineralocorticoid receptor gene to 4q31.1. Human Genetics 1990;85(1):130–132.
  35. Zennaro MC, Keightley MC, Kotelevtsev Y, Conway GS, Soubrier F, Fuller PJ. Human mineralocorticoid receptor genomic structure and identification of expressed isoforms. Journal of Biological Chemistry 1995;270(36):21016–21020.
  36. Zennaro MC, Farman N, Bonvalet JP, Lombès M. Tissue-specific expression of α and β messenger ribonucleic acid isoforms of the human mineralocorticoid receptor in normal and pathological states. Journal of Clinical Endocrinology and Metabolism 1997;82(5):1345–1352.
  37. Arai K, Zachman K, Shibasaki T, Chrousos GP. Polymorphisms of Amiloride-Sensitive Sodium Channel Subunits in Five Sporadic Cases of Pseudohypoaldosteronism: Do They Have Pathologic Potential? 1 . The Journal of Clinical Endocrinology & Metabolism 1999;84(7):2434–2437.
  38. Beato M, Sánchez-Pacheco A. Interaction of steroid hormone receptors with the transcription initiation complex. Endocrine Reviews 1996;17(6):587–609.
  39. Bamberger CM, Bamberger AM, Wald M, Chrousos GP, Schulte HM. Inhibition of mineralocorticoid activity by the β isoform of the human glucocorticoid receptor. Journal of Steroid Biochemistry and Molecular Biology 1997;60(1–2):43–50.
  40. Arai K, Chrousos GP. Aldosterone Deficiency and Resistance. MDText.com, Inc.; 2000. Available at: http://www.ncbi.nlm.nih.gov/pubmed/25905305. Accessed August 18, 2020.
  41. Funder JW, Pearce PT, Myles K, Roy LP. Apparent mineralocorticoid excess, pseudohypoaldosteronism, and urinary electrolyte excretion: toward a redefinition of mineralocorticoid action. The FASEB Journal 1990;4(14):3234–3238.
  42. Albiston AL, Obeyesekere VR, Smith RE, Krozowski ZS. Cloning and tissue distribution of the human 1 lβ-hydroxysteroid dehydrogenase type 2 enzyme. Molecular and Cellular Endocrinology 1994;105(2). doi:10.1016/0303-7207(94)90176-7.
  43. Obeyesekere VR, Li KXZ, Ferrari P, Krozowski Z. Truncation of the N- and C-terminal regions of the human 11β-hydroxysteroid dehydrogenase type 2 enzyme and effects on solubility and bidirectional enzyme activity. Molecular and Cellular Endocrinology 1997;131(2):173–182.
  44. Bujalska I, Shimojo M, Howie A, Stewart PM. Human 11β-hydroxysteroid dehydrogenase: Studies on the stably transfected isoforms and localization of the type 2 isozyme within renal tissue. In: Steroids.Vol 62. Elsevier Inc.; 1997:77–82.
  45. Murphy BEP. Specificity of human 11β-hydroxysteroid dehydrogenase. Journal of Steroid Biochemistry 1981;14(8):807–809.
  46. Frey FJ. Kinetics and dynamics of prednisolone. Endocrine Reviews 1987;8(4):453–473.
  47. Ferrari P, Smith RE, Funder JW, Krozowski ZS. Substrate and inhibitor specificity of the cloned human 11β-hydroxysteroid dehydrogenase type 2 isoform. American Journal of Physiology - Endocrinology and Metabolism 1996;270(5). doi:10.1152/ajpendo.1996.270.5.E900.
  48. Souness GW, Morris DJ. The antinatriuretic and kaliuretic effects of the glucocorticoids corticosterone and cortisol following pretreatment with carbenoxolone sodium (a liquorice derivative) in the adrenalectomized rat. Endocrinology 1989;124(3):1588–1590.
  49. Canessa CM, Horisberger JD, Rossier BC. Epithelial sodium channel related to proteins involved in neurodegeneration. Nature 1993;361(6411):467–470.
  50. Canessa CM, Schild L, Buell G, Thorens B, Gautschi I, Horisberger JD, Rossier BC. Amiloride-sensitive epithelial Na+ channel is made of three homologous subunits. Nature 1994;367(6462):463–467.
  51. Voilley N, Lingueglia E, Champigny G, Mattéi MG, Waldmann R, Lazdunski M, Barbry P. The lung amiloride-sensitive Na+ channel: Biophysical properties, pharmacology, ontogenesis, and molecular cloning. Proceedings of the National Academy of Sciences of the United States of America 1994;91(1):247–251.
  52. McDonald FJ, Price MP, Snyder PM, Welsh MJ. Cloning and expression of the β- and γ-subunits of the human epithelial sodium channel. American Journal of Physiology - Cell Physiology 1995;268(5 37-5). doi:10.1152/ajpcell.1995.268.5.c1157.
  53. Snyder PM. Minireview: Regulation of epithelial Na+ channel trafficking. Endocrinology 2005;146(12):5079–5085.
  54. Masilamani S, Kim GH, Mitchell C, Wade JB, Knepper MA. Aldosterone,mediated regulation of ENaC α, β, and γ subunit proteins in rat kidney. Journal of Clinical Investigation 1999;104(7). doi:10.1172/JCI7840.
  55. Snyder PM, Steines JC, Olson DR. Relative Contribution of Nedd4 and Nedd4-2 to ENaC Regulation in Epithelia Determined by RNA Interference. Journal of Biological Chemistry 2004;279(6):5042–5046.
  56. Rotin D, Bar-Sagi D, O’Brodovich H, Merilainen J, Lehto VP, Canessa CM, Rossier BC, Downey GP. An SH3 binding region in the epithelial Na+ channel (alpha rENaC) mediates its localization at the apical membrane. The EMBO journal 1994;13(19):4440–50.
  57. Shimkets RA, Warnock DG, Bositis CM, Nelson-Williams C, Hansson JH, Schambelan M, Gill JR, Ulick S, Milora R v., Findling JW, Canessa CM, Rossier BC, Lifton RP. Liddle’s syndrome: Heritable human hypertension caused by mutations in the β subunit of the epithelial sodium channel. Cell 1994;79(3):407–414.
  58. Hansson JH, Nelson-Williams C, Suzuki H, Schild L, Shimkets R, Lu Y, Canessa C, Iwasaki T, Rossier B, Lifton RP. Hypertension caused by a truncated epithelial sodium channel γ subunit: Genetic heterogeneity of Liddle syndrome. Nature Genetics 1995;11(1):76–82.
  59. Hansson JH, Schild L, Lu Y, Wilson TA, Gautschi I, Shimkets R, Nelson-Williams C, Rossier BC, Lifton RP. A de novo missense mutation of the β subunit of the epithelial sodium channel causes hypertension and Liddle syndrome, identifying a proline-rich segment critical for regulation of channel activity. Proceedings of the National Academy of Sciences of the United States of America 1995;92(25):11495–11499.
  60. Tamura H, Schild L, Enomoto N, Matsui N, Marumo F, Rossier BC, Sasaki S. Liddle disease caused by a missense mutation of β subunit of the epithelial sodium channel gene. Journal of Clinical Investigation 1996;97(7):1780–1784.
  61. Schild L, Lu Y, Gautschi I, Schneeberger E, Lifton RP, Rossier BC. Identification of a PY motif in the epithelial Na channel subunits as a target sequence for mutations causing channel activation found in Liddle syndrome. EMBO Journal 1996;15(10):2381–2387.
  62. Chang SS, Grunder S, Hanukoglu A, Rösler A, Mathew PM, Hanukoglu I, Schild L, Lu Y, Shimkets RA, Nelson-Williams C, Rossier BC, Lifton RP. Mutations in subunits of the epithelial sodium channel cause salt wasting with hyperkalaemic acidosis, pseudohypoaldosteronism type 1. Nature Genetics 1996;12(3):248–253.
  63. McCormick JA, Bhalla V, Pao AC, Pearce D. SGK1: A rapid aldosterone-induced regulator of renal sodium reabsorption. Physiology 2005;20(2):134–139.
  64. Muller OG, Parnova RG, Centeno G, Rossier BC, Firsov D, Horisberger JD. Mineralocorticoid effects in the kidney: Correlation between αENaC, GILZ, and Sgk-1 mRNA expression and urinary excretion of Na+ and K+. Journal of the American Society of Nephrology 2003;14(5):1107–1115.
  65. Ziera T, Irlbacher H, Fromm A, Latouche C, Krug SM, Fromm M, Jaisser F, Borden SA. Cnksr3 is a direct mineralocorticoid receptor target gene and plays a key role in the regulation of the epithelial sodium channel. The FASEB Journal 2009;23(11):3936–3946.
  66. Booth RE, Stockand JD. Targeted degradation of ENaC in response to PKC activation of the ERK1/2 cascade. American Journal of Physiology - Renal Physiology 2003;284(5 53-5). doi:10.1152/ajprenal.00373.2002.
  67. Ring AM, Leng Q, Rinehart J, Wilson FH, Kahle KT, Hebert SC, Lifton RP. An SGK1 site in WNK4 regulates Na+ channel and K+ channel activity and has implications for aldosterone signaling and K + homeostasis. Proceedings of the National Academy of Sciences of the United States of America 2007;104(10):4025–4029.
  68. Valinsky WC, Touyz RM, Shrier A. Aldosterone, SGK1, and ion channels in the kidney. Clinical Science 2018;132(2):173–183.
  69. Debonneville C, Flores SY, Kamynina E, Plant PJ, Tauxe C, Thomas MA, Münster C, Chraïbi A, Pratt JH, Horisberger JD, Pearce D, Loffing J, Staub O. Phosphorylation of Nedd4-2 by Sgk1 regulates epithelial Na+ channel cell surface expression. EMBO Journal 2001;20(24):7052–7059.
  70. Arteaga MF, Wang L, Ravid T, Hochstrasser M, Canessa CM. An amphipathic helix targets serum and glucocorticoid-induced kinase 1 to the endoplasmic reticulum-associated ubiquitin-conjugation machinery. Proceedings of the National Academy of Sciences of the United States of America 2006;103(30):11178–11183.
  71. Robert-Nicoud M, Flahaut M, Elalouf JM, Nicod M, Salinas M, Bens M, Doucet A, Wincker P, Artiguenave F, Horisberger JD, Vandewalle A, Rossier BC, Firsov D. Transcriptome of a mouse kidney cortical collecting duct cell line: Effects of aldosterone and vasopressin. Proceedings of the National Academy of Sciences of the United States of America 2001;98(5):2712–2716.
  72. Soundararajan R, Melters D, Shih IC, Wang J, Pearce D. Epithelial sodium channel regulated by differential composition of a signaling complex. Proceedings of the National Academy of Sciences of the United States of America 2009;106(19):7804–7809.
  73. Soundararajan R, Wang J, Melters D, Pearce D. Glucocorticoid-induced leucine zipper 1 stimulates the epithelial sodium channel by regulating serum- and glucocorticoid-induced kinase 1 stability and subcellular localization. Journal of Biological Chemistry 2010;285(51):39905–39913.
  74. Loffing J, Zecevic M, Féraille E, Kaissling B, Asher C, Rossier BC, Firestone GL, Pearce D, Verrey F. Aldosterone induces rapid apical translocation of ENaC in early portion of renal collecting system: Possible role of SGK. American Journal of Physiology - Renal Physiology 2001;280(4 49-4). doi:10.1152/ajprenal.2001.280.4.f675.
  75. Soundararajan R, Pearce D, Ziera T. The role of the ENaC-regulatory complex in aldosterone-mediated sodium transport. Molecular and Cellular Endocrinology 2012;350(2):242–247.
  76. Zhang W, Xia X, Jalal DI, Kuncewicz T, Xu W, Lesage GD, Kone BC. Aldosterone-sensitive repression of ENaCα transcription by a histone H3 lysine-79 methyltransferase. American Journal of Physiology - Cell Physiology 2006;290(3). doi:10.1152/ajpcell.00431.2005.
  77. Zhang W, Xia X, Reisenauer MR, Hemenway CS, Kone BC. Dot1a-AF9 complex mediates histone H3 Lys-79 hypermethylation and repression of ENaCα in an aldosterone-sensitive manner. Journal of Biological Chemistry 2006;281(26):18059–18068.
  78. Reisenauer MR, Anderson M, Huang L, Zhang Z, Zhou Q, Kone BC, Morris AP, LeSage GD, Dryer SE, Zhang W. AF17 competes with AF9 for binding to Dot1a to up-regulate transcription of epithelial Na+ channel α. Journal of Biological Chemistry 2009;284(51):35659–35669.
  79. Zhang W, Xia X, Reisenauer MR, Rieg T, Lang F, Kuhl D, Vallon V, Kone BC. Aldosterone-induced Sgk1 relieves Dot1a-Af9-mediated transcriptional repression of epithelial Na+ channel α. Journal of Clinical Investigation 2007;117(3):773–783.
  80. Arai K, Zachman K, Shibasaki T, Chrousos GP. Polymorphisms of Amiloride-Sensitive Sodium Channel Subunits in Five Sporadic Cases of Pseudohypoaldosteronism: Do They Have Pathologic Potential? 1 . The Journal of Clinical Endocrinology & Metabolism 1999;84(7):2434–2437.
  81. Kowarski A, Katz H, Mlgeon CJ. Plasma aldosterone concentration in normal subjects from infancy to adulthood. Journal of Clinical Endocrinology and Metabolism 1974;38(3):489–491.
  82. van Acker KJ, Scharpe SL, Deprettere AJR, Neels HM. Renin-angiotensin-aldosterone system in the healthy infant and child. Kidney International 1979;16(2):196–203.
  83. Laetitia M, Eric P, Laurence FLH, Francois P, Claudine C, Pascal B, Lombès M. Physiological partial aldosterone resistance in human newborns. Pediatric Research 2009;66(3):323–328.
  84. Bizzarri C, Pedicelli S, Cappa M, Cianfarani S. Water balance and “salt wasting” in the first year of life: The role of aldosterone-signaling defects. Hormone Research in Paediatrics 2016;86(3):143–153.
  85. Coulter CL, Jaffe RB. Functional maturation of the primate fetal adrenal in vivo: 3. Specific zonal localization and developmental regulation of CYP21A2 (P450c21) and CYP11B1/CYP11B2 (P450c11/aldosterone synthase) lead to integrated concept of zonal and temporal steroid biosynthesis. Endocrinology 1998;139(12):5144–5150.
  86. Martinerie L, Viengchareun S, Delezoide AL, Jaubert F, Sinico M, Prevot S, Boileau P, Meduri G, Lombes M. Low renal mineralocorticoid receptor expression at birth contributes to partial aldosterone resistance in neonates. Endocrinology 2009;150(9):4414–4424.
  87. LANDAU RL, LUGIBIHL K. Inhibition of the sodium-retaining influence of aldosterone by progesterone. The Journal of clinical endocrinology and metabolism 1958;18(11):1237–1245.
  88. HUDSON JB, CHOBANIAN A v., RELMAN AS. Hypoaldosteronism; a clinical study of a patient with an isolated adrenal mineralocorticoid deficiency, resulting in hyperkalemia and Stokes-Adams attacks. The New England journal of medicine 1957;257(12):529–536.
  89. Schambelan M, Stockigt JR, Biglieri EG. Isolated Hypoaldosteronism in Adults: A Renin-Deficiency Syndrome. New England Journal of Medicine 1972;287(12):573–578.
  90. Perez G, Siegel L, Schreiner GE. Selective hypoaldosteronism with hyperkalemia. Annals of internal medicine 1972;76(5):757–763.
  91. Sebastian A, Schambelan M, Lindenfeild S, Morris RC. Amelioration of Metabolic Acidosis with Fludrocortisone Therapy in Hyporeninemic Hypoaldosteronism. New England Journal of Medicine 1977;297(11):576–583.
  92. Perez GO, Lespier L, Jacobi J, Oster JR, Katz FH, Vaamonde CA, Fishman LM. Hyporeninemia and Hypoaldosteronism in Diabetes Mellitus. Archives of Internal Medicine 1977;137(7):852–855.
  93. Kalin MF, Poretsky L, Seres DS, Zumoff B. Hyporeninemic hypoaldosteronism associated with acquired immune deficiency syndrome. The American Journal of Medicine 1987;82(5):1035–1038.
  94. Onozaki A, Katoh T, Watanabe T. Hyporeninemic hypoaldosteronism associated with Sjogren’s syndrome [4]. American Journal of Medicine 2002;112(3):245–246.
  95. DeFronzo RA. Hyperkalemia and hyporeninemic hypoaldosteronism. Kidney International 1980;17(1):118–134.
  96. Nadler JL, Lee FO, Hsueh W, Horton R. Evidence of Prostacyclin Deficiency in the Syndrome of Hyporeninemic Hypoaldosteronism. New England Journal of Medicine 1986;314(16):1015–1020.
  97. Tuck ML, Sambhi MP, Levin L. Hyporeninemic hypoaldosteronism in diabetes mellitus. Studies of the autonomic nervous system’s control of renin release. Diabetes 1979;28(3):237–241.
  98. Perez GO, Lespier LE, Oster JR, Vaamonde CA. Effect of alterations of sodium intake in patients with hyporeninemic hypoaldosteronism. Nephron 1977;18(5):259–265.
  99. Escarce JJ. Hyporeninemic Hypoaldosteronism in a Patient With Cirrhosis and Ascites. Archives of Internal Medicine 1986;146(12):2407–2408.
  100. Nakamoto Y, Imai H, Hamanaka S, Yoshida K, Akihama T, Miura AB. IgM monoclonal gammopathy accompanied by nodular glomerulosclerosis, urine-concentrating defect, and hyporeninemic hypoaldosteronism. American Journal of Nephrology 1985;5(1):53–58.
  101. Yoshino M, Amerian R, Brautbar N. Hyporeninemic hypoaldosteronism in sickle cell disease. Nephron 1982;31(3):242–244.
  102. Kiley J, Zager P. Hyporeninemic Hypoaldosteronism in Two Patients With Systemic Lupus Erythematosus. American Journal of Kidney Diseases 1984;4(1):39–43.
  103. Masud T, Winocour P, Clarke F. Reversible hyporeninaemic hypoaldosteronism and life-threatening cardiac dysrhythmias: The interaction of non-steroidal anti-inflammatory drugs and autonomic dysfunction. Postgraduate Medical Journal 1993;69(813):593–594.
  104. Motoo Y, Sawabu N, Takemori Y, Ohta H, Okai T, Ikeda K, Yokoyama H. Long-Term Follow-Up of Mitomycin C Nephropathy. Internal Medicine 1994;33(3):180–184.
  105. Sunderlin FF, Anderson GH, Streeten DHP, Blumenthal SA. The renin-angiotensin-aldosterone system in diabetic patients with hyperkalemia. Diabetes 1981;30(4):335–340.
  106. Deleiva A, Christlieb AR, Melby JC, Graham CA, Day RP, Luetscher JA, Zager PG. Big Renin and Biosynthetic Defect of Aldosterone in Diabetes Mellitus. New England Journal of Medicine 1976;295(12):639–643.
  107. FitzGerald GA, Hossmann V, Hummerich W, Konrads A. The renin - kallikrein - prostaglandin system: Plasma active and inactive renin and urinary kallikrein during prostacyclin infusion in man. Prostaglandines and Medicine 1980;5(6):445–456.
  108. Ulick S, Wang JZ, Morton DH. The biochemical phenotypes of two inborn errors in the biosynthesis of aldosterone. Journal of Clinical Endocrinology and Metabolism 1992;74(6):1415–1420.
  109. Ulick S. Correction of the nomenclature and mechanism of the aldosterone biosynthetic defects. The Journal of Clinical Endocrinology & Metabolism 1996;81(3):1299–1300.
  110. Mitsuuchi Y, Kawamoto T, Miyahara K, Ulick S, Morton DH, Naiki Y, Kuribayashi I, Toda K, Hara T, Orii T, Yasuda K, Miura K, Yamamoto Y, Imura H, Shizuta Y. Congenitally defective aldosterone biosynthesis in humans: Inactivation of the P450C18 gene (CYP11B2) due to nucleotide deletion in CMO I deficient patients. Biochemical and Biophysical Research Communications 1993;190(3):864–869.
  111. Shizuta Y, Kawamoto T, Mitsuuchi Y, Miyahara K, Rösler A, Ulick S, Imura H. Inborn errors of aldosterone biosynthesis in humans. Steroids 1995;60(1):15–21.
  112. Geley S, Jöhrer K, Peter M, Denner K, Bernhardt R, Sippell WG, Kofler R. Amino acid substitution R384P in aldosterone synthase causes corticosterone methyloxidase type I deficiency. Journal of Clinical Endocrinology and Metabolism 1995;80(2):424–429.
  113. Pascoe L, Curnow KM, Slutsker L, Rosler A, White PC. Mutations in the human CYP11B2 (aldosterone synthase) gene causing corticosterone methyloxidase II deficiency. Proceedings of the National Academy of Sciences of the United States of America 1992;89(11):4996–5000.
  114. Zhang G, Rodriguez H, Fardella CE, Harris DA, Miller WL. Mutation T318M in the CYP11B2 gene encoding P450c11AS (aldosterone synthase) causes corticosterone methyl oxidase II deficiency. American Journal of Human Genetics 1995;57(5):1037–1043.
  115. Kuribayashi I, Kuge H, Santa RJ, Mutlaq AZ, Yamasaki N, Furuno T, Takahashi A, Chida S, Nakamura T, Endo F, Doi Y, Onishi S, Shizuta Y. A missense mutation (GGC[435Gly]→AGC[ser]) in exon 8 of the CYP11B2 gene inherited in Japanese patients with congenital hypoaldosteronism. Hormone Research 2003;60(5):255–260.
  116. Williams TA, Mulatero P, Bosio M, Lewicka S, Palermo M, Veglio F, Armanini D. A particular phenotype in a girl with aldosterone synthase deficiency. In: Journal of Clinical Endocrinology and Metabolism.Vol 89. J Clin Endocrinol Metab; 2004:3168–3172.
  117. Leshinsky-Silver E, Landau Z, Unlubay S, Bistrizer T, Zung A, Tenenbaum-Rakover Y, DeVries L, Lev D, Hanukoglu A. Congenital hyperreninemic hypoaldosteronism in Israel: Sequence analysis of CYP11B2 gene. Hormone Research 2006;66(2):73–78.
  118. Nguyen HH, Hannemann F, Hartmann MF, Wudy SA, Bernhardt R. Aldosterone synthase deficiency caused by a homozygous L451F mutation in the CYP11B2 gene. Molecular Genetics and Metabolism 2008;93(4):458–467.
  119. Løvås K, McFarlane I, Nguyen HH, Curran S, Schwabe J, Halsall D, Bernhardts R, Wallace AM, Chatterjee VKK. A novel CYP11b2 gene mutation in an asian family with aldosterone synthase deficiency. Journal of Clinical Endocrinology and Metabolism 2009;94(3):914–919.
  120. White PC. Aldosterone synthase deficiency and related disorders. In: Molecular and Cellular Endocrinology.Vol 217. Mol Cell Endocrinol; 2004:81–87.
  121. Rösler A. The natural history of salt-wasting disorders of adrenal and renal origin. Journal of Clinical Endocrinology and Metabolism 1984;59(4):689–700.
  122. Miao H, Yu Z, Lu L, Zhu H, Auchus RJ, Liu J, Jiang J, Pan H, Gong F, Chen S, Lu Z. Analysis of novel heterozygous mutations in the CYP11B2 gene causing congenital aldosterone synthase deficiency and literature review. Steroids 2019;150. doi:10.1016/j.steroids.2019.108448.
  123. Peter M, Partsch CJ, Sippell WG. Multisteroid analysis in children with terminal aldosterone biosynthesis defects. Journal of Clinical Endocrinology and Metabolism 1995;80(5):1622–1627.
  124. Ulick S. Cortisol as mineralocorticoid. The Journal of Clinical Endocrinology & Metabolism 1996;81(4):1307–1308.
  125. Klomchan T, Supornsilchai V, Wacharasindhu S, Shotelersuk V, Sahakitrungruang T. Novel CYP11B2 mutation causing aldosterone synthase (P450c11AS) deficiency. European Journal of Pediatrics 2012;171(10):1559–1562.
  126. Kondo E, Nakamura A, Homma K, Hasegawa T, Yamaguchi T, Narugami M, Hattori T, Aoyagi H, Ishizu K, Tajima T. Two novel mutations of the CYP11B2 gene in a Japanese patient with aldosterone deficiency type 1. Endocrine Journal 2013;60(1):51–55.
  127. Hui E, Yeung MCW, Cheung PT, Kwan E, Low L, Tan KCB, Lam KSL, Chan AOK. The clinical significance of aldosterone synthase deficiency: Report of a novel mutation in the CYP11B2 gene. BMC Endocrine Disorders 2014;14. doi:10.1186/1472-6823-14-29.
  128. Portrat-Doyen S, Tourniaire J, Richard O, Mulatero P, Aupetit-Faisant B, Curnow KM, Pascoe L, Morel Y. Isolated Aldosterone Synthase Deficiency Caused by Simultaneous E198D and V386A Mutations in the CYP11B2 Gene 1 . The Journal of Clinical Endocrinology & Metabolism 1998;83(11):4156–4161.
  129. Jessen CL, Christensen JH, Birkebæk NH, Rittig S. Homozygosity for a mutation in the CYP11B2 gene in an infant with congenital corticosterone methyl oxidase deficiency type II. Acta Paediatrica, International Journal of Paediatrics 2012;101(11). doi:10.1111/j.1651-2227.2012.02823.x.
  130. O’Kelly R, Magee F, McKenna J. Routine heparin therapy inhibits adrenal aldosterone production. Journal of Clinical Endocrinology and Metabolism 1983;56(1):173–176.
  131. Sequeira SJ, McKenna TJ. Chlorbutol, a new inhibitor of aldosterone biosynthesis identified during examination of heparin effect on aldosterone production. Journal of Clinical Endocrinology and Metabolism 1986;63(3):780–784.
  132. Zipser RD, Davenport MW, Martin KL, Tuck ML, Warner NE, Swinney RR, Davis CL, Horton R. Hyperreninemic hypoaldosteronism in the critically 111: A new entity. Journal of Clinical Endocrinology and Metabolism 1981;53(4):867–873.
  133. Davenport MW, Zipser RD. Association of hypotension with hyperreninemic hypoaldosteronism in the critically ill patient. Archives of internal medicine 1983;143(4):735–7.
  134. Cheek DB, Perry JW. A salt wasting syndrome in infancy. Archives of Disease in Childhood 1958;33(169):252–256.
  135. Speiser PW, Stoner E, New MI. Pseudohypoaldosteronism: a review and report of two new cases. Advances in experimental medicine and biology 1986;196:173–195.
  136. Zennaro MC, Fernandes-Rosa F. Mineralocorticoid receptor mutations. Journal of Endocrinology 2017;234(1):T93–T106.
  137. Zennaro MC, Lombès M. Mineralocorticoid resistance. Trends in Endocrinology and Metabolism 2004;15(6):264–270.
  138. Strautnieks SS, Thompson RJ, Gardiner RM, Chung E. A novel splice-site mutation in the γ subunit of the epithelial sodium channel gene in three pseudohypoaldosteronism type 1 families. Nature Genetics 1996;13(2):248–250.
  139. Geller DS, Rodriguez-Soriano J, Vallo Boado A, Schifter S, Bayer M, Chang SS, Lifton RP. Mutations in the mineralocorticoid receptor gene cause autosomal dominant pseudohypoaldosteronism type I. Nature Genetics 1998;19(3):279–281.
  140. Tajima T, Kitagawa H, Yokoya S, Tachibana K, Adachi M, Nakae J, Suwa S, Katoh S, Fujieda K. A novel missense mutation of mineralocorticoid receptor gene in one Japanese family with a renal form of pseudohypoaldosteronism type 1. Journal of Clinical Endocrinology and Metabolism 2000;85(12):4690–4694.
  141. Arai K, Tsigos C, Suzuki Y, Irony I, Karl M, Listwak S, Chrousos GP. Physiological and molecular aspects of mineralocorticoid receptor action in pseudohypoaldosteronism: a responsiveness test and therapy. The Journal of Clinical Endocrinology & Metabolism 1994;79(4):1019–1023.
  142. Zennaro MC, Borensztein P, Jeunemaitre X, Armanini D, Soubrier F. No alteration in the primary structure of the mineralocorticoid receptor in a family with pseudohypoaldosteronism. The Journal of Clinical Endocrinology & Metabolism 1994;79(1):32–38.
  143. Komesaroff PA, Verity K, Fuller PJ. Pseudohypoaldosteronism: molecular characterization of the mineralocorticoid receptor. The Journal of Clinical Endocrinology & Metabolism 1994;79(1):27–31.
  144. Arai K, Tsigos C, Suzuki Y, Listwak S, Zachman K, Zangeneh F, Rapaport R, Chanoine JP, Chrousos GP. No apparent mineralocorticoid receptor defect in a series of sporadic cases of pseudohypoaldosteronism. Journal of Clinical Endocrinology and Metabolism 1995;80(3):814–817.
  145. Viemann M, Peter M, López-Siguero JP, Simic-Schleicher G, Sippell WG. Evidence for genetic heterogeneity of pseudohypoaldosteronism type 1: Identification of a novel mutation in the human mineralocorticoid receptor in one sporadic case and no mutations in two autosomal dominant kindreds. Journal of Clinical Endocrinology and Metabolism 2001;86(5):2056–2059.
  146. Oberfield SE, Levine LS, Carey RM, Bejar R, New MI. Pseudohypoaldosteronism: multiple target organ unresponsiveness to mineralocorticoid hormones. The Journal of clinical endocrinology and metabolism 1979;48(2):228–34.
  147. Hanukoglu A, Omana J, Steinitz M, Rosler A, Hanukoglu I. Pseudohypoaldosteronism due to renal and multisystem resistance to mineralocorticoids respond differently to carbenoxolone. Journal of Steroid Biochemistry and Molecular Biology 1997;60(1–2):105–112.
  148. Postel-Vinay MC, Alberti GM, Ricour C, Limal JM, Rappaport R, Royer P. Pseudohypoaldosteronism: Persistence of hyperaldosteronism and evidence for renal tubular and intestinal responsiveness to endogenous aldosterone. Journal of Clinical Endocrinology and Metabolism 1974;39(6):1038–1044.
  149. Hanukoglu I, Hanukoglu A. Epithelial sodium channel (ENaC) family: Phylogeny, structure-function, tissue distribution, and associated inherited diseases. Gene 2016;579(2):95–132.
  150. Dirlewanger M, Huser D, Zennaro MC, Girardin E, Schild L, Schwitzgebel VM. A homozygous missense mutation in SCNN1A is responsible for a transient neonatal form of pseudohypoaldosteronism type 1. American Journal of Physiology - Endocrinology and Metabolism 2011;301(3). doi:10.1152/ajpendo.00066.2011.
  151. Schaedel C, Marthinsen L, Kristoffersson AC, Kornfält R, Nilsson KO, Orlenius B, Holmberg L. Lung symptoms in pseudohypoaldosteronism type 1 are associated with deficiency of the α-subunit of the epithelial sodium channel. Journal of Pediatrics 1999;135(6):739–745.
  152. Wang J, Yu T, Yin L, Li J, Yu L, Shen Y, Yu Y, Shen Y, Fu Q. Novel Mutations in the SCNN1A Gene Causing Pseudohypoaldosteronism Type 1. PLoS ONE 2013;8(6). doi:10.1371/journal.pone.0065676.
  153. Edelheit O, Hanukoglu I, Gizewska M, Kandemir N, Tenenbaum-Rakover Y, Yurdakök M, Zajaczek S, Hanukoglu A. Novel mutations in epithelial sodium channel (ENaC) subunit genes and phenotypic expression of multisystem pseudohypoaldosteronism. Clinical Endocrinology 2005;62(5):547–553.
  154. Gründer S, Firsov D, Chang SS, Jaeger NF, Gautschi I, Schild L, Lifton RP, Rossier BC. A mutation causing pseudohypoaldosteronism type 1 identifies a conserved glycine that is involved in the gating of the epithelial sodium channel. EMBO Journal 1997;16(5):899–907.
  155. Edelheit O, Hanukoglu I, Shriki Y, Tfilin M, Dascal N, Gillis D, Hanukoglu A. Truncated beta epithelial sodium channel (ENaC) subunits responsible for multi-system pseudohypoaldosteronism support partial activity of ENaC. Journal of Steroid Biochemistry and Molecular Biology 2010;119(1–2):84–88.
  156. Hanukoglu A, Edelheit O, Shriki Y, Gizewska M, Dascal N, Hanukoglu I. Renin-aldosterone response, urinary Na/K ratio and growth in pseudohypoaldosteronism patients with mutations in epithelial sodium channel (ENaC) subunit genes. Journal of Steroid Biochemistry and Molecular Biology 2008;111(3–5):268–274.
  157. Saxena A, Hanukoglu I, Saxena D, Thompson RJ, Mark Gardiner R, Hanukoglu A. Novel mutations responsible for autosomal recessive multisystem pseudohypoaldosteronism and sequence variants in epithelial sodium channel α-, β-, and γ-subunit genes. Journal of Clinical Endocrinology and Metabolism 2002;87(7):3344–3350.
  158. Adachi M, Tachibana K, Asakura Y, Abe S, Nakae J, Tajima T, Fujieda K. Compound Heterozygous Mutations in the γ Subunit Gene of ENaC (1627delG and 1570-1G→A) in One Sporadic Japanese Patient with a Systemic Form of Pseudohypoaldosteronism Type 1. The Journal of Clinical Endocrinology & Metabolism 2001;86(1):9–12.
  159. Nobel YR, Lodish MB, Raygada M, del Rivero J, Faucz FR, Abraham SB, Lyssikatos C, Belyavskaya E, Stratakis CA, Zilbermint M. Pseudohypoaldosteronism type 1 due to novel variants of SCNN1B gene. Endocrinology, Diabetes and Metabolism Case Reports 2016;2016. doi:10.1530/EDM-15-0104.
  160. Riepe FG, Krone N, Morlot M, Ludwig M, Sippell WG, Partsch CJ. Identification of a novel mutation in the human mineralocorticoid receptor gene in a german family with autosomal-dominant pseudohypoaldosteronism type 1: Further evidence for marked interindividual clinical heterogeneity. Journal of Clinical Endocrinology and Metabolism 2003;88(4):1683–1686.
  161. Riepe FG, Krone N, Morlot M, Peter M, Sippell WG, Partsch CJ. Autosomal-Dominant Pseudohypoaldosteronism Type 1 in a Turkish Family Is Associated with a Novel Nonsense Mutation in the Human Mineralocorticoid Receptor Gene. Journal of Clinical Endocrinology and Metabolism 2004;89(5):2150–2152.
  162. Nyström AM, Bondeson ML, Skanke N, Mårtensson J, Strömberg B, Gustafsson J, Annerén G. A Novel Nonsense Mutation of the Mineralocorticoid Receptor Gene in a Swedish Family with Pseudohypoaldosteronism Type I (PHA1). Journal of Clinical Endocrinology and Metabolism 2004;89(1):227–231.
  163. Kanda K, Nozu K, Yokoyama N, Morioka I, Miwa A, Hashimura Y, Kaito H, Iijima K, Matsuo M. Autosomal dominant pseudohypoaldosteronism type 1 with a novel splice site mutation in MR gene. BMC Nephrology 2009;10(1). doi:10.1186/1471-2369-10-37.
  164. Sartorato P, Lapeyraque AL, Armanini D, Kuhnle U, Khaldi Y, Salomon R, Abadie V, di Battista E, Naselli A, Racine A, Bosio M, Caprio M, Poulet-Young V, Chabrolle JP, Niaudet P, de Gennes C, Lecornec MH, Poisson E, Fusco AM, Loli P, Lombès M, Zennaro MC. Different inactivating mutations of the mineralocorticoid receptor in fourteen families affected by type I pseudohypoaldosteronism. Journal of Clinical Endocrinology and Metabolism 2003;88(6):2508–2517.
  165. Riepe FG, Finkeldei J, de Sanctis L, Einaudi S, Testa A, Karges B, Peter M, Viemann M, Grötzinger J, Sippell WG, Fejes-Toth G, Krone N. Elucidating the underlying molecular pathogenesis of NR3C2 mutants causing autosomal dominant pseudohypoaldosteronism type 1. Journal of Clinical Endocrinology and Metabolism 2006;91(11):4552–4561.
  166. Hatta Y, Nakamura A, Hara S, Kamijo T, Iwata J, Hamajima T, Abe M, Okada M, Ushio M, Tsuyuki K, Tajima T. Clinical and molecular analysis of six Japanese patients with a renal form of pseudohypoaldosteronism type 1. Endocrine Journal 2013;60(3):299–304.
  167. Morikawa S, Komatsu N, Sakata S, Nakamura-Utsunomiya A, Okada S, Tajima T. Two Japanese patients with the renal form of pseudohypoaldosteronism type 1 caused by mutations of NR3C2. Clinical Pediatric Endocrinology 2015;24(3):135–138.
  168. Arai K, Nakagomi Y, Iketani M, Shimura Y, Amemiya S, Ohyama K, Shibasaki T. Functional polymorphisms in the mineralocorticoid receptor and amirolide-sensitive sodium channel genes in a patient with sporadic pseudohypoaldosteronism. Human Genetics 2003;112(1):91–97.
  169. Warnock DG. Accessory factors and the regulation of epithelial sodium channel activity. Journal of Clinical Investigation 1999;103(5):593.
  170. Rodríguez-Soriano J, Vallo A, Oliveros R, Castillo G. Transient pseudohypoaldosteronism secondary to obstructive uropathy in infancy. The Journal of Pediatrics 1983;103(3):375–380.
  171. Bizzarri C, Olivini N, Pedicelli S, Marini R, Giannone G, Cambiaso P, Cappa M. Congenital primary adrenal insufficiency and selective aldosterone defects presenting as salt-wasting in infancy: A single center 10-year experience. Italian Journal of Pediatrics 2016;42(1). doi:10.1186/s13052-016-0282-3.
  172. Geller DS. Mineralocorticoid resistance. Clinical Endocrinology 2005;62(5):513–520.
  173. Riepe FG. Clinical and Molecular Features of Type 1 Pseudohypoaldosteronism. Hormone Research 2009;72(1):1–9.
  174. Bogdanović R, Stajić N, Putnik J, Paripović A. Transient type 1 pseudo-hypoaldosteronism: Report on an eight-patient series and literature review. Pediatric Nephrology 2009;24(11):2167–2175.
  175. Adam WR. Hypothesis: A simple algorithm to distinguish between hypoaldosteronism and renal aldosterone resistance in patients with persistent hyperkalemia. Nephrology 2008;13(6):459–464.
  176. Kuhnle U, Guariso G, Sonega M, Hinkel GK, Hubl W, Armanini D. Transient pseudohypoaldosteronism in obstructive renal disease with transient reduction of lymphocytic aldosterone receptors. Hormone Research in Paediatrics 1993;39(3–4):152–155.

AIDS AND HPA Axis

ABSTRACT

The Acquired Immunodeficiency Syndrome (AIDS), caused by infection with the Human Immunodeficiency Virus Type-1 (HIV), is characterized by profound immunosuppression, particularly of the innate, and T-helper (Th) 1-directed immunity. AIDS causes multisystem dysfunction, including impairment of the hypothalamic-pituitary-adrenal (HPA) axis, a major system coordinating the resting state and the adaptive response to stress. This neuroendocrine axis consists of three components: the hypothalamus, the pituitary gland, and the adrenal cortex with its end-effector molecules, the glucocorticoids. AIDS/HIV influence the HPA axis directly, through modulation of the host immune activity and alterations of the cellular biological pathways via HIV-encoded proteins, as well as indirectly, through immunodeficiency-associated opportunistic infections and various side effects of the therapeutic compounds employed, including those used in the highly active antiretroviral therapy (HAART). In this chapter, the interaction between AIDS/HIV and the HPA axis is reviewed and discussed.

INTRODUCTION

Patients with Acquired Immunodeficiency Syndrome (AIDS), caused by infection with the Human Immunodeficiency Virus Type-1 (HIV), develop profound immunosuppression, particularly of their innate and T-helper (Th) 1-directed cellular immunity (1). These patients may also present with dysfunction of many organ systems, including the hypothalamic-pituitary-adrenal (HPA) axis (2). During the last 25 years, numerous reports have provided evidence for alterations of the HPA axis and its influence on target tissues in HIV-infected patients (Table 1). Indeed, AIDS has been associated with adrenalitis caused by opportunistic infections, adrenal dysfunction secondary to neoplastic infiltration into the adrenal cortices, and changes related to circulating cytokines and other bioactive molecules known to influence functions of the HPA axis (3). Glucocorticoid hormones secreted from the adrenal cortex act as end-effectors of the HPA axis and have strong anti-inflammatory effects (4). Thus, these hormones were considered for reversing HIV-mediated depletion of circulating CD4+ lymphocytes and slowing progression to AIDS, as well as to subside complications associated with HIV infection (5) (Table 2).

Table 1. Impact of HIV infection on the HPA Axis/Glucocorticoid/GR Signaling System

Manifestations

Virus-mediated

Treatment-mediated

Adrenalitis (Common) and adrenal insufficiency (Rare)

Ö


Pituitary (corticotroph) dysfunction

Ö


GR affinity-dependent generalized glucocorticoid resistance

Ö?


Modulation of glucocorticoid metabolism

Ö

Ö

Modulation of GR activity

Ö

Ö

AIDS-related insulin resistance/lipodystrophy syndrome

Ö

Ö

Fatigue/muscle wasting

Ö?


Table 2. Conditions/Manifestations in which Glucocorticoid Treatment is Considered in HIV-Infected Patients

Conditions/manifestations

Types of conditions/manifestations

AIDS-related lymphoma (Hodgkin and non-Hodgkin)

Complication

HIV-associated nephropathy

Complication

Kaposi sarcoma*

Complication

Appetite loss/fatigue

Complication

Opportunistic infections (mycobacterium tuberculosis, cryptococcus)

Complication

HIV-associated immune reconstitution inflammatory syndrome

Complication

Slowing of AIDS progression (increase of CD4+ counts)

Direct effect on HIV replication

*Acceleration of Kaposi sarcoma by glucocorticoids (110)


Although development of HIV vaccines targeting components of the viral particles is still challenging, establishment and clinical introduction of the highly active antiretroviral therapy (HAART) that employs combinatory use of the three different types of antiretroviral drugs, such as nucleoside and non-nucleoside analogues acting as reverse transcriptase inhibitors, non-peptidic viral protease inhibitors (PIs) and the compounds blocking entry of HIV to CD4+ lymphocytes, efficiently suppress HIV replication in infected patients and have dramatically improved clinical course and life expectancy of AIDS patients (6-9). However, the prolongation of lives with long-term use of the above antiretroviral agents have generated novel morbidities and complications, which influence the patients’ quality of life and add new risk factors for premature death. Central among them is the quite common AIDS-related insulin resistance and lipodystrophy syndrome (ARIRLS), which is characterized by a striking phenotype and marked metabolic disturbances that are reminiscent of Cushing syndrome (10). In agreement with above-indicated clinical background, acquired alterations in the sensitivity of tissues to glucocorticoids were originally hypothesized in AIDS patients, and this concept was further extended to other nuclear receptor (NR) family proteins. In addition, some PIs inhibit the cytochrome p450 enzyme CYP3A4, which is necessary to metabolize glucocorticoids into inactive forms (11). Thus, the pharmacologic action of glucocorticoids used in the AIDS patients treated with these compounds is pronounced due to slowing of their metabolism, and “iatrogenic” Cushing syndrome is subsequently developed in these patients (12).

AIDS patients frequently develop several different types of malignancies, such as lymphoma and Kaposi sarcoma, in part due to profound destruction of host immune system by HIV (13,14). Glucocorticoids are among the central compounds for the treatment of the patients harboring these malignancies (13,15). Glucocorticoids are also pivotal for the treatment of HIV-associated nephropathy, which is observed in about 10% of AIDS patients (16). Use of glucocorticoids is further considered for the patients with HIV-associated tuberculosis and other opportunistic infections as part of the immunoadjuvant therapy (17,18).

In this chapter, we will explain known interactions between HIV infection and the HPA axis, particularly focusing on glucocorticoid hormones. We also present our understanding on some emerging concepts of such interactions, and discuss their possible mechanisms and relevance to HIV pathogenesis. 

HPA AXIS AND GLUCOCORTICOID ACTIONS

Humans face unforeseen short- and long-term environmental changes called “stressors”, which can be external (e.g. excessive heat or cold, food deprivation, trauma and invasion by pathogens) or internal (e.g. hurtful memories, splachnic injuries, neoplasia’s) (19-22). To adapt to these changes, humans have the stress-responsive system, which senses such stressors through various peripheral sensory organs, processes them in the central nervous system (CNS), and adjusts the CNS and peripheral organ activities (19-22). The hypothalamic-pituitary-adrenal (HPA) axis with its end-effectors glucocorticoids is one of the two arms of this regulatory system, together with the locus caeruleus/norepinephrine-autonomic system and their end-effectors, norepinephrine and epinephrine (19,21,22). At baseline, activity of the HPA axis and circulating glucocorticoid levels are in a typical diurnal rhythm, reaching their zenith in the early morning and their nadir in the late evening in diurnal animals including humans through input from a circadian rhythm center, the suprachiasmatic nucleus (SCN), and they participate in the maintenance of internal homeostasis (20,23,24). Upon exposure to stressors, the HPA axis is liberated from this regular circadian rhythm, and is strongly activated to modulate many biological activities including those of the CNS, intermediary metabolism, immunity and reproduction via highly elevated circulating glucocorticoids (4,19-25). However, this stress-induced activation of the HPA axis may also exert an array of adverse effects when its response is not properly tailored to the stressful stimuli (25). For example, acute hyper-activation of the HPA axis has been associated with development of post-traumatic stress disorder, while chronic activation of the HPA axis, and consequently prolonged elevation of serum glucocorticoid levels, induce visceral-type obesity and insulin resistance/dyslipidemia, which are represented as metabolic syndrome (19,21-25).

The HPA axis consists of the hypothalamic PVN parvocellular corticotropin-releasing hormone (CRH)- and arginine vasopressin (AVP)-secreting neurons, the corticotrophs of the pituitary gland, and the adrenal gland cortex (3,21-24) (Figure 1A). The PVN neurons release CRH and AVP into the hypophyseal portal system located under the median eminence of the hypothalamus in response to stimulatory signals from higher brain regulatory centers (3,21-24). Secreted CRH and AVP reach the pituitary gland and synergistically stimulate secretion of the adrenocorticotropic hormone (ACTH) from corticotrophs (19,21-24,26). ACTH released into systemic circulation finally stimulates both production and secretion of glucocorticoids (cortisol in humans and corticosterone in rodents) from the zona fasciculata of the adrenal cortex (25). Secreted glucocorticoids modulate activity of virtually all organs and tissues to adjust their functions. In addition, these hormones suppress higher regulatory centers of the HPA axis, the PVN and the pituitary gland, ultimately forming a closed negative feedback loop that aims to reset the activated HPA axis and restore its homeostasis (19).

Figure 1. The HPA axis and intracellular actions of GR

Organization of the HPA Axis

The HPA axis consists of 3 components: the PVN of hypothalamus, the anterior pituitary gland and the adrenal cortex. Neurons residing in PVN produce CRH and AVP and release them into the pituitary portal vein under the control of upper centers, including the central circadian rhythm center, hypothalamic suprachiasmatic nucleus (SCN). Released CRH and AVP stimulate secretion of ACTH from corticotrophs of the anterior pituitary gland. ACTH then stimulates the production and secretion of glucocorticoids (cortisol in humans and corticosterone in rodents) from adrenocortical cells located in zona fasciculata of the adrenal gland. Circulating glucocorticoids suppress upper regulatory centers including PVN and pituitary gland, forming a closed regulatory loop.

Intracellular Actions of GR

In the absence of glucocorticoids, GR resides in the cytoplasm forming a heterocomplex with several heat shock proteins (HSP). Upon binding to glucocorticoids, GR releases HSPs and translocates into the nucleus. In the nucleus, GR directly binds its specific sequence called glucocorticoid response elements (GREs) located in the promoter/enhancer region of glucocorticoid-responsive genes as a homodimer, and stimulates transcription by attracting many transcriptional cofactors and the RNA polymerase II complex. GR also modulates transcriptional activity of other transcription factors through physical protein-protein interaction without associating directly to DNA. After regulating transcription of glucocorticoid-responsive genes, GR moves back into the cytoplasm with help of the nuclear export system and returns to its ligand friendly condition by reforming a heterocomplex with HSPs. This complex regulatory system for the GR intracellular activity is sensitive to many inputs from other intracellular regulatory systems in order to adjust net GR actions upon local needs. [modified from (27)]

Infection of pathogens including HIV potently activates the HPA axis and induces subsequent secretion of glucocorticoids from the adrenal cortex (28,29). Pathogens generally stimulate central part of this regulatory system (e.g., brain hypothalamus and pituitary corticotrophs) directly with their structural and genetic components, and indirectly with cytokines and inflammatory mediators, such as the tumor necrosis factor a (TNFa), interleukin (IL)-1 and IL-6, secreted from activated immune cells and/or infected tissues (30). Secreted glucocorticoids in turn subside inflammation, functioning as a counter regulatory mechanism for otherwise overshooting immune response (31). Glucocorticoids do this mainly by suppressing release of humoral inflammatory mediators, granulocyte migration, cellular immunity and production of Th1 cytokines, such as IL-12, TNFa and the interferon (IFN) g, while they stimulate humoral immunity and secretion of Th2-inducing anti-inflammatory cytokines, including IL-4, IL-10 and the transforming growth factor b (4,32,33).

Glucocorticoids exert profound influences on many physiologic functions by virtue of their diverse roles in growth, development, and maintenance of cardiovascular, metabolic and immune homeostasis (4,34,35). Excess amounts of glucocorticoids have strong effects on intermediary metabolism, developing insulin resistance/overt diabetes mellitus and hyperlipidemia (especially triglycerides and free fatty acids) through modulation of their broad target regulatory systems/molecules (4). As glucocorticoids possess potent anti-inflammatory and immunosuppressive activities, they are used as invaluable therapeutic means in inflammatory and autoimmune diseases (36). In addition, glucocorticoids are central components of the anti-cancer treatment especially for hematologic malignancies, such as leukemia and lymphoma (4).

Glucocorticoids exert their effects on their target cells through the glucocorticoid receptor (GR), a ligand-specific and -dependent transcription factor, ubiquitously expressed in almost all tissues and cells (21-24,28). There are two 3’ splicing variants, GRa and GRb, through alternative use of a different terminal exon termed 9a or 9b. GRa is the classic glucocorticoid receptor, which binds glucocorticoids and transactivates or transrepresses glucocorticoid-responsive genes (37). GRa shuttles between the cytoplasm and the nucleus; Binding of glucocorticoids to GRa causes it to dissociate from the cytoplasmic hetero-oligomer containing heat shock proteins and to translocate into the nucleus through the nuclear pore (28) (Figure 1B). Ligand-bound and nucleus-translocated GRa binds as a homo-dimer to specific DNA sequences called glucocorticoid response elements (GREs) located in the promoter/enhancer regions of glucocorticoid-responsive genes to modulate their transcription (28). On the other hand, GRb does not bind glucocorticoids and functions as a dominant negative inhibitor of GRa on GRE-containing glucocorticoid-responsive promoters, together with its intrinsic transcriptional activity on the genes not related to glucocorticoid transcriptional activity (37,38). However, its physiologic and pathophysiologic roles have not been fully determined as yet (37).

The GRE-bound GR (hereafter for GRa) attracts to the promoter regions of glucocorticoid-responsive genes numerous “coactivator complexes”, including those with histone acetyltransferase (HAT) activity, such as the NR coactivator [p160, p300/CREB-binding protein (CBP) and p300/CBP-associated factor (p/CAF)] complex, the SWI/SNF and the vitamin D receptor-interacting protein/thyroid hormone receptor-associated protein (DRIP/TRAP) chromatin-remodeling complexes (39). Among them, p160-type NR coactivators bind first to the ligand-activated and DNA-bound GR through their coactivator LxxLL motifs, and attract other coactivators and chromatin modulatory complexes including p300/CBP to the promoter/enhancer region of glucocorticoid-responsive genes. Through these proteins and protein complexes, GR alters chromatin structure and facilitates access of other transcription factors, RNA polymerase II and its ancillary factors to the promoter region of glucocorticoid-responsive genes, and ultimately changes their transcription rates (28). In addition to these protein molecules, recent research identified that several long non-protein-coding RNA molecules, such as the steroid receptor RNA coactivator (SRA) and the growth arrest-specific 5 (Gas5), regulate the transcriptional activity of GR (40,41).

Complexity of the GR-signaling system residing in glucocorticoid target organs/tissues suggests that it provides potential regulatory “windows” to the GR-induced transcriptional network, which further indicates that glucocorticoid activity is under the tight regulation of numerous factors to adjust its activity upon local needs (25,28) (Figure 1B). This peripheral modulation of the glucocorticoid-signaling system is referred to as “sensitivity of tissues to glucocorticoids”, which determines effectiveness of circulating glucocorticoids in local tissues (30). Depending on its directions -decreased or increased-, it is categorized into two subgroups; resistance and hypersensitivity. Both states may be generalized or tissue-specific, as well as congenital or acquired. The generalized, congenital form of glucocorticoid resistance, namely the familial/sporadic glucocorticoid resistance syndrome or Chrousos syndrome, was described and established approximately 30 years ago (42-45). It is characterized by partial, relatively well-compensated resistance of all tissues to glucocorticoids and is mostly caused by inactivating mutations in the GR gene (42-45). On the other hand, tissue-specific, acquired forms of glucocorticoid resistance/hypersensitivity have been inferred but not fully confirmed or elucidated (46). Such states may be limited to certain tissues, as for instance leukocytes or adipocytes, and present with the manifestations associated with deficiency or excess glucocorticoids specific to respective tissues (25). Allergic, inflammatory or autoimmune diseases, such as glucocorticoid resistant asthma, Crohn’s disease, rheumatoid arthritis and systemic lupus erythematosus, may be glucocorticoid resistant states found in the components of the immune system (25,46). Conditions associated with chronic deprivation of energy resources, such as severe lean and anorexia nervosa, are considered as glucocorticoid resistance specific in the liver, fat and/or muscles, in part through activation of several kinases including the AMP-activated protein kinase and subsequent cytoplasmic segregation of a newly-identified GR coactivator, the CREB-regulated transcription coactivator 2 and/or induction of the repressive molecules, such as the RNA corepressor Gas5 (41,46-49). In contrast, the conditions associated with excess energy resources, such as central obesity-associated insulin resistance, hyperlipidemia and hypertension, may be glucocorticoid hypersensitivity states in adipose and/or vascular tissues (46).

INTERACTION OF THE HPA AXIS AND HIV INFECTION

Pathologic Conditions Associated with the Adrenal Glands in AIDS Patients

The adrenal gland is one of the organs frequently found damaged by HIV infection at autopsy, mostly caused by the opportunistic infection of other pathogens due to immunodeficiency of AIDS patients (50-52). Incidence of adrenalitis has significantly dropped recently, because the immune function of AIDS patients is much better preserved and the incidence of opportunistic infection has been dramatically reduced due to introduction of HAART (53). Pathologic findings of AIDS-associated adrenalitis are intra-adrenal inflammatory lesions with or without necrosis, thrombosis, and/or fibrosis, as well as metastases of Kaposi sarcoma. Cytomegalovirus adrenalitis is the most common cause of the adrenal insufficiency seen in AIDS patients (51,52), while cryptococcus, mycobacteria, histoplasma, Toxoplasma gondii, and Pneumocystis carinii also affect the adrenal glands (50,53,54). Pathologic findings vary from mild focal inflammation to extensive hemorrhagic necrosis. Although several cases with extensive adrenal necrosis and profound adrenal dysfunction have been reported (55-57), infectious adrenalitis does not usually cause clinical adrenal insufficiency in most of the AIDS patients (2). Indeed, 17% of 74 hospitalized AIDS patients demonstrated abnormal response of serum cortisol against ACTH injection in one early study, whereas only 4% of these patients developed adrenal insufficiency (58). However, a report on 60 advanced AIDS patients with less than 50 cells/ml of peripheral CD4+ lymphocyte counts demonstrated that over 25% of these patients had abnormally low and high levels of respectively serum cortisol and plasma ACTH, reduced excretion of urinary free cortisol and/or blunted response of serum cortisol to exogenous ACTH (59). Thirty-eight (63.3%) patients had cytomegalovirus antigenemia. Furthermore, 16 out of the 36 patients followed up for at least one year developed overt adrenal insufficiency and half of them were treated with corticosteroid replacement. In conclusion, pathologic findings of the adrenal glands are frequently encountered at autopsy, yet these are mild and are not associated with overt primary adrenal insufficiency in the majority of cases. Presence of adrenal insufficiency, and hence, glucocorticoid replacement therapy should be considered in some end-stage AIDS patients with special caution. Indeed, one fatal case with severe adrenal insufficiency due to cytomegalovirus infection even under the treatment with pharmacologic doses of glucocorticoids was reported (60).

Change of the HPA Axis/Pituitary Gland in AIDS Patients

           
Because the adrenal glands are frequently affected in AIDS patients and common manifestations of these patients, such as weakness, fatigue and body weight loss, mimic those of adrenal insufficiency, many studies have examined basal and/or reserve activity of the HPA axis (2,61-63). A majority of publications indicates that basal levels of serum cortisol and plasma ACTH are normal or slightly elevated and their circadian rhythm is preserved in AIDS patients (54,64-68). Elevations of serum cortisol have been reported both in the early stages of AIDS and in severely affected, terminal patients (63,69,70). Twenty four-hour urinary free cortisol excretion was increased depending on severity of the AIDS-associated manifestations (71). The adrenocortical reserve capacity evaluated with a standard ACTH stimulation test is preserved in the majority of patients, while it is reduced in advanced cases (59). In a large study of 350 patients with HIV infection, 30.9% of participants displayed serum cortisol levels below 100 µg/L with a median value of 55.48 µg/L (11.36-99.96 µg/L); however, only 16.3% of participants had stimulated serum cortisol levels below 180 µg/L with median of 118 µg/L (19.43-179.62) (60). Importantly, the authors found a high prevalence of hypocortisolism among HIV patients, especially in those who had been on ART for a longer time (72). Secretion of ACTH in response to CRH is blunted, especially in terminal-stage AIDS patients (62,63,73,74). Altered profiles of circulating cytokines are suggested as a cause of low responsiveness of the pituitary gland to CRH (62). Significant blunting of the ACTH response in AIDS patients was also reported in the cold immersion stress test (66).

Focal to widespread necrosis and/or fibrosis of the anterior pituitary gland was observed at autopsy in 10 out of the 88 AIDS patients; 5 showed apparent signs of cytomegalovirus infection in the absence of apparent inflammatory reaction, and one demonstrated severe cryptococcus infection (75). Based on the above evidence, it appears that the function of the pituitary gland (corticotrophs) for secretion of ACTH is generally preserved in AIDS patients. Hyponatremia and hypovolemia observed in AIDS patients at the end-stage of their disease is likely to be a result of the adrenal insufficiency due to dysfunction of the adrenal gland caused by specific adrenal lesions, such as infectious adrenalitis or neoplastic infiltration (51).

GLUCOCORTICOIDS IN THE TREATMENT OF AIDS PATIENTS

Protease Inhibitor-Mediated Inhibition of Glucocorticoid Metabolism and Development of Iatrogenic Cushing Syndrome

PIs, which inhibit activity of the viral-encoded protease and are widely used as part of HAART, act as inhibitors of one of the cytochrome P450 (CYP) enzymes, CYP3A4, which is necessary for metabolizing glucocorticoids into inactive forms in the liver (11). Ritonavir is the strongest suppressor of CYP3A4-mediated 6b-hydroxylation of steroids, while indinavir and nelfinavir are moderate suppressors and saquinavir is the weakest (11). All these PIs cause full-blown Cushing syndrome in AIDS patients treated even with inhaled or intranasal synthetic glucocorticoids (e.g., fluticasone, budesonide, mometasone and belclomethasone) by extremely reducing their metabolic clearance (12,76-82). Duration of the glucocorticoid-PI co-administration prior to the development of iatrogenic Cushing syndrome is highly variable, from 10 days to 5 years (mean: 7.1 years), while mean doses of administered glucocorticoids (e.g., fluticasone) are around 200-800 mg/day (mean: 400mg/day) in adults (12). Thus, glucocorticoids, even applied topically, should be used with caution in the patients treated with PIs. Changing ritonavir to other PIs or use of different classes of anti-viral drugs may help reducing this characteristic side effect.

Other Therapeutic Compounds That Potentially Affect Glucocorticoid Metabolism in AIDS Patients

Some other medications used for the treatment of AIDS patients are known to affect glucocorticoid metabolism and contribute to the development of adrenal insufficiency or Cushing syndrome. Ketoconazole, an anti-fungal compound frequently used for fungal skin infections especially in immunocompromised patients, such as those with HIV infection and those on chemotherapy, can suppress steroidogenesis by inhibiting the steroidogenic enzymes P450 side-chain cleavage enzyme and 17b-hydroxylase, and cause cortisol deficiency (83,84). This effect of ketoconazole is not observed with other similar compounds, such as fluconazole and itraconazole, and imidazole derivatives. Phenytoin and rifampicin, which are respectively an anticonvulsant and an antibiotic used for the treatment of tuberculosis, can accelerate cortisol metabolism, and thus, potentially cause adrenal insufficiency particularly in AIDS patients with reduced adrenal reserve (53). Megestrol acetate, a progesterone derivative also known as 17α-acetoxy-6-dehydro-6-methylprogesterone, is often used at relatively high doses to boost appetite and to induce weight gain in AIDS patients with cachexia (85). This compound has some glucocorticoid actions, therefore, causes glucocorticoid excess and subsequent adrenal insufficiency upon its withdrawal or under stress (86).

Potential Use of Glucocorticoids for Slowing AIDS Progression and Treatment of AIDS Complications

Current therapeutic regimens, including HAART, have enabled us to control viremia and viral replication in HIV-infected patients, and thus, have expanded their life expectancy significantly (6,8). However, these therapeutic regimens are expensive and their adherence rates are sometimes low (87-89). In addition, compounds used for the treatment of AIDS often have chronic toxic side effects, such as the characteristic AIDS-related insulin resistance and lipodystrophy syndrome (ARIRLS), which will be discussed in a later section, as well as mitochondrial toxicity, lactic acidosis, hepatotoxicity, and cardiomyopathy (90). Thus, other antiretroviral agents have been developed, including inhibitors of viral integrase, host CXCR4 and CCR5, and fusion of HIV to CD4+ lymphocytes (91). In addition to these compounds that directly interfere with viral activities, immunosuppressive agents, such as glucocorticoids and cyclosporine A, have been tested in HIV-infected patients, as these agents may suppress HIV-mediated immune activation, which is one of the major factors for AIDS progression and reduction of peripheral CD4+ lymphocytes (5,92-95); The synthetic glucocorticoid prednisone at 0.3-0.5 mg/kg/day successfully increases peripheral CD4+ lymphocyte counts and prevents their reduction for up to 10 years (5,96). It also suppresses circulating levels of TNFa and IL-6, known indicators of HIV-mediated host immune activation and possible causative agents for AIDS-associated wasting syndrome (92,97,98). These cytokines may also participate in HIV replication by potentiating Tat-mediated activation of the HIV long terminal repeat (LTR) promoter via stimulation of the nuclear factor-kB (NF-kB) (99). This beneficial effect of glucocorticoids is more obvious in patients whose immune system is less damaged (5,95). Glucocorticoids do not alter peripheral viral load in the patients who have already been treated with antiretroviral drugs, and thus, have low viral load before initiation of therapy (5,94,95). However, one case report indicated that high doses of prednisone (100 mg for 9 consecutive days) demonstrated extremely strong suppression on the circulating virus titer of the patient infected with multi-drug-resistant HIV (100). The synthetic glucocorticoid dexamethasone inhibits elimination of CD4+ lymphocytes by macrophages isolated from HIV-infected patients in vitro (101). Glucocorticoids reduce circulating mature monocytes in monkeys (sooty magabey) infected with the simian immunodeficiency virus, a model virus of HIV used in animal studies (102). These monocytes act as the HIV reservoirs due to their ability to transfer the virus to CD4+ lymphocytes and their relatively long life (103). Furthermore, reduced diurnal amplitude of circulating cortisol in HIV-infected patients is correlated with their greater T cell immune activation, which is a known risk factor for immunologic and clinical progression of AIDS (104). This evidence suggests that healthy diurnal cortisol production is beneficial for slowing down the AIDS progression. Thus, at treatment-naïve or equivalent states, glucocorticoids appear to inhibit viral replication by suppressing HIV-mediated inflammation, subsequent production of inflammatory cytokines and viral transmission from monocytes to CD4+ lymphocytes. However, glucocorticoids are also risk factors for AIDS-associated complications, including sarcopenia, osteoporosis and/or osteonecrosis of the hip, and are reported to accelerate development of human herpes virus-8 (HHV8)-associated Kaposi sarcoma in the patients with pleural tuberculosis, interstitial pneumonia and glomerulonephritis (105-113). Indeed, HHV8 encodes the latency-associated nuclear antigen (LANA), which functions as a coactivator of GR through direct physical interaction (114). Glucocorticoids are also risk factors for elective hip surgery (total hip arthroplasty and resurfacing), and may be a potential factor for the development of CD8 encephalitis in HIV-infected patients (111,115).


Thus, the therapeutic use of glucocorticoids in AIDS patients appears to be quite limited by several factors, particularly in the era of improved HAART, which can control viral replication with less side effects. Selective glucocorticoids or other non-steroidal compounds, with immunosuppressive actions but not metabolic side effects, might be beneficial in the treatment of AIDS patients. Indeed, some of such compounds (e.g., Compound Abbott-Ligand (AL)-438, ZK216348 and the hydroxyl phenyl aziridine precursor analogue Compound A) are under investigation for their selective glucocorticoid effects (116) (please see Endotext chapter in the Adrenal Diseases and Function section entitled “Glucocorticoid Receptor”).

In addition to the effect on circulating CD4+ lymphocyte counts, glucocorticoids act as central components in the treatment regimens for HIV-associated lymphoma (such as Hodgkin and non-Hodgkin lymphoma and latter’s subtypes Burkitt lymphoma and plasmablastic lymphoma), multi-centric, HHV8-associated Castleman’s disease (also known as giant or angiofollicular lymph node hyperplasia, lymphoid hamartoma, angiofollicular lymph node hyperplasia) and HIV-associated nephropathy (13,16,117-120). Glucocorticoids are also used to subside some complications of opportunistic infections, such as those by Pneumocystis carinii and mycobacteria (pleuritis and pericarditis), and those associated with immune reconstitution inflammatory syndrome (IRIS), which sometimes happens in AIDS patients upon recovery of their immune system with antiretroviral treatment (121-124). One clinical study examining the beneficial effects of glucocorticoids for the treatment of AIDS-associated cryptococcal meningitis was performed (18). Moreover, a recent double-blind, placebo-controlled, cross-over study investigated the effects of a single low-dose administration of hydrocortisone (10 mg oral) on cognition in 36 HIV-infected women (125). The authors found that this low dose had beneficial effects in verbal learning and delayed memory, working memory, visuospatial abilities and behavioral inhibition (125). Further larger studies are clearly needed to verify these promising results. Finally, glucocorticoids are prescribed empirically for AIDS patients to treat their fatigue and appetite loss (126-130).

Adverse Effects of the Contraceptive Medroxyprogesterone Acetate for Increasing the Chance of HIV Infection through GR Activation

It is important for the HIV endemic area whether contraceptives increase/reduce the chance of HIV infection, therefore several clinical studies were previously performed to address this possibility (131). These compounds, regularly mixtures of progestins and estrogens, stimulate the progesterone (PR) and estrogen receptor for mimicking the hormonal profiles of pregnancy (132). There are 2 types of contraceptives with regard to their routes of administration; injection and oral intake (131). Recent studies revealed that one of the injectable contraceptives, medroxyprogesterone acetate (MPA), a compound widely used in sub-Saharan Africa, increases a chance of HIV infection particularly in young women with high exposure to this virus (131). Subsequent research revealed that MPA can bind GR in addition to PR with high affinity in contrast to other progestins, such as progesterone and norethisterone acetate, and strongly suppresses inflammatory response in endocervical cells by activating local GR (131,133). Moreover, medroxyprogesterone acetate was found to increase HIV-1 replication in human peripheral blood mononuclear cells through mechanisms involving the glucocorticoid receptor, increased CD4/CD8 ratios and CCR5 levels (134). Further, this compound enhances Vpr-mediated apoptosis of human CD4+ lymphocytes by cooperating with GR, which further affects clinical course of HIV-infected patients (133).


GLUCOCORTICOIDS RESISTANCE/HYPERSENSITIVITY ASSOCIATED WITH AIDS PATIENTS

Glucocorticoid Resistance with Reduced GR Affinity to its Ligands

Norbiato et al. reported a distinct subgroup of AIDS patients who showed apparent adrenal insufficiency with fatigue, weakness, body weight loss, hypotension, and skin and mucosal hyperpigmentation associated with markedly elevated levels of serum cortisol and moderately increased levels of plasma ACTH (135). In these patients, affinity of the GR to its ligand was markedly decreased in peripheral leukocytes with concurrent elevations of receptor numbers, suggesting that the apparent adrenal insufficiency seen in these patients might be caused by decreased sensitivity of peripheral tissues to glucocorticoids. This research group estimated that up to 17 % of AIDS patients are likely to have altered GR actions (136).

Pathologic mechanism(s) underlying this characteristic condition with markedly reduced receptor affinity has(have) not been elucidated as yet. A similar glucocorticoid resistance state associated with reduced receptor affinity was previously reported in glucocorticoid resistant asthma patients. In the latter patients, the affinity change is limited to immune tissues, such as peripheral leukocytes, and is progressively reverted to normal when cells are incubated ex vivo (137). Since incubation of patients’ peripheral lymphocytes with IL-2 and IL-4 preserves the decrease in receptor affinity (137,138), and since elevation of these cytokine levels is generally observed in asthma patients (139), it is likely that cytokine-related mechanisms are involved in the development/maintenance of the receptor affinity change observed in AIDS patients. It was subsequently reported that glucocorticoid resistant asthma was also associated with increased expression of the GRb isoform, suggesting that this splicing variant receptor might participate in the pathogenesis of the glucocorticoid resistance of AIDS patients as well (140). Because many kinases and other molecules important for the cytokine and growth factor signaling potentially modulate GR activity (28,30), and cytomegalovirus alters GR transcriptional activity by phosphorylating this receptor through activation of the extracellular signal-regulated kinases (141), it is possible that some of such molecules might also contribute to the alteration of the receptor affinity in AIDS patients.

The exact prevalence of this glucocorticoid resistance associated with reduced receptor affinity observed in AIDS patients is not known. Although similar patients were reported by another group just after appearance of the initial cases (142), very few reports followed subsequently, suggesting that this characteristic AIDS-related pathologic condition may be rare and/or associated with some special condition of AIDS patients, which may be disappeared after introduction of HAART. In this instance, severe uncontrollable immune dysregulation and/or inflammation by HIV observed at an early and/or specific period may be required for developing this characteristic phenotype. 

In late ’90s, an acquired form of lipodystrophy, which partially mimics the clinical presentation of Cushing syndrome, was reported in AIDS patients (10,143-146). The patients had a characteristic redistribution of their adipose tissue, with an enlargement of their dorsocervical fat pad (“buffalo hump”), axial fat pads (bilateral symmetric lipomatosis), lipomastia, and expansion in their abdominal girth ("Crix-belly" or "protease paunch") [lipohypertrophy in trunk and abdomen]. Since these manifestations are reminiscent of the typical phenotype of chronic glucocorticoid excess or Cushing syndrome, this condition was initially referred as a pseudo-Cushing state, a term reserved for obese, depressive or alcoholic patients with biochemical hypercortisolism who are frequently hard to differentiate from true Cushing syndrome (31). In addition to these initial characteristic manifestations, some patients develop lipoatrophy in face, buttocks and limbs (147). Furthermore, they frequently demonstrate metabolic complications, such as severe insulin resistance, hyperlipidemia and hepatic steatosis, similar to some of the congenital lipodystrophy syndromes (29,46,147). Taken together, this AIDS-related characteristic syndrome has 3 major components in its manifestations, lipohypertrophy, lipoatrophy and metabolic complication, such as insulin resistance and dyslipidemia.

Pathologic causes of ARIRLS are not known, but appear to be multifactorial. ARIRLS patients demonstrate manifestations shared with or district from those of other lipodystrophies unrelated to HIV infection, suggesting that it is caused by the pathologic mechanisms somewhat different from the latter conditions (148). Alteration of the HPA axis and/or the glucocorticoid/GR signaling system appear(s) to be involved in the development of certain part of this syndrome, as we will discuss below. 

Factors Contributing to the Development of ARIRLS

ANTIRETROVIRAL DRUGS

Protease Inhibitors (PIs)

Possible mechanisms contributing to this characteristic syndrome are listed in Table 3 and summarized in Figure 2. As several previous reports indicated, one of the earlier suggestions was that the syndrome was outcome of adverse effects of antiretroviral drugs including PIs, nucleoside reverse transcriptase inhibitors (NRTIs) and/or non-nucleoside reverse transcriptase inhibitors (NNRTIs) (147,149). PIs interfere with viral replication by efficiently inhibiting the activity of the viral-encoded protease, which normally digests the Gag-Pol p160 kDa precursor protein, producing several polypeptide fragments with distinct functions (149,150). NRTIs and NNRTIs, on the other hand, inhibit viral replication by suppressing the activity of the reverse transcriptase also encoded by HIV (149). The effects of various antiretroviral drugs on the development of lipodystrophy and metabolic complications are listed in Table 4. Since prototype drugs were significantly associated with the development of ARIRLS, new compounds with less association were subsequently developed.

Figure 2. Major proposed mechanisms in the genesis of ARIRLS. Three major components, antiretroviral drugs, viral factors and host factors differentially contribute to the development of ARIRLS by respectively modulating adipogenesis, lipogenesis, and tissue insulin action through induction of/responsiveness to inflammatory cytokines, damage to adipocytes (e.g. by mitochondrial toxicity and reactive oxygen species) and/or through modulation of host cellular mechanisms, such as NR (GR, PPAR, PXR and LXR) signaling systems and inhibition/modulation of p450 enzyme activity (such as CYP3A and steroidogenic enzymes). Some changes can also alter tissue glucocorticoid action (glucocorticoid sensitivity) through expression of the GR and/or 11bHSD1 that converts inactive cortisone to active cortisol. As sum of these changes, major manifestations, lipohypertrophy, lipoatrophy and insulin resistance/dyslipidemia are finally developed in which modulation of the glucocorticoid metabolism/signaling system play a significant part. Their specific actions on visceral and subcutaneous fat may contribute to the development of lipohypertrophy and lipoatrophy in different body areas. [from (29,46,147,151)]

Table 3. Potential Contributing Factors to AIDS-Related Insulin Resistance and Lipodystrophy Syndrome (ARIRLS) Before and After Treatment with Antiretroviral Drugs


Before Rx

After Rx

Nonspecific, disease-related


Sickness-related starvation

+

Refeed

Sickness-related change in body composition

Lean body mass loss*

Fat mass gain*

Infection-induced hypercytokinemia

+


Cytokine-induced adipose tissue 11bHSD1 stimulation

+

-

Stress- and starvation-induced hypercortisolism          

+

-

Specific, HIV-related


Virally-induced muscle, liver, and fat glucocorticoid hypersensitivity

+

+

Virally-induced adipose tissue PPARg inhibition

+

+

Virally-induced adipose tissue 11bHSD1 stimulation

+

+

Antiretroviral drug-related


Rx-induced-insulin resistance/dyslipidemia

-

+

Alteration of glucocorticoid clearance through hepatic CYP3A inhibition

-

+

Modulation of NR activity (PXR and LVR) by acting as ligands

-

+

Genetic/constitutional predisposition      

+

+

+: presence, -: absence, ?: unknown, * During stress and starvation, both fat and lean body mass are lost. Post stress and starvation body weight gain is primarily due to fat accumulation. 

Table 4. Differential Effects of Antiretroviral Drugs on Fat and Metabolism Associated with AIDS-Related Insulin Resistance and Lipodystrophy Syndrome (ARIRLS)*

Class of drugs

Name of drug

Abbreviation

Lipo-atrophy

Lipo-hypertrophy

Dyslipidemia

Insulin

resistance

PIs

Ritonavir

RTV

+/-

+

+++

++


Indinavir

IDV

+/-

+

+

+++


Nelfinavir

NFV

+/-

+

++

+


Lopinavir

LPV

+/-

+

++

++


Amprenavir Fosamprenavir

APV FPV

+/-

+

+

+/-


Saquinavir

SQV

+/-

+

+/-

+/-


Atazanavir

ATV

-

++

+/-

-


Darunavir

DRV

-

+

+/-

+/-


NRTIs

Stavudine

D4T

+++

++

++

++


Zidovudine

AZT, ZDV

++

+

+

++


Didanosine

ddI

+/-

+/-

+

+


Lamivudine

3TC

-

-

+

-


Abacavir

ABC

-

-

+

-


Tenofovir

TDF

-

-

-

-


Emtricitabine

FTC

-

-

-

-


NNTRIs

Efavirenz

EFV

+/-

+/-

++, increased HDL

+


Nevirapine

NVP

-

-

++, increased HDL

_


CCR5 inhibitor

Maraviroc

MVC

?

?

-

-


Integrase inhibitor

Raltegravir

RAL

?

?

-

-


Fusion inhibitor

Enfuvirtide

T20

?

?

-

-

Modified from (147) (Permission for re-use was obtained from Elsevier with the license number: 3012541054207)

* These data should be considered with caution because discrepancies exist among studies that cannot be presented in one table. 

Mechanistically, PIs act as inhibitors of the CYP3A4 enzyme, which metabolizes and inactivates glucocorticoids as we discussed above (11). Thus, these compounds may slightly increase circulating levels of endogenously produced cortisol by reducing its clearance in the liver, and participate in the development of ARIRLS. PIs also decrease hepatic lipase activity and modulate differentiation of pre-adipocytes (152-154). A possible underlying mechanism for this PI-mediated modulation of adipocyte activity is that these compounds change the expression levels of the peroxisome proliferation receptor (PPAR) g and the CAAT/enhancer-binding protein (C/EBP) a (148). PPARg is a NR family protein and acts as a pivotal regulator of glucose and lipid metabolism and development/differentiation of adipocytes (155). C/EBPa is a bZip family transcription factor, and plays also a key role in adipogenesis and adipocyte differentiation (156). In addition, PIs increase IL-6 and TNFa production by activating the NF-kB pathway in subcutaneous fat (157). These cytokines are known to play important roles in local inflammation and lipid accumulation in adipose tissue (158). The adverse effect of PIs may also result from induction of the endoplasmic reticulum stress or inhibition of the proteosomes (159,160).

NRTIs and NNRTIs

In addition to PIs, these classes of antiretroviral drugs are also associated strongly with development of ARIRLS. Among them, thymidine NRTI (tNRTI) stavudine and zidovudine cause severe lipoatrophy in AIDS patients, thus they were removed from the list of the first-line antiretroviral compounds in Western countries (161). These compounds demonstrate mitochondrial toxicity by inhibiting the mitochondrial DNA polymerase g, facilitating generation of the reactive oxygen species in adipose tissues and possibly causing lipoatrophy in AIDS patients (147). Although weak, NNRTIs, such as efavirenz and nevirapine, also have an activity to develop lipodystrophy and dyslipidemia (147).

Modulation of NR Activity by Antiretroviral Drugs

In addition to above-indicated potential actions of antiretroviral drugs on the development of ARIRLS, some of these compounds can modulate the transcriptional activity of several NRs, such as the pregnane X receptor (PXR), constitutive androstane receptor (CAR), liver X receptors (LXRs) and the estrogen receptor a (ERa), and directly stimulate their transcriptional activity. Interestingly, these antiretroviral drugs were demonstrated to act potentially as ligands for the receptors in in silico structural analysis on the ligand-binding pocket of these receptors (154). PXR and CAR act as xenobiotic sensing receptors and induce drug metabolizing enzymes with broad ligand specificity for many chemical compounds, and several PIs can stimulate CYP3A4 and CYP2B6 promoter activity through activation of these receptors (154). Activation of PXR, either by its known ligands or transgenic expression of PXR, increases production of glucocorticoids in the adrenal glands by stimulating expression of the steroidogenic enzymes, such as CYP11A, CYP11B1, CYP11B2 and 3b-hydroxysteroid dehydrogenase, and develops Cushingoid manifestations in rodents (162), suggesting that PIs may increase cortisol production and participate in the development of ARIRLS indirectly through activation of PXR. Furthermore, PIs (ritonavir, atazanavir and darunavir) and maraviroc (CCR5 antagonist) activate the transcriptional activity of LXRa and/or LXRb, while NNRTIs (tenofovir and efavirenz) stimulate ERa (but not ERb) (154). Since LXRs are the receptors for regulating cholesterol/fatty acid metabolism and insulin actions, activation of these receptors by antiretroviral drugs may underlie pathophysiology of ARIRLS (163). In addition, LXRs and ERa cooperate with GR for expression of glucocorticoid-responsive genes, thus it is likely that these antiretroviral drugs enhance glucocorticoid actions indirectly through stimulating these NRs (164,165).

VIRAL FACTORS

Although antiretroviral drugs are generally accepted for causing ARIRLS, a small percentage of HIV-infected patients develop characteristic features of this syndrome prior to their introduction; HIV-infected patients who are not receiving antiretroviral therapy often have lipid abnormality, including elevated triglyceride levels, a high proportion of small and dense LDL particles, and low HDL cholesterol levels, similar to ARIRLS patients (166). Furthermore, different classes of chemical compounds that target different components of HIV/adipocyte biological pathways can develop similar ARIRLS manifestations in AIDS patients (147). These pieces of evidence thus suggest that the HIV infection itself could nonspecifically, -in part via inflammatory cytokine elevations and stress induced cortisol hypersecretion-, induce an insulin resistant phenotype (31). Pro-inflammatory cytokines, such as TNFa, IL-1 and IL-6, which are released from the HIV-infected macrophages localized in adipose tissues, do cause resistance to insulin and fat accumulation in neighboring adipocytes (158). In addition, these cytokines indirectly activate GR in adipose tissues by stimulating expression of the 11b-hydroxysteroid dehydrogenase-1 (11bHSD1), which converts inactive cortisone into active cortisol (167). Moreover, increased expression of GR is also reported in subcutaneous fat of zidovudine-treated AIDS patients (168). In this context, antiretroviral drugs might just exacerbate already present, smoldering insulin resistance and lipodystrophy, not expressed because of the known malnutrition of sick AIDS patients and the absence of sufficient calories to build visceral and other fat deposits (10,30,169). As manifestations of the sickness syndrome subside with treatment, the emaciated patient goes through refeeding with body weight gain of mostly fat, tilting the ratio of fat to lean body mass upward, further worsening insulin resistance.

HIV, in its 9.8 kb genomic information, encodes and produces 3 precursor proteins, the Gag, RNA polymerase and envelope polypeptides, whose processed products are the reverse transcriptase, protease, integrase, matrix, and capsid, as well as 6 accessory proteins, Tat, Rev, Nef, Vif, Vpr and Vpu (170) (Figure 3). Some of these polypeptides are virion-associated proteins incorporated in the viral particle and others are expressed in host cells where they direct viral replication and gene expression and several host cell functions. Since infection with HIV has a dramatic impact on host target cells, it is quite possible that some of these viral proteins modulate host cell glucose and lipid metabolism by changing the activity of GR in local tissues, such as in adipose tissue, skeletal muscles and liver, and participate in the development of ARIRLS. Indeed, there are several pieces of evidence indicating that AIDS patients have altered tissue sensitivity to glucocorticoids. First of all, they all develop reduction of innate and Th1-directed cellular immunity. Levels of plasma IL-2, IL-12 and IFN-g, which direct cellular immunity, are suppressed in AIDS patients, while levels of IL-4 are increased (171,172). All changes can be induced by exogenously introduced glucocorticoids and are seen in hypercortisolemic patients with classic Cushing syndrome (173). AIDS patients also frequently present with muscle wasting and myopathy, as well as dyslipidemia and visceral obesity-related insulin resistance (174-176). Therefore, some unknown viral factor(s) might modulate tissue sensitivity to glucocorticoids in AIDS patients in a tissue-specific fashion, sparing their HPA axis preserving normal negative feedback sensitivity to glucocorticoids.

Figure 3. Lineralized structure of the HIV genome and localization of vpr and tat coding region (shown in black boxes). HIV, in its 9.8 kb genomic information, encodes and produces 3 precursor proteins, the Gag (gag), RNA polymerase (pol) and envelope polypeptides (env), whose processed products are the reverse transcriptase, protease, integrase, matrix, and capsid, as well as 6 accessory proteins, Tat, Rev, Nef, Vif, Vpr and Vpu. LTR: long terminal repeat [modified from (170,177)]

In agreement with these reported findings, one of the HIV proteins, Vpr, which is a 96-amino acid virion-associated accessory protein with multiple functions, including influencing transcriptional activity and having a cell cycle-arresting effect, increases the action of GR by several fold, functioning as a potent GR coactivator (178). The GR coactivator activity of Vpr is biologically evident in the suppression of IL-12 production from monocytes and the expression of activated NF-kB ligand (RANKL) in lymphocytes (179,180). Similar to host p160 type coactivators, Vpr contains one LxxLL coactivator motif through which it binds to the ligand-activated and promoter-bound GR (178). GR-bound Vpr then attracts p300/CBP, and ultimately potentiates the transcriptional activity of GR by acting as a molecular adaptor between GR and p300/CBP (177,181) (Figure 4). p300/CBP are HAT coactivators also known as integrators or regulatory “platforms” for many signal transduction cascades by providing docking sites for many transcription factors, including NRs, CRE-binding protein (CREB), activator protein-1 (AP-1), NF-kB and the signal transducers and activators of transcription (STATs) (182) (Figure 4). Vpr easily penetrates the cell membrane to exert its biologic effects (183,184), thus its effects may be extended to tissues not infected with HIV.

Figure 4. Linearized Vpr, Tat and p300 molecules and their mutual interaction domains. Vpr interacts with cellular molecules, such as NR, p300/CBP coactivators and 14-3-3, while Tat is physically associated with pTEFb elongation factor through its component Cyclin T1. Tat also binds p300/CBP and p160 type coactivators. Numerous transcription factors, transcriptional regulators and viral molecules bind the transcriptional coactivator p300. Binding sites of p160 NR coactivators and Vpr overlap with each other and they both bind NRs and p300/CBP. Thus, Vpr mimics the host p160 NR coactivators and enhances NR transcriptional activity. p300 facilitates attraction of transcription factors, cofactors and general transcription complexes by loosening the histone/DNA interaction through acetylation of histone tails by its histone acetyltransferase (HAT) domain. [modified from (29,30)]. CREB: CRE-binding protein, HAT: histone acetyltransferase, NF-kB: nuclear factor-kB, NR: nuclear hormone receptor, p/CAF: p300/CBP-associating factor, pTEFb: positive-acting transcription elongation factor b, Rb: retinoblastoma protein, SF-1: steroidogenic factor-1, STAT2: signal transducer and activator of transcription 2, TFIIB: transcription factor IIB.

Another HIV accessory protein, Tat, the most potent transactivator of the HIV long terminal repeat promoter, also moderately potentiates GR-induced transcriptional activity, possibly through accumulation of the positive-acting transcription elongation factor b (pTEFb) complex, that is comprised by the cyclin-dependent kinase 9 and its partner molecule cyclin T, on glucocorticoid responsive promoters (185) (Figure 4). Because Tat, like Vpr, also circulates in blood and exerts its actions as an auto/paracrine or endocrine factor by penetrating the cell membrane (186), it is possible that Tat modulates tissue sensitivity to glucocorticoids irrespectively of a cell’s infection by HIV. Concomitantly with Vpr, Tat may induce tissue hypersensitivity to glucocorticoids that might contribute to viral proliferation indirectly, by suppressing local immune system activity and by altering the host’s metabolic balance, with both functions being governed by glucocorticoids (30,46).

Vpr reduces tissue sensitivity to insulin not only through potentiating the actions of glucocorticoids, but also by modulating insulin’s transcriptional activity via interaction with the protein of the 14-3-3 family, which participates in the cell cycle arrest activity of Vpr (29,187). Insulin uses the forkhead transcription factors (FoxOs) to control gene induction; baseline unphosphorylated FoxOs are active, reside in the nucleus, and bind to their responsive sequences in the promoter region of insulin-responsive genes; in contrast, insulin activates Akt kinase, which phosphorylates specific serine and threonine residues of FoxOs rendering it inactive (188). Indeed, once FoxOs are phosphorylated at specific residues, they lose their transcriptional activity, by binding with 14-3-3 through phosphorylated residues and subsequently segregated into the cytoplasm (188). We found that Vpr moderately inhibited insulin-induced translocation of FoxO3a into the cytoplasm through inhibiting its association with 14-3-3 (187). Thus, Vpr may participate in the induction of insulin resistance by interfering with the insulin signaling through FoxOs/14-3-3 (29,151,177). 

We further found that Vpr-mediated insulin resistance might be compounded by the ability of the viral protein to interfere with the signal transduction of PPARg (183). Indeed, Vpr suppresses the c-Cbl associating protein (CAP) mRNA expression in pre-adipocyte cells and associated with the PPAR-binding site located in the promoter region of this gene. CAP is predominantly expressed in insulin-sensitive tissues and positively regulates insulin action, directly associating with both the insulin receptor and the c-Cbl proto-oncogene product (189). Vpr delivered either by exogenous expression or as a peptide added to media suppresses PPARg agonist-induced adipocyte differentiation (183). Thus, circulating Vpr, or alternatively Vpr produced as a consequence of direct infection of adipocytes, may suppress differentiation of preadipocytes by acting as a corepressor of PPARg-mediated gene transcription (29,183,190). We further found that Vpr regulates the transcriptional activity of PPARb/d as well, and alters cellular energy metabolism organized by mitochondria (191). Vpr disturbs the insulin signaling and induces hepatic steatosis by disrupting the transcriptional program of PPARs in the liver and adipose tissue in the animal models, such as the transgenic mice expressing Vpr specifically in these organ and tissue and the mice inoculated with the pump that continuously releases the synthetic Vpr peptide into circulation (192). Moreover, Vpr was demonstrated to induce fatty liver in mice via LXRα and PPARα dysregulation (193). Taken together, based on these pieces of evidence, Vpr may be a key factor for the development of lipodystrophy, insulin resistance and hyperlipidemia observed in HIV-infected patients through modulation of the GR/PPARs/LXR and FoxOs/14-3-3 activities.

HOST FACTORS

Several host factors may influence susceptibility and manifestation of ARIRLS. Variant alleles of APOC3, APOE contribute to an unfavorable lipid profile in patients with HIV infection, while application of antiretroviral therapy further worsens it (194). Another study identified that APOE polymorphism is also associated with the dyslipidemia seen in AIDS patients treated with PIs (195). One recent study demonstrated that polymorphisms of the genes involved in apoptosis and adipocyte metabolism are significantly related to the development of ARIRLS (196). Among the polymorphisms examined, ApoC3-455 variant is associated with lipoatrophy, while two variants of the adrenergic receptor b2 influence fat accumulation in ARIRLS patients (196). A polymorphism in the TNFa gene promoter is associated with development of lipodystrophy in one study, while this association was not confirmed in larger studies (194). Stavudine-induced lipoatrophy is associated with the HLA-B100*4001 allele among the genetic variants of HLA-A, HLA-B HLA-C, HLA-DRB1, HLA-DQB1 and HLA-DPB1 (190). A newly identified polymorphism (Tth111I) in the GR gene is negatively associated with the development of some manifestations of ARIRLS in the African-American population (197). Finally, toxicity of antiretroviral drugs depends on their metabolism in each patient, which is partly determined genetically (196).

Summary for ARIRLS

Above pieces of evidence indicate that ARIRLS is most likely caused by multiple factors, including the infection itself, - via nonspecific inflammatory cytokine - and stress-induced hypercortisolism causing insulin resistance-, several HIV products disturbing the cellular functions of the host, and antiretroviral drugs, all acting on a genetic and constitutional background of variable predisposition to the syndrome. It is highly possible that alteration of glucocorticoid/GR signaling system by any of the above indicated factors contributes to the development of ARIRLS. Further studies are necessary to characterize this syndrome further, to better define the mechanisms involved in its development, and devise ways to prevent it from occurring or for reversing it.

ACKNOWLEDGEMENTS

This literary work was supported by the intramural fund of the Sidra Medical and Research Center to T. Kino.

REFERENCES

  1. Graziosi C, Soudeyns H, Rizzardi GP, Bart PA, Chapuis A, Pantaleo G. Immunopathogenesis of HIV infection. AIDS Res Hum Retroviruses 1998; 14 Suppl 2:S135-142
  2. Sellmeyer DE, Grunfeld C. Endocrine and metabolic disturbances in human immunodeficiency virus infection and the acquired immune deficiency syndrome. Endocr Rev 1996; 17:518-532
  3. Chrousos GP. The hypothalamic-pituitary-adrenal axis and immune-mediated inflammation. N Engl J Med 1995; 332:1351-1362
  4. Glucocorticoids, Overview. Nicolaides NC, Charmandari E, Chrousos GP. In Encyclopedia of Endocrine Diseases (2nd Edition), edited by Ilpo Huhtaniemi and Luciano Martini, New York 2018, pp. 64-71.
  5. Andrieu JM, Lu W. Long-term clinical, immunologic and virologic impact of glucocorticoids on the chronic phase of HIV infection. BMC Med 2004; 2:17
  6. Morris AB, Cu-Uvin S, Harwell JI, Garb J, Zorrilla C, Vajaranant M, Dobles AR, Jones TB, Carlan S, Allen DY. Multicenter review of protease inhibitors in 89 pregnancies. J Acquir Immune Defic Syndr 2000; 25:306-311
  7. Nannini EC, Okhuysen PC. HIV1 and the gut in the era of highly active antiretroviral therapy. Curr Gastroenterol Rep 2002; 4:392-398
  8. Tashima KT, Flanigan TP. Antiretroviral therapy in the year 2000. Infect Dis Clin North Am 2000; 14:827-849
  9. Collins SE, Grant PM, Shafer RW. Modifying Antiretroviral Therapy in Virologically Suppressed HIV-1-Infected Patients. Drugs 2016; 76:75-98
  10. Lo JC, Mulligan K, Tai VW, Algren H, Schambelan M. "Buffalo hump" in men with HIV-1 infection. Lancet 1998; 351:867-870
  11. Malaty LI, Kuper JJ. Drug interactions of HIV protease inhibitors. Drug Saf 1999; 20:147-169
  12. Saberi P, Phengrasamy T, Nguyen DP. Inhaled corticosteroid use in HIV-positive individuals taking protease inhibitors: a review of pharmacokinetics, case reports and clinical management. HIV Med 2013; 14:519-529
  13. Weiss R, Mitrou P, Arasteh K, Schuermann D, Hentrich M, Duehrsen U, Sudeck H, Schmidt-Wolf IG, Anagnostopoulos I, Huhn D. Acquired immunodeficiency syndrome-related lymphoma: simultaneous treatment with combined cyclophosphamide, doxorubicin, vincristine, and prednisone chemotherapy and highly active antiretroviral therapy is safe and improves survival -results of the German Multicenter Trial. Cancer 2006; 106:1560-1568
  14. Carbone A, Cesarman E, Spina M, Gloghini A, Schulz TF. HIV-associated lymphomas and g-herpesviruses. Blood 2009; 113:1213-1224
  15. Dezube BJ. Acquired immunodeficiency syndrome-related Kaposi's sarcoma: clinical features, staging, and treatment. Semin Oncol 2000; 27:424-430
  16. Pope SD, Johnson MD, May DB. Pharmacotherapy for human immunodeficiency virus-associated nephropathy. Pharmacotherapy 2005; 25:1761-1772
  17. Mayanja-Kizza H, Jones-Lopez E, Okwera A, Wallis RS, Ellner JJ, Mugerwa RD, Whalen CC. Immunoadjuvant prednisolone therapy for HIV-associated tuberculosis: a phase 2 clinical trial in Uganda. J Infect Dis 2005; 191:856-865
  18. Day J, Imran D, Ganiem AR, Tjahjani N, Wahyuningsih R, Adawiyah R, Dance D, Mayxay M, Newton P, Phetsouvanh R, Rattanavong S, Chan AK, Heyderman R, van Oosterhout JJ, Chierakul W, Day N, Kamali A, Kibengo F, Ruzagira E, Gray A, Lalloo DG, Beardsley J, Binh TQ, Chau TT, Chau NV, Cuc NT, Farrar J, Hien TT, Van Kinh N, Merson L, Phuong L, Tho LT, Thuy PT, Thwaites G, Wertheim H, Wolbers M. CryptoDex: a randomised, double-blind, placebo-controlled phase III trial of adjunctive dexamethasone in HIV-infected adults with cryptococcal meningitis: study protocol for a randomised control trial. Trials 2014; 15:441
  19. Chrousos GP. Stress and disorders of the stress system. Nat Rev Endocrinol 2009; 5:374-381
  20. Nader N, Chrousos GP, Kino T. Interactions of the circadian CLOCK system and the HPA axis. Trends Endocrinol Metab 2010; 21:277-286
  21. Nicolaides NC, Kyratzi E, Lamprokostopoulou A, Chrousos GP, Charmandari E. Stress, the stress system and the role of glucocorticoids. Neuroimmunomodulation. 2015; 22(1-2):6-19
  22. Stavrou S, Nicolaides NC, Critselis E, Darviri C, Charmandari E, Chrousos GP. Paediatric stress: from neuroendocrinology to contemporary disorders. Eur J Clin Invest 2017; 47(3):262-269
  23. Nicolaides NC, Charmandari E, Kino T, Chrousos GP. Stress-Related and Circadian Secretion and Target Tissue Actions of Glucocorticoids: Impact on Health. Front Endocrinol (Lausanne). 2017; 8:70
  24. Agorastos A, Nicolaides NC, Bozikas VP, Chrousos GP, Pervanidou P. Multilevel Interactions of Stress and Circadian System: Implications for Traumatic Stress. Front Psychiatry. 2020; 10:1003
  25. Chrousos GP, Kino T. Glucocorticoid action networks and complex psychiatric and/or somatic disorders. Stress 2007; 10:213-219
  26. Bao AM, Meynen G, Swaab DF. The stress system in depression and neurodegeneration: focus on the human hypothalamus. Brain Res Rev 2008; 57:531-553
  27. Kino T. Stress, glucocorticoid hormones, and hippocampal neural progenitor cells: implications to mood disorders. Front Physiol 2015; 6:230
  28. Chrousos GP, Kino T. Intracellular glucocorticoid signaling: a formerly simple system turns stochastic. Sci STKE 2005; 2005:pe48
  29. Kino T, Chrousos GP. Virus-mediated modulation of the host endocrine signaling systems: clinical implications. Trends Endocrinol Metab 2007; 18:159-166
  30. Kino T. Tissue glucocorticoid sensitivity: beyond stochastic regulation on the diverse actions of glucocorticoids. Horm Metab Res 2007; 39:420-424
  31. Chrousos GP. Stress, chronic inflammation, and emotional and physical well-being: Concurrent effects and chronic sequelae. J Allergy Clin Immunol 2000; 106:S275-S291
  32. Elenkov IJ. Glucocorticoids and the Th1/Th2 balance. Ann N Y Acad Sci 2004; 1024:138-146
  33. Elenkov IJ, Chrousos GP. Stress hormones, proinflammatory and antiinflammatory cytokines, and autoimmunity. Ann N Y Acad Sci 2002; 966:290-303
  34. Clark JK, Schrader WT, O'Malley BW. Mechanism of steroid hormones. In: Wilson JD, Foster DW, eds. Williams Textbook of Endocrinology. Philadelphia: WB Sanders Co.; 1992:35-90.
  35. Munck A, Guyre PM, Holbrook NJ. Physiological functions of glucocorticoids in stress and their relation to pharmacological actions. Endocr Rev 1984; 5:25-44
  36. Boumpas DT, Chrousos GP, Wilder RL, Cupps TR, Balow JE. Glucocorticoid therapy for immune-mediated diseases: basic and clinical correlates. Ann Intern Med 1993; 119:1198-1208
  37. Kino T, Su YA, Chrousos GP. Human glucocorticoid receptor isoform b: recent understanding of its potential implications in physiology and pathophysiology. Cell Mol Life Sci 2009; 66:3435-3448
  38. Kino T, Manoli I, Kelkar S, Wang Y, Su YA, Chrousos GP. Glucocorticoid receptor (GR) b has intrinsic, GRa-independent transcriptional activity. Biochem Biophys Res Commun 2009; 381:671-675
  39. McKenna NJ, Lanz RB, O'Malley BW. Nuclear receptor coregulators: cellular and molecular biology. Endocr Rev 1999; 20:321-344
  40. Lanz RB, McKenna NJ, Onate SA, Albrecht U, Wong J, Tsai SY, Tsai MJ, O'Malley BW. A steroid receptor coactivator, SRA, functions as an RNA and is present in an SRC-1 complex. Cell 1999; 97:17-27
  41. Kino T, Hurt DE, Ichijo T, Nader N, Chrousos GP. Noncoding RNA gas5 is a growth arrest- and starvation-associated repressor of the glucocorticoid receptor. Sci Signal 2010; 3:ra8
  42. Charmandari E, Kino T. Chrousos syndrome: a seminal report, a phylogenetic enigma and the clinical implications of glucocorticoid signalling changes. Eur J Clin Invest 2010; 40:932-942
  43. Charmandari E, Kino T, Ichijo T, Chrousos GP. Generalized glucocorticoid resistance: clinical aspects, molecular mechanisms, and implications of a rare genetic disorder. J Clin Endocrinol Metab 2008; 93:1563-1572
  44. Nicolaides NC, Charmandari E. Chrousos syndrome: from molecular pathogenesis to therapeutic management. Eur J Clin Invest 2015; 45(5):504-514
  45. Nicolaides NC, Charmandari E. Novel insights into the molecular mechanisms underlying generalized glucocorticoid resistance and hypersensitivity syndromes. Hormones (Athens) 2017; 16(2):124-138
  46. Kino T, De Martino MU, Charmandari E, Mirani M, Chrousos GP. Tissue glucocorticoid resistance/hypersensitivity syndromes. J Steroid Biochem Mol Biol 2003; 85:457-467
  47. Nader N, Ng SS, Lambrou GI, Pervanidou P, Wang Y, Chrousos GP, Kino T. AMPK regulates metabolic actions of glucocorticoids by phosphorylating the glucocorticoid receptor through p38 MAPK. Mol Endocrinol 2010; 24:1748-1764
  48. Laue L, Gold PW, Richmond A, Chrousos GP. The hypothalamic-pituitary-adrenal axis in anorexia nervosa and bulimia nervosa: pathophysiologic implications. Adv Pediatr 1991; 38:287-316
  49. Hill MJ, Suzuki S, Segars JH, Kino T. CRTC2 Is a coactivator of GR and couples GR and CREB in the regulation of hepatic gluconeogenesis. Mol Endocrinol 2016; 30:104-117
  50. Bricaire F, Marche C, Zoubi D, Regnier B, Saimot AG. Adrenocortical lesions and AIDS. Lancet 1988; 1:881
  51. Glasgow BJ, Steinsapir KD, Anders K, Layfield LJ. Adrenal pathology in the acquired immune deficiency syndrome. Am J Clin Pathol 1985; 84:594-597
  52. Nassoro DD, Mkhoi ML, Sabi I, Meremo AJ, Lawala PS, Mwakyula IH. Adrenal Insufficiency: A Forgotten Diagnosis in HIV/AIDS Patients in Developing Countries. Int J Endocrinol. 2019; 2019:2342857
  53. Lo J, Grinspoon SK. Adrenal function in HIV infection. Curr Opin Endocrinol Diabetes Obes 2010; 17:205-209
  54. Hawken MP, Ojoo JC, Morris JS, Kariuki EW, Githui WA, Juma ES, Gathua SN, Kimari JN, Thiong'o LN, Raynes JG, Broadbent P, Gilks CF, Otieno LS, McAdam KP. No increased prevalence of adrenocortical insufficiency in human immunodeficiency virus-associated tuberculosis. Tuber Lung Dis 1996; 77:444-448
  55. Seel K, Guschmann M, van Landeghem F, Grosch-Worner I. Addison-disease - an unusual clinical manifestation of CMV-end organ disease in pediatric AIDS. Eur J Med Res 2000; 5:247-250
  56. Angulo JC, Lopez JI, Flores N. Lethal cytomegalovirus adrenalitis in a case of AIDS. Scand J Urol Nephrol 1994; 28:105-106
  57. Greene LW, Cole W, Greene JB, Levy B, Louie E, Raphael B, Waitkevicz J, Blum M. Adrenal insufficiency as a complication of the acquired immunodeficiency syndrome. Ann Intern Med 1984; 101:497-498
  58. Membreno L, Irony I, Dere W, Klein R, Biglieri EG, Cobb E. Adrenocortical function in acquired immunodeficiency syndrome. J Clin Endocrinol Metab 1987; 65:482-487
  59. Hoshino Y, Yamashita N, Nakamura T, Iwamoto A. Prospective examination of adrenocortical function in advanced AIDS patients. Endocr J 2002; 49:641-647
  60. Uno K, Konishi M, Yoshimoto E, Kasahara K, Mori K, Maeda K, Ishida E, Konishi N, Murakawa K, Mikasa K. Fatal cytomegalovirus-associated adrenal insufficiency in an AIDS patient receiving corticosteroid therapy. Intern Med 2007; 46:617-620
  61. Verges B, Chavanet P, Desgres J, Vaillant G, Waldner A, Brun JM, Putelat R. Adrenal function in HIV infected patients. Acta Endocrinol (Copenh) 1989; 121:633-637
  62. Biglino A, Limone P, Forno B, Pollono A, Cariti G, Molinatti GM, Gioannini P. Altered adrenocorticotropin and cortisol response to corticotropin-releasing hormone in HIV-1 infection. Eur J Endocrinol 1995; 133:173-179
  63. Lortholary O, Christeff N, Casassus P, Thobie N, Veyssier P, Trogoff B, Torri O, Brauner M, Nunez EA, Guillevin L. Hypothalamo-pituitary-adrenal function in human immunodeficiency virus-infected men. J Clin Endocrinol Metab 1996; 81:791-796
  64. Coodley GO, Loveless MO, Nelson HD, Coodley MK. Endocrine function in the HIV wasting syndrome. J Acquir Immune Defic Syndr 1994; 7:46-51
  65. Findling JW, Buggy BP, Gilson IH, Brummitt CF, Bernstein BM, Raff H. Longitudinal evaluation of adrenocortical function in patients infected with the human immunodeficiency virus. J Clin Endocrinol Metab 1994; 79:1091-1096
  66. Kumar M, Kumar AM, Morgan R, Szapocznik J, Eisdorfer C. Abnormal pituitary-adrenocortical response in early HIV-1 infection. J Acquir Immune Defic Syndr 1993; 6:61-65
  67. Malone JL, Oldfield ECd, Wagner KF, Simms TE, Daly R, O'Brian J, Burke DS. Abnormalities of morning serum cortisol levels and circadian rhythms of CD4+ lymphocyte counts in human immunodeficiency virus type 1-infected adult patients. J Infect Dis 1992; 165:185-186
  68. Yanovski JA, Miller KD, Kino T, Friedman TC, Chrousos GP, Tsigos C, Falloon J. Endocrine and metabolic evaluation of human immunodeficiency virus-infected patients with evidence of protease inhibitor-associated lipodystrophy. J Clin Endocrinol Metab 1999; 84:1925-1931
  69. Christeff N, Gherbi N, Mammes O, Dalle MT, Gharakhanian S, Lortholary O, Melchior JC, Nunez EA. Serum cortisol and DHEA concentrations during HIV infection. Psychoneuroendocrinology 1997; 22:S11-18
  70. de la Torre B, von Krogh G, Svensson M, Holmberg V. Blood cortisol and dehydroepiandrosterone sulphate (DHEAS) levels and CD4 T cell counts in HIV infection. Clin Exp Rheumatol 1997; 15:87-90
  71. Stolarczyk R, Rubio SI, Smolyar D, Young IS, Poretsky L. Twenty-four-hour urinary free cortisol in patients with acquired immunodeficiency syndrome. Metabolism 1998; 47:690-694
  72. Akase IE, Habib AG, Bakari AG, Muhammad H, Gezawa I, Nashabaru I, Iliyasu G, Mohammed AA. Occurrence of hypocortisolism in HIV patients: Is the picture changing? Ghana Med J. 2018; 52(3):147-152
  73. Dobs AS, Dempsey MA, Ladenson PW, Polk BF. Endocrine disorders in men infected with human immunodeficiency virus. Am J Med 1988; 84:611-616
  74. Raffi F, Brisseau JM, Planchon B, Remi JP, Barrier JH, Grolleau JY. Endocrine function in 98 HIV-infected patients: a prospective study. AIDS 1991; 5:729-733
  75. Ferreiro J, Vinters HV. Pathology of the pituitary gland in patients with the acquired immune deficiency syndrome (AIDS). Pathology 1988; 20:211-215
  76. Rouanet I, Peyriere H, Mauboussin JM, Vincent D. Cushing's syndrome in a patient treated by ritonavir/lopinavir and inhaled fluticasone. HIV Med 2003; 4:149-150
  77. Chen F, Kearney T, Robinson S, Daley-Yates PT, Waldron S, Churchill DR. Cushing's syndrome and severe adrenal suppression in patients treated with ritonavir and inhaled nasal fluticasone. Sex Transm Infect 1999; 75:274
  78. Hillebrand-Haverkort ME, Prummel MF, ten Veen JH. Ritonavir-induced Cushing's syndrome in a patient treated with nasal fluticasone. AIDS 1999; 13:1803
  79. Dubrocq G, Estrada A, Kelly S, Rakhmanina N. Acute development of Cushing syndrome in an HIV-infected child on atazanavir/ritonavir based antiretroviral therapy. Endocrinol Diabetes Metab Case Rep. 2017; 2017:17-0076
  80. Colpitts L, Murray TB, Tahhan SG, Boggs JP. Iatrogenic Cushing Syndrome in a 47-Year-Old HIV-Positive Woman on Ritonavir and Inhaled Budesonide. J Int Assoc Provid AIDS Care. 2017; 16(6):531-534
  81. Alidoost M, Conte GA, Agarwal K, Carson MP, Lann D, Marchesani D. Iatrogenic Cushing's Syndrome Following Intra-Articular Triamcinolone Injection in an HIV-Infected Patient on Cobicistat Presenting as a Pulmonary Embolism: Case Report and Literature Review. Int Med Case Rep J. 2020; 13:229-235
  82. Figueiredo J, Serrado M, Khmelinskii N, do Vale S. Iatrogenic Cushing syndrome and multifocal osteonecrosis caused by the interaction between inhaled fluticasone and ritonavir. BMJ Case Rep. 2020; 13(5):e233712
  83. Veytsman I, Nieman L, Fojo T. Management of endocrine manifestations and the use of mitotane as a chemotherapeutic agent for adrenocortical carcinoma. J Clin Oncol 2009; 27:4619-4629
  84. Fassnacht M, Hahner S, Beuschlein F, Klink A, Reincke M, Allolio B. New mechanisms of adrenostatic compounds in a human adrenocortical cancer cell line. Eur J Clin Invest 2000; 30 Suppl 3:76-82
  85. Chidakel AR, Zweig SB, Schlosser JR, Homel P, Schappert JW, Fleckman AM. High prevalence of adrenal suppression during acute illness in hospitalized patients receiving megestrol acetate. J Endocrinol Invest 2006; 29:136-140
  86. Gonzalez Villarroel P, Fernandez Perez I, Paramo C, Gentil Gonzalez M, Carnero Lopez B, Vazquez Tunas ML, Carrasco Alvarez JA. Megestrol acetate-induced adrenal insufficiency. Clin Transl Oncol 2008; 10:235-237
  87. d'Arminio Monforte A, Lepri AC, Rezza G, Pezzotti P, Antinori A, Phillips AN, Angarano G, Colangeli V, De Luca A, Ippolito G, Caggese L, Soscia F, Filice G, Gritti F, Narciso P, Tirelli U, Moroni M. Insights into the reasons for discontinuation of the first highly active antiretroviral therapy (HAART) regimen in a cohort of antiretroviral naive patients. I.CO.N.A. Study Group. Italian Cohort of Antiretroviral-Naive Patients. AIDS 2000; 14:499-507
  88. Deloria-Knoll M, Chmiel JS, Moorman AC, Wood KC, Holmberg SD, Palella FJ. Factors related to and consequences of adherence to antiretroviral therapy in an ambulatory HIV-infected patient cohort. AIDS Patient Care STDS 2004; 18:721-727
  89. Brook MG, Dale A, Tomlinson D, Waterworth C, Daniels D, Forster G. Adherence to highly active antiretroviral therapy in the real world: experience of twelve English HIV units. AIDS Patient Care STDS 2001; 15:491-494
  90. Hawkins T. Understanding and managing the adverse effects of antiretroviral therapy. Antiviral Res 2010; 85:201-209
  91. Tang MW, Shafer RW. HIV-1 antiretroviral resistance: scientific principles and clinical applications. Drugs 2012; 72:e1-25
  92. Tavel JA, Sereti I, Walker RE, Hahn B, Kovacs JA, Jagannatha S, Davey RT, Jr., Falloon J, Polis MA, Masur H, Metcalf JA, Stevens R, Rupert A, Baseler M, Lane HC. A randomized, double-blinded, placebo-controlled trial of intermittent administration of interleukin-2 and prednisone in subjects infected with human immunodeficiency virus. J Infect Dis 2003; 188:531-536
  93. Rizzardi GP, Harari A, Capiluppi B, Tambussi G, Ellefsen K, Ciuffreda D, Champagne P, Bart PA, Chave JP, Lazzarin A, Pantaleo G. Treatment of primary HIV-1 infection with cyclosporin A coupled with highly active antiretroviral therapy. J Clin Invest 2002; 109:681-688
  94. McComsey GA, Whalen CC, Mawhorter SD, Asaad R, Valdez H, Patki AH, Klaumunzner J, Gopalakrishna KV, Calabrese LH, Lederman MM. Placebo-controlled trial of prednisone in advanced HIV-1 infection. AIDS 2001; 15:321-327
  95. Wallis RS, Kalayjian R, Jacobson JM, Fox L, Purdue L, Shikuma CM, Arakaki R, Snyder S, Coombs RW, Bosch RJ, Spritzler J, Chernoff M, Aga E, Myers L, Schock B, Lederman MM. A study of the immunology, virology, and safety of prednisone in HIV-1-infected subjects with CD4 cell counts of 200 to 700 mm(-3). J Acquir Immune Defic Syndr 2003; 32:281-286
  96. Ulmer A, Muller M, Bertisch-Mollenhoff B, Frietsch B. Low-dose prednisolone has a CD4-stabilizing effect in pre-treated HIV-patients during structured therapy interruptions (STI). Eur J Med Res 2005; 10:227-232
  97. Dudgeon WD, Phillips KD, Carson JA, Brewer RB, Durstine JL, Hand GA. Counteracting muscle wasting in HIV-infected individuals. HIV Med 2006; 7:299-310
  98. Belec L, Meillet D, Hernvann A, Gresenguet G, Gherardi R. Differential elevation of circulating interleukin-1b, tumor necrosis factor a, and interleukin-6 in AIDS-associated cachectic states. Clin Diagn Lab Immunol 1994; 1:117-120
  99. Osborn L, Kunkel S, Nabel GJ. Tumor necrosis factor a and interleukin 1 stimulate the human immunodeficiency virus enhancer by activation of the nuclear factor kB. Proc Natl Acad Sci U S A 1989; 86:2336-2340
  100. Ansari AW, Schmidt RE, Heiken H. Prednisolone mediated suppression of HIV-1 viral load strongly correlates with C-C chemokine CCL2: In vivo and in vitro findings. Clin Immunol 2007; 125:1-4
  101. Orlikowsky TW, Wang ZQ, Dudhane A, Dannecker GE, Niethammer D, Wormser GP, Hoffmann MK, Horowitz HW. Dexamethasone inhibits CD4 T cell deletion mediated by macrophages from human immunodeficiency virus-infected persons. J Infect Dis 2001; 184:1328-1330
  102. Moniuszko M, Liyanage NP, Doster MN, Parks RW, Grubczak K, Lipinska D, McKinnon K, Brown C, Hirsch V, Vaccari M, Gordon S, Pegu P, Fenizia C, Flisiak R, Grzeszczuk A, Dabrowska M, Robert-Guroff M, Silvestri G, Stevenson M, McCune J, Franchini G. Glucocorticoid treatment at moderate doses of SIVmac251-infected rhesus macaques decreases the frequency of circulating CD14+CD16++ monocytes but does not alter the tissue virus reservoir. AIDS Res Hum Retroviruses 2015; 31:115-126
  103. Ellery PJ, Tippett E, Chiu YL, Paukovics G, Cameron PU, Solomon A, Lewin SR, Gorry PR, Jaworowski A, Greene WC, Sonza S, Crowe SM. The CD16+ monocyte subset is more permissive to infection and preferentially harbors HIV-1 in vivo. J Immunol 2007; 178:6581-6589
  104. Patterson S, Moran P, Epel E, Sinclair E, Kemeny ME, Deeks SG, Bacchetti P, Acree M, Epling L, Kirschbaum C, Hecht FM. Cortisol patterns are associated with T cell activation in HIV. PLoS One 2013; 8:e63429
  105. Miller KD, Masur H, Jones EC, Joe GO, Rick ME, Kelly GG, Mican JM, Liu S, Gerber LH, Blackwelder WC, Falloon J, Davey RT, Polis MA, Walker RE, Lane HC, Kovacs JA. High prevalence of osteonecrosis of the femoral head in HIV-infected adults. Ann Intern Med 2002; 137:17-25
  106. Scribner AN, Troia-Cancio PV, Cox BA, Marcantonio D, Hamid F, Keiser P, Levi M, Allen B, Murphy K, Jones RE, Skiest DJ. Osteonecrosis in HIV: a case-control study. J Acquir Immune Defic Syndr 2000; 25:19-25
  107. Glesby MJ, Hoover DR, Vaamonde CM. Osteonecrosis in patients infected with human immunodeficiency virus: a case-control study. J Infect Dis 2001; 184:519-523
  108. Panayotakopoulos GD, Day S, Peters BS, Kulasegaram R. Severe osteoporosis and multiple fractures in an AIDS patient treated with short-term steroids for lymphoma: a need for guidelines. Int J STD AIDS 2006; 17:567-568
  109. Elliott AM, Luzze H, Quigley MA, Nakiyingi JS, Kyaligonza S, Namujju PB, Ducar C, Ellner JJ, Whitworth JA, Mugerwa R, Johnson JL, Okwera A. A randomized, double-blind, placebo-controlled trial of the use of prednisolone as an adjunct to treatment in HIV-1-associated pleural tuberculosis. J Infect Dis 2004; 190:869-878
  110. Jinno S, Goshima C. Progression of Kaposi sarcoma associated with iatrogenic Cushing syndrome in a person with HIV/AIDS. AIDS Read 2008; 18:100-104
  111. Kerr E, Middleton A, Churchill D, Reading I, Walker-Bone K. A case-control study of elective hip surgery among HIV-infected patients: exposure to systemic glucocorticoids significantly increases the risk. HIV Med 2014; 15:182-188
  112. Joo M, Soon Lee S, Jin Park H, Shin HS. Iatrogenic Kaposi's sarcoma following steroid therapy for nonspecific interstitial pneumonia with HHV-8 genotyping. Pathol Res Pract 2006; 202:113-117
  113. Agbaht K, Pepedil F, Kirkpantur A, Yilmaz R, Arici M, Turgan C. A case of Kaposi's sarcoma following treatment of membranoproliferative glomerulonephritis and a review of the literature. Ren Fail 2007; 29:107-110
  114. Togi S, Nakasuji M, Muromoto R, Ikeda O, Okabe K, Kitai Y, Kon S, Oritani K, Matsuda T. Kaposi's sarcoma-associated herpesvirus-encoded LANA associates with glucocorticoid receptor and enhances its transcriptional activities. Biochem Biophys Res Commun 2015; 463:395-400
  115. Lescure FX, Moulignier A, Savatovsky J, Amiel C, Carcelain G, Molina JM, Gallien S, Pacanovski J, Pialoux G, Adle-Biassette H, Gray F. CD8 encephalitis in HIV-infected patients receiving cART: a treatable entity. Clin Infect Dis 2013; 57:101-108
  116. Rosen J, Miner JN. The search for safer glucocorticoid receptor ligands. Endocr Rev 2005; 26:452-464
  117. Mounier N, Spina M, Gabarre J, Raphael M, Rizzardini G, Golfier JB, Vaccher E, Carbone A, Coiffier B, Chichino G, Bosly A, Tirelli U, Gisselbrecht C. AIDS-related non-Hodgkin lymphoma: final analysis of 485 patients treated with risk-adapted intensive chemotherapy. Blood 2006; 107:3832-3840
  118. Castillo J, Pantanowitz L, Dezube BJ. HIV-associated plasmablastic lymphoma: lessons learned from 112 published cases. Am J Hematol 2008; 83:804-809
  119. Jacomet C, Lesens O, Villemagne B, Darcha C, Tournilhac O, Henquell C, Cormerais L, Gourdon F, Peigue-Lafeuille H, Travade P, Beytout J, Laurichesse H. Non Hodgkin's and Hodgkin's lymphomas and HIV: frequency, outcome and immune response under HAART; Clermont-Ferrand University Hospital, 1991-2003. Med Mal Infect 2006; 36:157-162
  120. Soumerai JD, Sohani AR, Abramson JS. Diagnosis and management of Castleman disease. Cancer Control 2014; 21:266-278
  121. Martin-Blondel G, Mars LT, Liblau RS. Pathogenesis of the immune reconstitution inflammatory syndrome in HIV-infected patients. Curr Opin Infect Dis 2012; 25:312-320
  122. Newsome SD, Nath A. Varicella-zoster virus vasculopathy and central nervous system immune reconstitution inflammatory syndrome with human immunodeficiency virus infection treated with steroids. J Neurovirol 2009; 15:288-291
  123. Mayosi BM, Ntsekhe M, Bosch J, Pandie S, Jung H, Gumedze F, Pogue J, Thabane L, Smieja M, Francis V, Joldersma L, Thomas KM, Thomas B, Awotedu AA, Magula NP, Naidoo DP, Damasceno A, Chitsa Banda A, Brown B, Manga P, Kirenga B, Mondo C, Mntla P, Tsitsi JM, Peters F, Essop MR, Russell JB, Hakim J, Matenga J, Barasa AF, Sani MU, Olunuga T, Ogah O, Ansa V, Aje A, Danbauchi S, Ojji D, Yusuf S. Prednisolone and Mycobacterium indicus pranii in tuberculous pericarditis. N Engl J Med 2014; 371:1121-1130
  124. Cotton MF, Rabie H, Nemes E, Mujuru H, Bobat R, Njau B, Violari A, Mave V, Mitchell C, Oleske J, Zimmer B, Varghese G, Pahwa S; P1073 team. A prospective study of the immune reconstitution inflammatory syndrome (IRIS) in HIV-infected children from high prevalence countries. PLoS One. 2019; 14(7):e0211155
  125. Rubin LH, Phan KL, Keating SM, Maki PM. A single low dose of hydrocortisone enhances cognitive functioning in HIV-infected women. AIDS. 2018; 32(14):1983-1993
  126. Dichter JR, Lundgren JD, Nielsen TL, Jensen BN, Schattenkerk J, Benfield TL, Lawrence M, Shelhamer J. Pneumocystis carinii pneumonia in HIV-infected patients: effect of steroid therapy on surfactant level. Respir Med 1999; 93:373-378
  127. Thwaites GE, Nguyen DB, Nguyen HD, Hoang TQ, Do TT, Nguyen TC, Nguyen QH, Nguyen TT, Nguyen NH, Nguyen TN, Nguyen NL, Nguyen HD, Vu NT, Cao HH, Tran TH, Pham PM, Nguyen TD, Stepniewska K, White NJ, Tran TH, Farrar JJ. Dexamethasone for the treatment of tuberculous meningitis in adolescents and adults. N Engl J Med 2004; 351:1741-1751
  128. Aster RH. Thrombocytopenia in the HIV-infected patient. Hosp Pract (Off Ed) 1994; 29:81-86
  129. Koduri PR, Singa P, Nikolinakos P. Autoimmune hemolytic anemia in patients infected with human immunodeficiency virus-1. Am J Hematol 2002; 70:174-176
  130. Levy R, Colonna P, Tourani JM, Gastaut JA, Brice P, Raphael M, Taillan B, Andrieu JM. Human immunodeficiency virus associated Hodgkin's disease: report of 45 cases from the French Registry of HIV-Associated Tumors. Leuk Lymphoma 1995; 16:451-456
  131. Hapgood JP, Ray RM, Govender Y, Avenant C, Tomasicchio M. Differential glucocorticoid receptor-mediated effects on immunomodulatory gene expression by progestin contraceptives: implications for HIV-1 pathogenesis. Am J Reprod Immunol 2014; 71:505-512
  132. Sech LA, Mishell DR, Jr. Oral steroid contraception. Womens Health (Lond Engl) 2015; 11:743-748
  133. Govender Y, Avenant C, Verhoog NJ, Ray RM, Grantham NJ, Africander D, Hapgood JP. The injectable-only contraceptive medroxyprogesterone acetate, unlike norethisterone acetate and progesterone, regulates inflammatory genes in endocervical cells via the glucocorticoid receptor. PLoS One 2014; 9:e96497
  134. Maritz MF, Ray RM, Bick AJ, Tomasicchio M, Woodland JG, Govender Y, Avenant C, Hapgood JP. Medroxyprogesterone acetate, unlike norethisterone, increases HIV-1 replication in human peripheral blood mononuclear cells and an indicator cell line, via mechanisms involving the glucocorticoid receptor, increased CD4/CD8 ratios and CCR5 levels. PLoS One. 2018 Apr 26;13(4):e0196043
  135. Norbiato G, Bevilacqua M, Vago T, Baldi G, Chebat E, Bertora P, Moroni M, Galli M, Oldenburg N. Cortisol resistance in acquired immunodeficiency syndrome. J Clin Endocrinol Metab 1992; 74:608-613
  136. Norbiato G, Bevilacqua M, Vago T, Clerici M. Glucocorticoids and Th-1, Th-2 type cytokines in rheumatoid arthritis, osteoarthritis, asthma, atopic dermatitis and AIDS. Clin Exp Rheumatol 1997; 15:315-3123
  137. Sher ER, Leung DY, Surs W, Kam JC, Zieg G, Kamada AK, Szefler SJ. Steroid-resistant asthma. Cellular mechanisms contributing to inadequate response to glucocorticoid therapy. J Clin Invest 1994; 93:33-39
  138. Kam JC, Szefler SJ, Surs W, Sher ER, Leung DY. Combination IL-2 and IL-4 reduces glucocorticoid receptor-binding affinity and T cell response to glucocorticoids. J Immunol 1993; 151:3460-3466
  139. Leung DY, Martin RJ, Szefler SJ, Sher ER, Ying S, Kay AB, Hamid Q. Dysregulation of interleukin 4, interleukin 5, and interferon g gene expression in steroid-resistant asthma. J Exp Med 1995; 181:33-40
  140. Leung DYM, Hamid Q, Vottero A, Szefler SJ, Surs W, Minshall E, Chrousos GP, Klemm DJ. Association of glucocorticoid insensitivity with increased expression of glucocorticoid receptor b. J Exp Med 1997; 186:1567-1574
  141. Ng SS, Li A, Pavlakis GN, Ozato K, Kino T. Viral infection increases glucocorticoid-induced interleukin-10 production through ERK-mediated phosphorylation of the glucocorticoid receptor in dendritic cells: potential clinical implications. PLoS One 2013; 8:e63587
  142. Vagnucci AH, Winkelstein A. Circadian rhythm of lymphocytes and their glucocorticoid receptors in HIV-infected homosexual men. J Acquir Immune Defic Syndr 1993; 6:1238-1247
  143. Christeff N, Melchior JC, de Truchis P, Perronne C, Nunez EA, Gougeon ML. Lipodystrophy defined by a clinical score in HIV-infected men on highly active antiretroviral therapy: correlation between dyslipidaemia and steroid hormone alterations. AIDS 1999; 13:2251-2260
  144. Saint-Marc T, Touraine JL. "Buffalo hump" in HIV-1 infection. Lancet 1998; 352:319-320
  145. De Luca A, Murri R, Damiano F, Ammassari A, Antinori A. "Buffalo hump" in HIV-1 infection. Lancet 1998; 352:320
  146. Darvay A, Acland K, Lynn W, Russell-Jones R. Striae formation in two HIV-positive persons receiving protease inhibitors. J Am Acad Dermatol 1999; 41:467-469
  147. Caron-Debarle M, Lagathu C, Boccara F, Vigouroux C, Capeau J. HIV-associated lipodystrophy: from fat injury to premature aging. Trends Mol Med 2010; 16:218-229
  148. Nolis T. Exploring the pathophysiology behind the more common genetic and acquired lipodystrophies. J Hum Genet 2014; 59:16-23
  149. De Clercq E. Antiretroviral drugs. Curr Opin Pharmacol 2010; 10:507-515
  150. Carr A, Samaras K, Chisholm DJ, Cooper DA. Pathogenesis of HIV-1-protease inhibitor-associated peripheral lipodystrophy, hyperlipidaemia, and insulin resistance. Lancet 1998; 351:1881-1883
  151. Kino T, Chrousos GP. Human immunodeficiency virus type-1 accessory protein Vpr: a causative agent of the AIDS-related insulin resistance/lipodystrophy syndrome? Ann N Y Acad Sci 2004; 1024:153-167
  152. Lenhard JM, Furfine ES, Jain RG, Ittoop O, Orband-Miller LA, Blanchard SG, Paulik MA, Weiel JE. HIV protease inhibitors block adipogenesis and increase lipolysis in vitro. Antiviral Res 2000; 47:121-129
  153. Zhang B, MacNaul K, Szalkowski D, Li Z, Berger J, Moller DE. Inhibition of adipocyte differentiation by HIV protease inhibitors. J Clin Endocrinol Metab 1999; 84:4274-4277
  154. Svard J, Blanco F, Nevin D, Fayne D, Mulcahy F, Hennessy M, Spiers JP. Differential interactions of antiretroviral agents with LXR, ER and GR nuclear receptors: potential contributing factors to adverse events. Br J Pharmacol 2014; 171:480-497
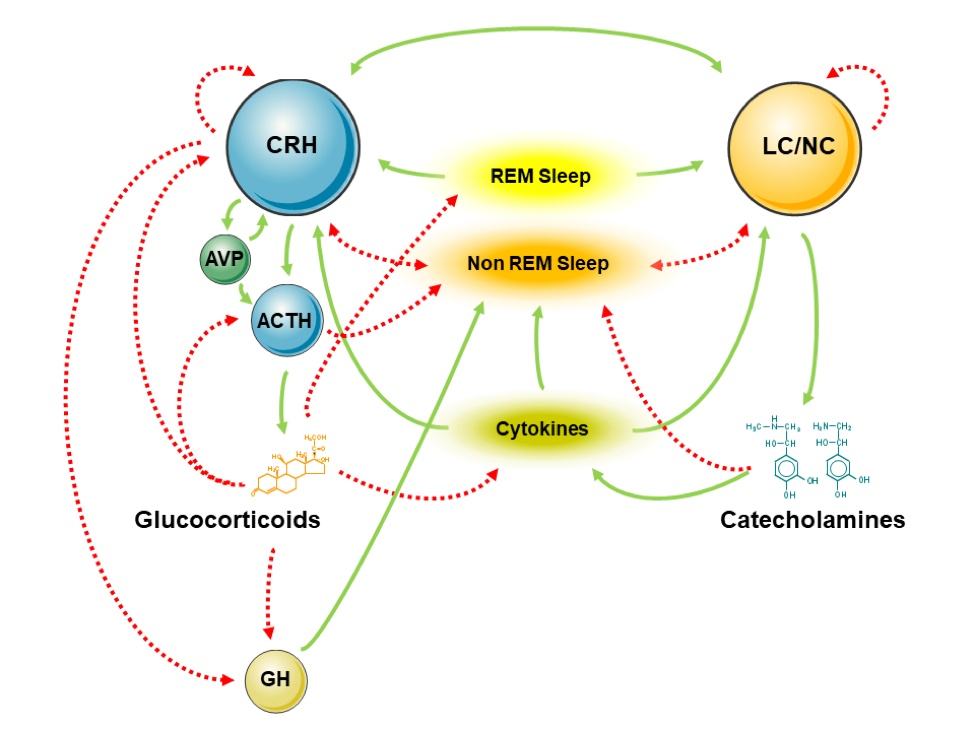
  155. Ahmadian M, Suh JM, Hah N, Liddle C, Atkins AR, Downes M, Evans RM. PPARg signaling and metabolism: the good, the bad and the future. Nat Med 2013; 19:557-566
  156. Ramji DP, Foka P. CCAAT/enhancer-binding proteins: structure, function and regulation. Biochem J 2002; 365:561-575
  157. Vatier C, Leroyer S, Quette J, Brunel N, Capeau J, Antoine B. HIV protease inhibitors differently affect human subcutaneous and visceral fat: they induce IL-6 production and later lipid storage capacity in subcutaneous but not visceral adipose tissue explants. Antiviral Therapy 2008; 13:A3
  158. Ouchi N, Parker JL, Lugus JJ, Walsh K. Adipokines in inflammation and metabolic disease. Nat Rev Immunol 2011; 11:85-97
  159. Flint OP, Noor MA, Hruz PW, Hylemon PB, Yarasheski K, Kotler DP, Parker RA, Bellamine A. The role of protease inhibitors in the pathogenesis of HIV-associated lipodystrophy: cellular mechanisms and clinical implications. Toxicol Pathol 2009; 37:65-77
  160. Djedaini M, Peraldi P, Drici MD, Darini C, Saint-Marc P, Dani C, Ladoux A. Lopinavir co-induces insulin resistance and ER stress in human adipocytes. Biochem Biophys Res Commun 2009; 386:96-100
  161. Nolan D, Mallal S. Complications associated with NRTI therapy: update on clinical features and possible pathogenic mechanisms. Antivir Ther 2004; 9:849-863
  162. Zhai Y, Pai HV, Zhou J, Amico JA, Vollmer RR, Xie W. Activation of pregnane X receptor disrupts glucocorticoid and mineralocorticoid homeostasis. Mol Endocrinol 2007; 21:138-147
  163. Lee SD, Tontonoz P. Liver X receptors at the intersection of lipid metabolism and atherogenesis. Atherosclerosis 2015; 242:29-36
  164. Nader N, Ng SS, Wang Y, Abel BS, Chrousos GP, Kino T. Liver x receptors regulate the transcriptional activity of the glucocorticoid receptor: implications for the carbohydrate metabolism. PLoS One 2012; 7:e26751
  165. Miranda TB, Voss TC, Sung MH, Baek S, John S, Hawkins M, Grontved L, Schiltz RL, Hager GL. Reprogramming the chromatin landscape: interplay of the estrogen and glucocorticoid receptors at the genomic level. Cancer Res 2013; 73:5130-5139
  166. Riddler SA, Smit E, Cole SR, Li R, Chmiel JS, Dobs A, Palella F, Visscher B, Evans R, Kingsley LA. Impact of HIV infection and HAART on serum lipids in men. Jama 2003; 289:2978-2982
  167. Sutinen J, Kannisto K, Korsheninnikova E, Nyman T, Ehrenborg E, Andrew R, Wake DJ, Hamsten A, Walker BR, Yki-Jarvinen H. In the lipodystrophy associated with highly active antiretroviral therapy, pseudo-Cushing's syndrome is associated with increased regeneration of cortisol by 11b-hydroxysteroid dehydrogenase type 1 in adipose tissue. Diabetologia 2004; 47:1668-1671
  168. Boothby M, McGee KC, Tomlinson JW, Gathercole LL, McTernan PG, Shojaee-Moradie F, Umpleby AM, Nightingale P, Shahmanesh M. Adipocyte differentiation, mitochondrial gene expression and fat distribution: differences between zidovudine and tenofovir after 6 months. Antivir Ther 2009; 14:1089-1100
  169. Miller KK, Daly PA, Sentochnik D, Doweiko J, Samore M, Basgoz NO, Grinspoon SK. Pseudo-Cushing's syndrome in human immunodeficiency virus-infected patients. Clin Infect Dis 1998; 27:68-72
  170. Pavlakis GN. The molecular biology of HIV-1. In: DeVita VT, Hellman S, Rosenberg SA, eds. AIDS: Diagnosis, Treatment and Prevention. 4 ed. Philadelphia: Lippincott Raven; 1996:45-74.
  171. Norbiato G, Bevilacqua M, Vago T, Taddei A, Clerici. Glucocorticoids and the immune function in the human immunodeficiency virus infection: a study in hypercortisolemic and cortisol-resistant patients. J Clin Endocrinol Metab 1997; 82:3260-3263
  172. Norbiato G, Bevilacqua M, Vago T, Clerici M. Glucocorticoids and interferon-a in the acquired immunodeficiency syndrome. J Clin Endocrinol Metab 1996; 81:2601-2606
  173. Elenkov IJ, Chrousos GP. Stress Hormones, Th1/Th2 patterns, Pro/Anti-inflammatory Cytokines and Susceptibility to Disease. Trends Endocrinol Metab 1999; 10:359-368
  174. Hadigan C, Miller K, Corcoran C, Anderson E, Basgoz N, Grinspoon S. Fasting hyperinsulinemia and changes in regional body composition in human immunodeficiency virus-infected women. J Clin Endocrinol Metab 1999; 84:1932-1937
  175. Belec L, Mhiri C, DiCostanzo B, Gherardi R. The HIV wasting syndrome. Muscle Nerve 1992; 15:856-857
  176. Simpson DM, Bender AN, Farraye J, Mendelson SG, Wolfe DE. Human immunodeficiency virus wasting syndrome may represent a treatable myopathy. Neurology 1990; 40:535-538
  177. Kino T, Pavlakis GN. Partner molecules of accessory protein Vpr of the human immunodeficiency virus type 1. DNA Cell Biol 2004; 23:193-205
  178. Kino T, Gragerov A, Kopp JB, Stauber RH, Pavlakis GN, Chrousos GP. The HIV-1 virion-associated protein vpr is a coactivator of the human glucocorticoid receptor. J Exp Med 1999; 189:51-62
  179. Mirani M, Elenkov I, Volpi S, Hiroi N, Chrousos GP, Kino T. HIV-1 protein Vpr suppresses IL-12 production from human monocytes by enhancing glucocorticoid action: potential implications of Vpr coactivator activity for the innate and cellular immunity deficits observed in HIV-1 infection. J Immunol 2002; 169:6361-6368
  180. Fakruddin JM, Laurence J. HIV-1 Vpr enhances production of receptor of activated NF-kB ligand (RANKL) via potentiation of glucocorticoid receptor activity. Arch Virol 2005; 150:67-78
  181. Kino T, Gragerov A, Slobodskaya O, Tsopanomichalou M, Chrousos GP, Pavlakis GN. Human immunodeficiency virus type-1 (HIV-1) accessory protein Vpr induces transcription of the HIV-1 and glucocorticoid-responsive promoters by binding directly to p300/CBP coactivators. J Virol 2002; 76:9724-9734
  182. Goodman RH, Smolik S. CBP/p300 in cell growth, transformation, and development. Genes Dev 2000; 14:1553-1577
  183. Shrivastav S, Kino T, Cunningham T, Ichijo T, Schubert U, Heinklein P, Chrousos GP, Kopp JB. Human immunodeficiency virus (HIV)-1 viral protein R suppresses transcriptional activity of peroxisome proliferator-activated receptor g and inhibits adipocyte differentiation: implications for HIV-associated lipodystrophy. Mol Endocrinol 2008; 22:234-247
  184. Sherman MP, Schubert U, Williams SA, de Noronha CM, Kreisberg JF, Henklein P, Greene WC. HIV-1 Vpr displays natural protein-transducing properties: implications for viral pathogenesis. Virology 2002; 302:95-105
  185. Kino T, Slobodskaya O, Pavlakis GN, Chrousos GP. Nuclear receptor coactivator p160 proteins enhance the HIV-1 long terminal repeat promoter by bridging promoter-bound factors and the Tat-P-TEFb complex. J Biol Chem 2002; 277:2396-2405
  186. Fawell S, Seery J, Daikh Y, Moore C, Chen LL, Pepinsky B, Barsoum J. Tat-mediated delivery of heterologous proteins into cells. Proc Natl Acad Sci U S A 1994; 91:664-668
  187. Kino T, De Martino MU, Charmandari E, Ichijo T, Outas T, Chrousos GP. HIV-1 accessory protein Vpr inhibits the effect of insulin on the Foxo subfamily of forkhead transcription factors by interfering with their binding to 14-3-3 proteins: potential clinical implications regarding the insulin resistance of HIV-1-infected patients. Diabetes 2005; 54:23-31
  188. Barthel A, Schmoll D, Unterman TG. FoxO proteins in insulin action and metabolism. Trends Endocrinol Metab 2005; 16:183-189
  189. Baumann CA, Chokshi N, Saltiel AR, Ribon V. Cloning and characterization of a functional peroxisome proliferator activator receptor-g-responsive element in the promoter of the CAP gene. J Biol Chem 2000; 275:9131-9135
  190. Wangsomboonsiri W, Mahasirimongkol S, Chantarangsu S, Kiertiburanakul S, Charoenyingwattana A, Komindr S, Thongnak C, Mushiroda T, Nakamura Y, Chantratita W, Sungkanuparph S. Association between HLA-B*4001 and lipodystrophy among HIV-infected patients from Thailand who received a stavudine-containing antiretroviral regimen. Clin Infect Dis 2010; 50:597-604
  191. Shrivastav S, Zhang L, Okamoto K, Lee H, Lagranha C, Abe Y, Balasubramanyam A, Lopaschuk GD, Kino T, Kopp JB. HIV-1 Vpr enhances PPARb/d-mediated transcription, increases PDK4 expression, and reduces PDC activity. Mol Endocrinol 2013; 27:1564-1576
  192. Agarwal N, Iyer D, Patel SG, Sekhar RV, Phillips TM, Schubert U, Oplt T, Buras ED, Samson SL, Couturier J, Lewis DE, Rodriguez-Barradas MC, Jahoor F, Kino T, Kopp JB, Balasubramanyam A. HIV-1 Vpr induces adipose dysfunction in vivo through reciprocal effects on PPAR/GR co-regulation. Sci Transl Med 2013; 5:213ra164
  193. Agarwal N, Iyer D, Gabbi C, Saha P, Patel SG, Mo Q, Chang B, Goswami B, Schubert U, Kopp JB, Lewis DE, Balasubramanyam A. HIV-1 viral protein R (Vpr) induces fatty liver in mice via LXRα and PPARα dysregulation: implications for HIV-specific pathogenesis of NAFLD. Sci Rep. 2017; 7(1):13362
  194. Tarr PE, Taffe P, Bleiber G, Furrer H, Rotger M, Martinez R, Hirschel B, Battegay M, Weber R, Vernazza P, Bernasconi E, Darioli R, Rickenbach M, Ledergerber B, Telenti A. Modeling the influence of APOC3, APOE, and TNF polymorphisms on the risk of antiretroviral therapy-associated lipid disorders. J Infect Dis 2005; 191:1419-1426
  195. Behrens GM, Stoll M, Schmidt RE. Lipodystrophy syndrome in HIV infection: what is it, what causes it and how can it be managed? Drug Saf 2000; 23:57-76
  196. Zanone Poma B, Riva A, Nasi M, Cicconi P, Broggini V, Lepri AC, Mologni D, Mazzotta F, Monforte AD, Mussini C, Cossarizza A, Galli M. Genetic polymorphisms differently influencing the emergence of atrophy and fat accumulation in HIV-related lipodystrophy. Aids 2008; 22:1769-1778
  197. Manenschijn L, Scherzer R, Koper JW, Danoff A, van Rossum EF, Grunfeld C. Association of glucocorticoid receptor haplotypes with body composition and metabolic parameters in HIV-infected patients from the FRAM study. Pharmacogenet Genomics 2014; 24:156-161


Normal Physiology of ACTH and GH Release in the Hypothalamus and Anterior Pituitary in Man

ABSTRACT


This chapter summarizes the intimate relationship between the hypothalamus and the anterior pituitary with respect to the secretion of ACTH and GH from the physiological viewpoint. Other chapters in Endotext cover the hormones prolactin, LH, FSH, TSH and the posterior pituitary. Adrenocorticotropic hormone (ACTH) and growth hormone (GH) are both peptide hormones secreted from the anterior pituitary. ACTH is derived from cleavage of the precursor hormone pro-opiomelanocortin (POMC) by prohormone convertase enzymes. Classically, it activates the production and release of cortisol from the zona fasciculata of the adrenal cortex via the melanocortin receptor MC2R. The major hypophysiotropic factor controlling ACTH expression and secretion is corticotropin-releasing hormone (CRH), in conjunction with arginine vasopressin (AVP). Key physiological features of the hypothalamo-pituitary-adrenal (HPA) axis are discussed, including the ultradian pulsatility of CRH, AVP and ACTH secretion, the circadian pattern of secretion, the negative feedback of cortisol on the HPA axis, the stress response, and the effects of aging and gender. GH is secreted mainly by somatotrophs in the anterior pituitary but it is also expressed in other parts of the brain. Similarly, to ACTH, the release of GH is pulsatile with diurnal variation, under a negative feedback auto-regulatory loop, and can be affected by various factors. Activities that affect secretion of GH include sleep and exercise, and physical stresses such as fasting and hypoglycemia, hyperglycemia, hypovolemic shock and surgery. GH secretion demonstrates differences between the sexes, with male ‘pulsatile’ secretion versus female ‘continuous’ secretion. In addition, the level of secretion also declines with age, a phenomenon termed the ‘somatopause’. All these are discussed in detail in this chapter.


THE HYPOTHALAMO-PITUITARY INTERFACE


The hypothalamus and pituitary serve as the body’s primary interface between the nervous system and the endocrine system. This interface takes the form of:


  • Amplification from femto (10-15) and pico (10-12)-molar concentrations of hypophysiotropic hormones to nano (10-9) molar concentrations of pituitary hormones;
  • Temporal smoothing from ultradian pulsed secretion of hypophysiotropic hormones to circadian rhythms of pituitary hormone secretion (1).


The function of this interface is modified by feedback, usually negative, via the nervous system and via the endocrine system.


REGULATION OF ACTH


Cells of Origin


ACTH is released from corticotrophs in the human pituitary, constituting 15-20% of the cells of the anterior pituitary (see Endotext chapter- Development and Microscopic Anatomy of the Pituitary Gland). They are distributed in the median wedge, anteriorly and laterally, and posteriorly adjacent to the pars nervosa. These cells are characteristically identified from their basophil staining and PAS-positivity due to the high glycoprotein content of the N-terminal glycopeptide of pro-opiomelanocortin (vide infra), as well as ACTH immunopositivity. Scattered ACTH-positive cells are also present in the human homologue of the intermediate lobe. Some of these appear to extend into the posterior pituitary, the so-called “basophilic invasion” (2).


ACTH/POMC


POMC GENE STRUCTURE  


ACTH is derived from a 266 amino acid precursor, pro-opiomelanocortin (POMC: Figure 1). POMC is encoded by a single-copy gene on chromosome 2p23.3 over 8 kb (3). It contains a 5′ promoter and three exons. Apart from the hydrophobic signal peptide and 18 amino acids of the N-terminal glycopeptide, the rest of POMC is encoded by the 833 bp exon 3.

Figure 1. POMC and its derivatives

POMC PROMOTER


The promoter of POMC has most extensively been studied in rodents (4). Common transcription elements such as a TATA box, a CCAAT box, and an AP-1 site are found within the promoter (5,6). Corticotroph and melanotroph-specific transcription of POMC appears to be dependent on a CANNTG element motif synergistically binding corticotroph upstream transcription element-binding (CUTE) proteins (7). These include neurogenic differentiation 1 factor (NeuroD1) (8), pituitary homeobox 1 (Pitx1 or Ptx1) (9), and Tpit (10,11). NeuroD1 is a member of the NeuroD family and forms heterodimers with other basic-helix-loop-helix (bHLH) proteins, activating transcription of genes that contain an E-box, in this case POMC. This highly restricted pattern of expression in the nervous and endocrine systems is important during development. NeuroD1 is expressed in corticotrophs but not melanotrophs, thus indicating that there are some differences between the operations of the transcriptional mechanisms of these two POMC-expressing cell types (8). Tpit is a transcription factor of the T-box family and it plays an important role in late-stage cell determination of corticotrophs and melanotrophs (10). Pitx1 is a homeoprotein belonging to a class of transcription factors that are involved in organogenesis and cell differentiation. Both Tpit and Pitx1 bind to their respective responsive elements and are involved in controlling the late differentiation of POMC gene expression, maintaining a basal level of POMC transcription and participating in hormone-induced POMC expression (12). To summarize the respective roles of the CUTE proteins, Pitx1 confers pituitary specificity in the broadest sense, Tpit confers the POMC lineage identity common to corticotrophs and melanotrophs, whereas NeuroD1 expression confers corticotroph identity (4). However, CUTE proteins are not the only method by which POMC expression is differentiated between corticotrophs and melanotrophs. The Pax7 transcription factor has been shown to be a key determinant of melanotroph identity, and it works by remodeling chromatin prior to Tpit expression, opening key areas of chromatin to allow Tpit and other transcription factors access to enhancers, resulting in melanotroph specification (13).


Ikaros transcription factors, which had previously been characterized as being essential for B and T cell development, have been demonstrated to bind and regulate the POMC gene in mice. Moreover, Ikaros knockout mice demonstrate impaired corticotroph development in their pituitaries, as well as reduced circulating ACTH, MSH, and corticosterone levels (14), suggesting a role in corticotroph development.


POMC transcription is positively regulated by corticotrophin releasing hormone (CRH). CRH acts via its G-protein coupled receptor to activate adenylate cyclase, increase intracellular cAMP and stimulate protein kinase-A (15). Transcription stimulation is mediated by an upstream element (PCRH-RE) binding a novel transcription factor (PCRH-REB) containing protein kinase-A phosphorylation sites (16). CRH also stimulates the transcription of c-Fos, FosB and JunB, as well as binding to the POMC AP-1 site (17). Another secondary messenger pathway that controls POMC expression involves intracellular Ca2+ ions (18). Both cAMP and intracellular Ca2+ pathways cross-talk with each other(19). These findings further support the importance of cAMP and Ca2+ in the intracellular signaling of corticotrophs and melanotrophs. Interestingly, there is a remarkable absence of cAMP-responsive elements (CRE) and Ca2+responsive elements (CaRE) in the promoter region of POMC despite the demonstrated importance of cAMP and Ca2+ in the intracellular signaling of corticotrophs and melanotrophs. Other, more indirect strategies have evolved to translate cAMP signals into changes in POMC gene expression involving a CREB/c-Fos/AP-1 signaling cascade activating POMC transcription via an activator protein-1 (AP-1) site in exon 1. Similarly, intracellular Ca2+ may signal via the Ca2+ binding repressor DREAM (downstream response element-antagonist modulator) and modulation of c-Fos expression (20).


CRH also activates POMC expression through a Nur response element which binds the related orphan nuclear receptors Nur77, Nurr1, and NOR1 (21). The pituitary adenylate cyclase-activating peptide (PACAP) also stimulates cAMP synthesis and POMC transcription, presumably through a common pathway with CRH (22).


The effect of Nuclear transcription factor kappa B (NF-κB) on POMC expression is unclear. Although NF-κB is mostly associated with an activation of gene expression, it has been shown to inhibit POMC gene expression by binding to the promoter region (23). In keeping with this finding, CRH treatment blocks this binding, leading to an increase in POMC expression. On the contrary, it has also been shown that more pertinent high glucose (metabolic stress condition) elevates POMC transcription in AtT-20 cells through, or at least in part, the NF-κB responsive element and AP-1 sites (24).


POMC mRNA transcription in corticotrophs is negatively regulated by glucocorticoids (25), although glucocorticoids increase expression of POMC in the hypothalamus (26). The inhibitory effect of glucocorticoids on corticotroph POMC expression appears, in the rat POMC promoter, to be dependent on a glucocorticoid response element partially overlapping the CCAAT box (27). The element binds the glucocorticoid receptor as a homodimer plus a monomer on the other side of the DNA helix (28). Glucocorticoid regulation of corticotroph POMC transcription is also indirectly mediated via other mechanisms such as down-regulation of c-jun expression and direct protein-protein mediated inhibition of CRH-induced AP-1 binding (29), inhibition of CRH receptor transcription (30), inhibition of CRH/cAMP induced activation of Tpit/Pitx1, inhibition of CRH action via the Nur response element (12), and suppression of NeuroD1 expression which in turn inhibits the positive NeuroD1/E-box interaction in the POMC promoter (31).


There are also some other nuclear receptors and respective ligands that show potential roles in POMC regulation. All-trans retinoic acid (ATRA), a stereoisomeric form of retinoic acid, has been shown to inhibit POMC transactivation and ACTH secretion in murine corticotroph tumor AtT20 cells via inhibition of AP-1 and Nur transcriptional activities (32). Mutations in the retinoic acid receptor-related orphan receptors (ROR) also result in enhanced corticosterone secretion and ACTH response as well as a lack of diurnal variation compared to wild-type mice (33). As for the thyroid hormone and its receptor, there appears to be no reported direct interaction with the POMC promoter, although POMC-/- animals are known to display primary hyperthyroidism (34). More studies are needed to elucidate the potential roles of different nuclear receptors and ligands in POMC regulation. It is also important to note that most of these studies were conducted using tumor cells or in vitro models, as some of the global knockout models can be lethal or difficult.


Leukemia Inhibitory Factor (LIF), a pro-inflammatory cytokine expressed in corticotrophs, has also been shown to stimulate POMC transcription via activation of the Jak-STAT pathway (35,36). This stimulation is synergistic with CRH. Deletional analysis of the POMC promoter has identified a LIF-responsive region from –407 to –301. A STAT binding site that stimulates POMC transcription and which partly overlaps with the Nur response element has been identified within the POMC promoter (37). This pathway might form an interface between the immune system and regulation of the pituitary-adrenal axis, particularly during chronic inflammation, where pro-inflammatory cytokines such as LIF might stimulate STAT3 expression and therefore POMC transcription (38). Another interface between the immune system and POMC expression involves Toll-like receptor (most likely TLR4) recognition of lipopolysaccharide, which is a component of the bacterial cell wall. This appears to act via activation of c-Fos and AP-1 expression (39).


The POMC promoter sits within a CpG island, defined as the regions in the genome which the G and C content exceeds 50%. These genomic regions are important controllers of gene expression as hypermethylation of the cytosine leads to silencing of gene expression via remodeling of the chromatin structure to favor heterochromatinization (40). Hypermethylation of the POMC promoter leads to repression of POMC expression in non-expressing tissues. In contrast, hypomethylation leads to de-repression of the POMC promoter in POMC expressing tissues (e.g. corticotrophs). Notably, a small cell lung carcinoma cell line, which expresses POMC and ACTH, possesses a hypomethylated POMC promoter, suggesting that ectopic ACTH secretion by tumors may be due to hypomethylation at a relatively early stage in carcinogenesis (41).


BIOGENESIS OF ACTH


Prohormone convertase enzymes PC1 and PC2 process POMC at pairs of basic residues (Lys-Lys or Lys-Arg). This generates ACTH, the N-terminal glycopeptide, joining peptide, and beta-lipotropin (beta-LPH) (Figure 1). ACTH can be further processed to generate alpha-melanocyte stimulating hormone (alpha-MSH) and corticotropin-like intermediate lobe peptide (CLIP), whereas beta-LPH can be processed to generate gamma-LPH and beta-endorphin (42). In corticotrophs, POMC is mainly processed to the N-terminal glycopeptide, joining peptide, ACTH, and beta-LPH; smaller amounts of the other peptides are present (43). Other post-translational modifications include glycosylation of the N-terminal glycopeptide (44), C-terminal amidation of N-terminal glycopeptide, joining peptide and alpha-MSH (45,46), and N-terminal acetylation of ACTH, alpha-MSH and beta-endorphin (47,48).


HYPOPHYSIOTROPIC HORMONES AFFECTING ACTH RELEASE


Corticotropin Releasing Hormone (CRH)


This 41 amino acid neuropeptide (49) is derived from a 196-amino acid prohormone (50). CRH is likely to be involved in all the three types of stress responses: behavioral, autonomic and hormonal. CRH immunoreactivity is mainly found in the paraventricular nuclei (PVN) of the hypothalamus, often co-localized with AVP (51). CRH is part of a family of neuropeptides together with the urocortins 1, 2 and 3 (52).


CRH binds to G-protein coupled seven-transmembrane domain receptors (53,54), which are classically coupled to adenylate cyclase via Gs, stimulating cAMP synthesis and PK-A activity. However, it is increasingly clear that CRH receptors also couple to Gi (inhibiting adenylate cyclase) and Gq (stimulating phospholipase C, the processing of phosphatidylinositol 4,5-bisphosphate into inositol trisphosphate and diacylglycerol and intracellular Ca2+ release), as well as the recruitment of beta-arrestins which counter-regulate CRH-R function via G-protein decoupling and receptor internalization/desensitization (52).


To date, two CRH receptor genes have been identified in humans. CRH-R1 mediates the action of CRH at corticotrophs by binding to CRH; it also binds urocortin 1. CRH-R1 is most extensively expressed in the CNS. CRH-R2 binds to all three urocortins, while binding CRH at a far lower affinity (52). CRH-R2 is predominantly expressed in the heart and has profound effects on the regulation of the cardiovascular system and blood pressure (55,56).


Besides stimulating POMC transcription and ACTH biogenesis, CRH stimulates the release of ACTH from corticortophs via CRH-R1 leading to a biphasic response with the fast release of a pre-synthesized pool of ACTH, and the slower and sustained release of newly-synthesized ACTH (57). Figure 2 describes the stimulation of ACTH release by CRH (58). It is clear that CRH and CRH-R1 is the ‘main line’ of the HPA axis with major defects in this axis with CRH (59) and CRH-R1 knockout (60). Although urocortin 1 can also activate CRH-R1, urocortin 1 knockout mice appear to have normal HPA axis function, suggesting that urocortin 1 does not have a significant regulatory role on the axis (61). Indeed, knocking out all three urocortins does not have any major effect on basal corticosterone levels (62)although female urocortin 2 knockout mice exhibit a more subtle dysregulation with elevated basal ACTH and corticosterone secretion which is modulated by their estrogen status (63).


Figure 2. Diagram showing the release of ACTH from corticotroph cells. CRH binds to a particular receptor that leads to activation of cAMP. The rise in cAMP inhibits TREK-1, thus leading to the depolarization of the cell and subsequently influx of calcium via VGCC. The rise in intracellular calcium leads to the exocytosis and release of ACTH.

CRH secretion is also regulated by other neurotransmitters and cytokines. These include acetylcholine, norepinephrine/noradrenaline, histamine, serotonin, gamma-aminobutyric acid (GABA), interleukin-1beta, and tumor necrosis factor.  All of these factors increase hypothalamic CRH expression, except for GABA which is inhibitory.


Arginine Vasopressin (AVP)


In the anterior pituitary, AVP principally binds to the seven-transmembrane domain V1b receptor, also known as the V3 receptor (64). The receptor is coupled to phospholipase C, phosphatidyl inositol generation, and activation of protein kinase-C (65,66) and not via adenylate cyclase and cAMP (15). AVP stimulates ACTH release weakly by itself, but synergizes with the effects of CRH on ACTH release (67). Downregulation of protein kinase C by phorbol ester treatment abolishes the synergistic effect of AVP on ACTH release by CRH (68). AVP does not stimulate POMC transcription either by itself or in synergism with CRH (69). Between the two neuropeptide effects on ACTH release, CRH is the more dominant effect although there is some residual HPA axis activation in female CRH knockout mice (59).


The association between AVP and ACTH release suggests that measurement of AVP levels might be useful for assessing anterior pituitary function. However, direct measurement of plasma AVP is technically difficult due to its small molecular size and binding to platelets. Copeptin is a 39-amino acid glycosylated peptide which is derived from the C-terminal part of the AVP precursor at an equimolar amount to AVP. It remains stable for several days at room temperature in serum or plasma, and its measurement is reliable and reproducible, making it a biomarker of AVP release (70). The copeptin increment during glucagon stimulation testing correlates well with the ACTH increment in healthy controls, but not in patients with pituitary disease (71). Interestingly, there appears to be a sexual dimorphism in terms of the correlation between copeptin and ACTH/cortisol release under the conditions of insulin tolerance testing, with a positive correlation observed in women but no significant correlation in men, i.e. copeptin cannot be used as a universal marker of HPA axis stimulation (72).


Other Influences on ACTH Release


Oxytocin and AVP have been co-localized to the PVN and supraoptic nuclei of the hypothalamus (73). Oxytocin controversially inhibits ACTH release in man (74-76) by competing for AVP receptor binding (77), but its more dominant effect seems to be a potentiation of the effects of CRH on ACTH release (78,79).


Vasoactive intestinal peptide (VIP) and its relative, peptide histidine isoleucine (PHI), have been shown to activate ACTH secretion (80). This is most probably mediated indirectly via CRH (81).


Atrial natriuretic peptide (ANP) 1-28 has been localized to the PVN and supraoptic nuclei (82). In healthy males, infusion of ANP 1-28 was reported to attenuate the ACTH release induced by CRH (83,84), but this only occurs under highly specific conditions and is not readily reproducible. In physiological doses, ANP 1-28 does not appear to affect CRH-stimulated ACTH release (85).


Opiates and opioid peptides inhibit ACTH release (86). There does not seem to be a direct action at the pituitary level. It is likely that these act by modifying release of CRH at the hypothalamic level (87).  Opiate receptor antagonists such as naloxone or naltrexone cause ACTH release by blocking tonic inhibition by endogenous opioid peptides (88).


The endocannabinoid system has recently appeared as a key player in regulating the baseline tone and stimulated peaks of ACTH release. The seven-transmembrane cannabinoid receptor type 1 (CB1) is found on corticotrophs, and the endocannabinoids anandamide and 2-arachidonoylglycerol can be detected in normal pituitaries (89). Antagonism of CB1 causes a dose-dependent rise in corticosterone levels in mice (90). CB1-/- knockout mice demonstrate higher corticosterone levels compared to wild-type CB1+/+ littermates, although the circadian rhythm is preserved. Treatment of the CB1-/- mice with low-dose dexamethasone did not significantly suppress their corticosterone levels and surprisingly caused a paradoxical rise in ACTH levels when compared to the wild-type, although high-dose dexamethasone suppressed corticosterone and ACTH to the same degree in both CB1-/- and CB1+/+ mice. These CB1-/- mice have: (1) higher CRH mRNA expression in the PVN; (2) lower glucocorticoid receptor mRNA expression in the CA1 hippocampal region, but not in the dentate gyrus or the PVN; (3) significantly higher baseline ACTH secretion from primary pituitary cell cultures as well as augmented ACTH responses to stimulation with CRH or forskolin (91). It has also been known for some time that the administration of the cannabinoid agonist delta-9-tetrahydrocannabinol (THC) for 14 days suppresses the cortisol response to hypoglycemia in normal humans (92). Thus, the endocannabinoids appear to negatively regulate basal and stimulated ACTH release at multiple levels of the hypothalamo-pituitary-adrenal axis.


Catecholamines act centrally via alpha1-adrenergic receptors to stimulate CRH release. Peripheral catecholamines do not affect ACTH release at the level of the pituitary in humans (93).


Nitric oxide (NO) and carbon monoxide negatively modulate the HPA axis by reducing CRH release, at least in vitro(94,95). Endotoxin administered into isolated rat hypothalamus led to generation of NO and CO, which subsequently led to significant decrease in CRH and vasopressin secretion (95).


GH secretagogues such as ghrelin and the synthetic GH secretagogue hexarelin stimulate ACTH release, probably via stimulating AVP release with a much lesser effect on CRH (96-99). GH-releasing peptide-2 (GHRP-2) has also been shown to cause ACTH release in humans (100,101). GH releasing hormone (GHRH) has been shown to potentiate the ACTH and cortisol response to insulin-induced hypoglycemia, but not to potentiate the ACTH and cortisol response after administration of CRH/AVP (102).


Obestatin, a 23 amino acid amidated peptide, is derived from preproghrelin, which is the same precursor as ghrelin (Figure 3). Obestatin is found to suppress food intake and have opposing metabolic effects to ghrelin when administered intraperitoneally in mice (103). An early study showed that intravenous or intracerebroventricular obestatin had no effects on pituitary hormone release (GH, prolactin, ACTH and TSH) in male rats (104), consistent with the fact that the obestatin receptor GPR39 is not expressed in the pituitary (103,105,106). A study in mice and non-human primates (baboon) again showed no effects of obestatin on prolactin, LH, FSH and TSH expression and release. However, obestatin was shown to stimulate POMC expression and ACTH release in vitro and in vivo, and in this study the authors found GPR39 expression in pituitary tissue and primary pituitary cell cultures, contrary to the above-mentioned studies. This effect was mediated by the adenylyl cyclase and MAPK pathways. The increase in ACTH release was also associated with an increase in pituitary CRH receptor expression. Interestingly, obestatin did not inhibit the stimulatory effect of ghrelin on ACTH release (107). Therefore, the effects of obestatin on pituitary hormone secretions remain controversial.

Figure 3. Schematic diagram showing the synthesis of ghrelin and obestatin from the same precursor, preproghrelin. Preproghrelin is a 117 amino acid precursor encoded at chromosome 3. Cleavage of this protein leads to the production of ghrelin, a 28 amino acid peptide, and obestatin, a 23 amino acid protein. Ghrelin can be present as both des-acyl- and acyl-ghrelin (figure modified from (291)).

Angiotensin II (Ang II) is able to stimulate ACTH release in vitro from pituitary cells (108). Central Ang II is likely to stimulate CRH release via its receptors in the median eminence, as passive immunization with anti-CRH can abolish the effect of Ang II (109). Intracerebroventricular Ang II can stimulate ACTH release in rats (110) and is able to stimulate the synthesis of CRH and POMC mRNA (111). Conversely, blockade of Ang II subtype 1 (AT1) receptors with candesartan is able to decrease the CRH, ACTH, and cortisol response to isolation stress in rats (112,113). There is some controversy as to whether peripheral Ang II can modulate ACTH secretion. It is likely that the ACTH rise seen after Ang II infusion into rats is mediated via circumventricular organ stimulation, as blockade of Ang II effects on the circumventricular organs with simultaneous infusion of saralasin blocks this rise (110).


In vitro studies have shown an inhibitory effect of somatostatin on ACTH release in AtT-20 pituitary cell lines from rats, which is mediated via somatostatin receptor (SSTR) subtypes 2 and 5 (114). This inhibitory effect is dependent on the absence of glucocorticoids in the culture medium, but is more prominent when somatostatin analogues targeting SSTR 5 are used (115,116). In rodents, pasireotide, a somatostatin analogue capable of activating SSTRs 1, 2, 3, and 5, is capable of inhibiting CRH-stimulated ACTH release in contrast to octreotide (selective for SSTRs 2 and 5), which was less efficacious (117). Early in vivo studies in humans showed no effect of somatostatin on basal or CRH-stimulated ACTH release (118), although somatostatin does decrease basal secretion in the context of Addison’s disease (119). It is unlikely, therefore, that somatostatin itself is an inhibitor of ACTH release in normal human physiology. Corticotroph adenomas express the somatostatin receptor (SSTR) subtype 5 (120) and ACTH secretion from cultured corticotroph adenomas is inhibited by pasireotide (121). This is the basis for the use of pasireotide to treat Cushing’s disease (122). Octreotide is clinically ineffective in this context (123), but may be effective if glucocorticoids are lowered.


The role of TRH in ACTH release is in dispute. Although there is evidence that prepro-TRH 178-199 can inhibit both basal and CRH-stimulated ACTH release in AtT-20 cell lines and rat anterior pituitary cells (124,125), other investigators have not been able to confirm this (126). There has also been another study showing that TRH is able to induce ACTH release from AtT-20/NYU-1 cells (127), but no in vivo studies exist to substantiate a physiological role.


Tumor necrosis factor-alpha (TNFalpha) is a macrophage-derived pleiotropic cytokine that has been shown to stimulate plasma ACTH and corticosterone secretion in a dose-dependent manner (128). The primary site of action of TNFalpha effect on the HPA axis is likely to be on hypothalamic CRH-secreting neurons. The effects are abolished with CRH antiserum treatment, thus suggesting that CRH is a major mediator of the HPA axis response to TNFalpha.


Interleukins IL-1, IL-6 and possibly IL-2 appear to stimulate ACTH release (129-131). There seem to be multiple mechanisms for interleukins to stimulate ACTH release, but most of the acute effects of these agents are almost certainly via the hypothalamus (132).


Leukemia Inhibitory Factor is able to stimulate POMC synthesis, as noted above.


Endothelial Growth Factor (EGF) is a pituitary cell growth factor that is previously known to induce production of prolactin (133). Both EGF and its receptor (EGFR) are expressed in normal pituitary tissue (134). More recently, EGF has been found to regulate the transcription of POMC and production of ACTH (135-137). The mechanism behind this is still unclear, although mutations in ubiquitin-specific protease 8 (USP8), a deubiquitinase enzyme with various targets including EGFR, leading to hyperactivation of this enzyme and subsequent increased EGFR deubiquitination and recirculation to the cell surface, enhance the release of ACTH (135,138). A significant percentage of corticotroph adenomas harbor somatic mutations in USP8, and a germline mutation case have also been described and can develop Cushing’s disease (135,138,139). These findings further provide evidence that EGF and EGFR can regulate production of ACTH.     


PHYSIOLOGY OF ACTH RELEASE


Pulsatility of ACTH Release


Frequent sampling of ACTH with deconvolution analysis reveals that it is secreted in pulses from the corticotroph with 40 pulses ± 1.5 measured per 24 hours, on analysis of 10-minute sampling data. These pulses temporally correlate with the pulsed secretion of cortisol, allowing for a 15 minute delay in secretion, and correlate in amplitude (140). Pulse concordance has been measured at 47% (ACTH to cortisol) and 60% (cortisol to ACTH) in one study (141), and 90% (ACTH to cortisol) in another (142). Although the pulsatility of ACTH secretion may result from pulsatile CRH release, there is evidence that isolated human pituitaries intrinsically release ACTH in a pulsatile fashion (143).


Circadian Rhythm


In parallel with cortisol, ACTH levels vary in an endogenous circadian rhythm, reaching a peak between 06.00-09.00h, declining through the day to a nadir between 23.00h-02.00h, and beginning to rise again at about 02.00-03.00h. An increase in ACTH pulse amplitude rather than frequency is responsible for this rhythm (140). The circadian rhythm in glucocorticoid secretion is a key mechanism for re-entraining behavior in the face of external perturbations such as an abrupt phase shift of light conditions, i.e. a model of ‘jet lag’ (144).


The circadian rhythm is mediated via a master oscillator in the supra-chiasmatic nucleus (SCN). A lesion in the SCN eliminates the glucocorticoid circadian rhythm (145). An autoregulatory negative transcription-translation loop feedback system involving cyclical synthesis of the period proteins Per1-3, Clock/BMAL1, and Cry1/2 acts as the basic molecular oscillator, where the Clock/BMAL1 heterodimer acts to activate the transcription of Per and Cry proteins (the so-called ‘positive limb’). In turn, the Per and Cry proteins complex together, translocate back into the nucleus and inhibit Clock/BMAL1-mediated transcription (the so-called ‘negative limb’). The system is reset by phosphorylation, ubiquitination and proteasomal degradation of the Per/Cry repressor complexes (146,147). Entrainment of the oscillator is achieved by light input from the retina, mediated via the retino-hypothalamic tract. Light-activated transcription of immediate-early genes such as c-fos and JunB (148,149) causes activation of PER1 gene transcription as well as modification of the acetylation pattern of histone tails. The latter are implicated in the control of chromatin structure and accessibility of genes to transcription (150). The impact of a period protein gene deletion on circulating glucocorticoids depends on which side of the clock feedback loop is affected (147). Knockout mice with mutations in the components of positive limb of the oscillator (Clock or BMAL1) suffer from hypocortisolism and lose circadian cyclicity (151,152). The deletion of Per2, which affects the negative limb of the oscillator, also results in hypocortisolism (153). However, Cry1 knockout (also affecting the negative limb) leads to hypercortisolism (154,155).


Is a circadian rhythm in CRH secretion responsible for the ACTH rhythm? Although there is a report of a circadian rhythm in CRH secretion (156), and in situ hybridization studies show that there is a circadian rhythm in CRH expression in the suprachiasmatic nucleus (157), other reports do not confirm this (158). Moreover, the circadian rhythm persists despite a continuous infusion of CRH, suggesting that other factors are responsible for the modulation of ACTH pulses (159). The most likely alternative candidate is AVP: immunocytochemical studies show a circadian rhythm in AVP expression (160) and Clock knockout mice show a loss of the circadian rhythm in AVP RNA expression in the SCN (161). In addition, metyrapone and CRH infusion in normal individuals showed a persistence of the HPA circadian rhythm, thus further supporting the role of AVP in regulating ACTH rhythm (159).


However, rhythmic HPA axis activity is not the be-all and end-all of the circadian rhythm of glucocorticoid release. For example, the adrenal rhythm of cortisol secretion persists after hypophysectomy (162). Indeed, light pulses can induce glucocorticoid secretion independent of ACTH secretion. This HPA axis-independent pathway is mediated by the sympathetic nervous system innervation of the adrenals (163). The adrenal glands also possess an independent circadian oscillator: oscillatory Clock/BMAL1, Per1-3 and Cry1 expression is seen in the outer adrenal cortex (zona glomerulosa and zona fasciculata). This adrenal circadian clock appears to ‘gate’ the response to ACTH, i.e. it defines a time window during which ACTH is most able to stimulate glucocorticoid secretion (164). Exogenous ACTH is capable of phase-dependently resetting glucocorticoid rhythms (165), suggesting that the adrenal circadian clock can be entrained by the ACTH rhythm. This illustrates a general principle of circadian system organization, namely that there is a hierarchical system with the SCN master clock entraining and coordinating peripheral and non-SCN tissue clocks via endocrine and neuronal signals.


Stress


Stress, both physical and psychological, induces the release of ACTH and cortisol, particularly via CRH and AVP (166,167), and increases the turnover of these neurohypophysiotropic factors by increasing the transcription of CRH and AVP (168).


During acute stress, an immediate activation of the autonomic nervous system takes place, followed by a delayed response via the HPA axis-mediated release of glucocorticoids (147). During the initial stage, there is an immediate increase of catecholamines via activation of the sympathetic preganglionic neurons in the spinal cord, which in turn stimulates adrenal medulla production of catecholamines via splanchnic nerve innervation. The catecholamines released will also collectively affect peripheral effector organs where they are translated into the classical fight-or-flight response. The delayed response of stress involves activation of the HPA axis, leading to an increase in glucocorticoid level, which in turn can terminate the effects of the sympathetic response together with the reflex parasympathetic activation. It is important to note that this neurohormonal stress response has an additional endocrine leg in the form of glucagon: together, one of the important effects of this trio is to enhance the release of glucose, amino acids and fatty acids, a coordinated catabolic response to stress (169).


Stress paradigms studied in humans include hypoglycemia during the insulin tolerance test (Figure 4), and venipuncture (170). Elective surgery has also long been used as a paradigm of the stress response in humans (171-173): the magnitude of cortisol rise correlates positively with the severity of surgery (174). Experimentally, other stress paradigms such as hemorrhage, oxidative stress, intraperitoneal hypertonic saline, restraint/immobilization, foot shock, forced swimming, or shaking are used to study the stress responses in animals. Importantly, different stress paradigms can have differential effects on CRH and AVP. In situ hybridization with intronic and exonic probes can be used to study the transcription of heterogenous nuclear RNA (hnRNA), followed by its processing (including splicing, capping and polyadenylation) to messenger RNA (mRNA) within 1-2 hours. CRH and AVP hnRNA levels in rats subjected to restraint show significant increases at 1 and 2 hours after the induction of stress, followed by significant increases in mRNA levels at 4 hours (175). In contrast, intraperitoneal hypertonic saline causes a rapid 8.6-fold increase in CRH hnRNA and mRNA within 15 minutes, returning to basal levels by 1 hour. AVP hnRNA responses are slower, peaking at 11.5-fold increase by 2 hours, followed by a prolonged elevation of AVP mRNA levels from 4 hours onwards (176). As previously noted, serum copeptin can be used as a more stable biomarker of AVP secretion and copeptin increments correlate well with cortisol secretion in a glucagon stimulation test paradigm (71), but exhibit a sexual dimorphism in the context of the insulin tolerance test (72).

Figure 4. Typical response to hypoglycemia (≤2.2 mmol/l) induced by 0.15 U/kg Actrapid i.v. in a normal subject. Peak cortisol is ≥550 nmol/l.

Various stressors are known to stimulate oxytocin release which in turn, at least acutely, appears to potentiate CRH-induced ACTH secretion and therefore cortisol release (78). There are also roles for endogenous nitric oxide (NO) and carbon monoxide (CO) in modulating the ACTH response to stress (177). Neuronal NO synthase co-localizes with AVP and to some extent CRH in paraventricular neurons (178,179). Knockout mice lacking wild-type and neuronal NO synthase have much reduced quantities of POMC immunoreactivity in their arcuate nuclei and pituitaries compared to wild-type mice (178,180).  In general, inflammatory stressors appear to activate an endogenous inhibitory pathway, whereby NO and CO attenuate the stimulated secretion of CRH and AVP. These effects can also be seen in terms of circulating AVP. However, the regulation of the pituitary-adrenal axis by other stressors may involve an activating role for these gaseous neurotransmitters. CRH-R2, as noted above, binds the urocortins 1, 2 and 3, and appears to mediate a down-regulatory role in the HPA response to stress: knockout mice exhibit a ‘hypersensitive’ acute ACTH and corticosterone response (181) and a defective recovery from stress with a slower drop in corticosterone (182).


Repetitive stress causes variable effects, enhancement or desensitization, on ACTH responses, depending on the stress paradigm involved. This appears to be positively correlated with changes in AVP binding to V1b receptors, reflecting changes in the number of binding sites and not their affinities. It is at present unclear whether this is due to changes in transcription of the V1b gene, alterations in mRNA stability, translational control or recruitment of receptors from intercellular pools (183). With chronic stress, oxytocin is thought to have a longer term stress-antagonistic function, partially via cortisol-mediated negative feedback on CRH, partially via GABAergic inhibition of CRH neuron function and partially via a direct inhibitory effect of oxytocin on CRH expression (78).


As noted above, circadian rhythms in adrenal ACTH responsiveness, controlled by local oscillator circuits, ‘gate’ the glucocorticoid output in response to a certain level of ACTH. In the case of stress, this leads to markedly different glucocorticoid responses depending on when (during the active or inactive phase) the experimental stress is applied to experimental animals. Moreover, the timing of repetitive stress application can lead to differences in the behavioral and metabolic responses to repetitive/chronic stress. Lastly, it is also known that stress can influence clock function at the level of the SCN and also at the level of the adrenal circadian oscillator leading to phase shifts (147). In humans, stressors such as illness leads to abolition of the diurnal variation of cortisol, which appears to be ACTH independent (184,185). This change in the diurnal regulation of cortisol secretion is linked to regulation of immune responses which is likely to be adaptive in the acute context, but which may be maladaptive with chronic stress (186).  


FEEDBACK REGULATION OF THE HPA AXIS


Glucocorticoid feedback occurs at multiple levels: at the pituitary, at the hypothalamus, and most importantly, centrally at the level of the hippocampus, which contains the highest concentration of glucocorticoid receptors in the central nervous system. Multiple effects mediate this feedback (Figure 5), including:


  • inhibition of CRH and AVP synthesis and release in the PVN (187,188).
  • inhibition of POMC transcription (as outlined above)
  • inhibition of ACTH release induced by CRH and AVP (189).

Figure 5. Regulation of ACTH. Green arrows denote stimulatory influences, red arrows denote inhibitory influences.

Fast feedback occurs within seconds to minutes and involves inhibition of ACTH release by the corticosteroids, mediated through the glucocorticoid receptor (GR). For example, an injection of prednisolone inhibits ovine CRH-stimulated ACTH release within 20 minutes (190). In vitro this appears to involve inhibition of CRH-stimulated ACTH release, and CRH release, but basal secretion is not affected. Protein synthesis is not required, implying that the glucocorticoid effect is non-genomic (191,192). Cell membrane-associated GR has recently been shown to directly mediate fast feedback inhibition by inhibition of Src phosphorylation in corticotrophs (193), but other work implicates the GC-induced secretion of annexin 1/lipocortin1 from folliculostellate cells as a paracrine mechanism for inhibition of ACTH release (194). In addition, receptors for ACTH (MC2R) are present in normal corticotrophs, allowing ‘ultra-fast’ feedback regulation of the HPA axis (195). The receptor expression is lost in the corticotroph adenomas of patients with Cushing’s disease, which could be the potential mechanism of resistance to feedback of the HPA axis seen in these patients (195).


Intermediate feedback occurs within 4 hours’ time frame and involves inhibition of CRH synthesis and release from CRH neurons, not affecting ACTH synthesis (192). However, it is thought that this is a relatively minor contributor to negative feedback (196). Slow feedback occurs over longer timeframes and involves inhibition of POMC transcription (192), via GR antagonism of Nur response element activation of POMC transcription by CRH. The molecular mechanism involves a GR-dependent recruitment of the histone deacetylase HDAC2 to a trans-repressor complex with Brg1, histone H4 deacetylation, and chromatin remodeling (197,198).


There is evidence that ACTH can inhibit CRH synthesis in the context of elevated CRH levels due to Addison’s disease or hypopituitarism, although not in the context of normal human subjects (199). Immunohistochemical studies of the paraventricular nuclei in adrenalectomized or hypophysectomized rats show a reduction of CRH and AVP positive cells when these rats are given ACTH infusions (200).


Glucocorticoids have also been shown to control the cell cycle in corticotrophs. This occurs via feedback repression of the positive cell-cycle regulators L-Myc, N-Myc, and E2F2, plus activation of the negative cell-cycle regulators Gadd45b, GADD45g, and Cables1. In this way, glucocorticoids negatively regulate corticotroph proliferation, a key influence which appears to be lost in corticotroph adenomas (201).


Eating


Cortisol is well known to rise after eating (202,203). This rise is provoked by two mechanisms: (i) by direct stimulation of the HPA axis; and (ii) via regeneration of cortisone to cortisol by stimulation of 11β-hydroxysteroid dehydrogenase type 1 (11βHSD1) (204). The postprandial rise in cortisol has been shown to be mediated via increased pituitary ACTH secretion, which is in turn is modulated by central stimulant alpha-1 adrenoreceptors (205). The cortisol response to food is also enhanced in obese subjects compared to normal BMI individuals (206).


There also appear to be key differences between the effects of individual macronutrients, where carbohydrates lead to equal stimulation of the HPA axis and 11βHSD1, and where fat and protein led to greater stimulation of the HPA axis compared to 11βHSD1. Direct intravenous infusion of macronutrients such as Intralipid and amino acids does not stimulate cortisol secretion (207,208). The most likely candidates for the factors that mediate stimulation of the HPA axis after eating are the gut hormones which are released in response to enteral nutrients. For example, glucagon-like peptide-17-36 (GLP-17-36) has been shown to stimulate cortisol and ACTH secretion, suggesting a direct effect on the hypothalamus/pituitary (209-211). Gastric inhibitory peptide (GIP), however, has not been shown to stimulate cortisol secretion except in the special case of ectopic GIP receptors in bilateral adrenal hyperplasia, causing food-stimulated Cushing’s syndrome (212). 11bHSD1 activity appears to be inhibited by GIP (213), therefore suggesting the GIP is not a key player in mediating the post-prandial rise in cortisol. Although ghrelin has been shown to increase cortisol secretion when given in infusion (96-98), ghrelin is suppressed after eating, making it an unlikely mediator of the post-prandial cortisol response.


AGING OF THE HPA AXIS


Studies in humans and experimental animals have shown evidence that hyperactivity of the HPA axis contributes to neuronal and peripheral deterioration associated with aging (214,215). Hyperactivity of the HPA axis can be caused by stress and is necessary as part of the physiological adaptation. However, there must be mechanisms to limit the stress response, especially during chronic stress, in order to avoid the damaging effects of prolonged exposure to stress hormones such as CRH and corticosterone.


High basal levels of glucocorticoids and loss of circadian rhythm have been associated with greater cognitive decline at a given age (216). Aging is associated with high basal levels of circulating corticosteroids, although there is not always a correlation between plasma ACTH and corticosteroids (217-219). In addition, there is also an alteration to the circadian rhythm of the HPA axis, as demonstrated by studies using a feeding-associated circadian rhythm paradigm. It was found that it took 1 week for young rats and 3 weeks for older rats to entrain the secretion of corticosterone in response to a restricted feeding schedule where they were fed for 2 hours per day. After the rats were shifted to a different pattern of feeding, the entrained circadian rhythm of corticosterone secretion persisted much longer in young rats than in older rats. This suggests that the aged HPA axis appears to take longer to adjust to changes in circadian rhythm, but such adjustments do not ‘stick’ as well as compared to the younger HPA axis (220,221).


When the expression of CRH in the SCN was examined using in situ hybridization, younger 3-4-month-old Sprague-Dawley rats exposed to light from 04.00h to 18.00h have a clear diurnal rhythm with higher expression seen in samples taken at 03.00h versus 23.00h. This rhythm was lost in older 17-20 month old rats with equal expression seen in samples from 03.00h and 23.00h (157).  Fetal grafts containing the SCN have been shown to restore the circadian rhythm in old Sprague-Dawley rats, thereby suggesting that the altered diurnal variation of HPA axis probably involves alterations in the function of the suprachiasmatic nuclei (222).


Aging is also associated with an increase in expression of 11bHSD1 both in brain and peripheral tissues (223,224). Such changes could conceivably expose tissues to elevated levels of glucocorticoids and contribute to the aging process.


The effects of aging on CRH regulation and whether CRH influences the course of aging are still unclear. Studies have reported increased, unchanged, or reduced hypothalamic CRH release and expression during aging (216).


GENDER DIFFERENCES IN HPA AXIS REGULATION


Endogenous glucocorticoid responses to stress are significantly elevated (in an estrogen-dependent fashion) in females as compared with males (225-228). This estrogen dependence is likely mediated through estrogen-response elements within the promoter regions of CRH (229). As previously noted, there is also a sexual differential in the relationship between AVP release and the ACTH/cortisol response during insulin tolerance testing where the serum levels of copeptin (as a marker of AVP release) positively correlate with ACTH/cortisol release in women but not men (72). However, the sexual dimorphism of the stress response is not seen with exercise-induced stress (230) nor acute psychological stress (231).


REGULATION OF GH RELEASE

Somatotroph Development and Differentiation


Somatotrophs make up approximately 50% of the cell population of the anterior pituitary, and generally are concentrated in the lateral wings of the pituitary gland. These cells are characteristically acidophilic, polyhedral and immunopositive for GH and Pit-1. A smaller number of such cells are mammo-somatotrophs, i.e. immunopositive for GH and prolactin (232).


During the process of cell differentiation in the Rathke’s pouch primordium, a cascade of transcription factors is activated to specify anterior pituitary cell types. The two factors particularly involved in differentiation of the lactotroph, somatotroph, and thyrotroph lineages are Prop-1 (Prophet of Pit-1) and Pit-1, also known as GHF-1 and Pou1f1. Prop-1 is a paired-like homeodomain transcription factor; mutations in this gene cause combined GH, prolactin, and TSH deficiency. Mutations of Prop-1 will also give abnormalities of gonadotroph function and, occasionally, corticotroph reserve. Interestingly, these deficiencies are often progressive over time. Pit-1 is part of the POU homeodomain family of transcription factors that includes unc-86, Oct-1, and Oct-2 (233). Pit-1 is a key transcription factor that activates GH gene transcription in the somatotroph (vide infra).


The transcription factor Foxo1 (forkhead box transcription factor) is expressed in 40% of somatotrophs. Foxo1 is involved in the development of various other tissues slow-twitch muscle fibers, bone and pancreas, and a global knockout is lethal. A pituitary-specific knockout of Foxo1 causes a delay in the terminal differentiation of somatotrophs but does not affect commitment of pituitary progenitor cells to the somatotroph lineage (234). Foxo1 exerts its effect via stimulation of NeuroD4 expression which is also important to the terminal differentiation of somatotrophs (235).


Growth Hormone (GH)


GH GENOMIC LOCUS


Human GH was first isolated in 1956 (236) and the structure of the peptide was elucidated fifteen years later (237). Human GH is a 191 amino acids single chain peptide with two disulphide bonds and molecular weight of 22,000 daltons. The GH locus, a 66 kb region of DNA, is located on chromosome 17q22-q24 and consists of 5 homologous genes, which appear to have been duplicated from an ancestral GH-like gene (Table 1) (238,239).


Table 1. The Five Genes in the GH Locus

Gene

Product

Variant(s)

Expressed in

References

hGH-N or GH1

Normal GH

2 alternatively spliced variants (97):

22 kDa (full-length 191 aa);

20 kDa (lacking residues 32-46)

Anterior pituitary

(240)

hGH-V or GH2

Variant GH detectable in pregnancy from mid-term to delivery (241,242)

20 kDa

Placental syncytiotrophoblast cells

(243)

CSH-1, CSH-2

Chorionic somatotropin/human placental lactogen

22 kDa

Placental syncytiotrophoblast cells

(244,245)

CSH-like gene CSHL-1

Non-functional proteins

Many alternatively spliced variants


(246)


STRUCTURE OF THE GH PROMOTER


Because of their origin from an ancestral GH-like gene, all five genes in the GH genomic locus share 95% sequence identity including their promoters (247): proximal elements in the promoter bind Pit-1/GHF-1 (248-251). Pit-1 plays a central role in controlling the expression of hGH-NN gene. Inactivation or lack of functional Pit-1 expression in both mice and human inhibits the differentiation and proliferation of the pituitary cells (252). Although Pit-1 is necessary for transcription of transfected GH1 genes in rat pituitary cells, it is not sufficient (253). Other transcription factors such as Sp1, CREB, and the thyroid hormone receptor are involved (250,254,255).


A placenta-specific enhancer found downstream of the CSH genes (256) as well as pituitary-specific repressor sequences found upstream of GH2, CSH-1 and -2, and CSHL-1  may serve to limit transcription of these particular genes to the placenta (257).


A locus control region consisting of two DNase-I hypersensitive regions (HS), specifically HG-I site, 14.5 and 30 kb upstream of GH1 appears to be required for pituitary-specific GH1 expression (258). This region, which also binds Pit-1 (259), activates histone acetyltransferase, which controls chromatin structure and the accessibility of the GH locus to transcription factors (260,261). The acetylated histone domain potentiates GH transcription and, more recently, HS-I was also shown to be crucial for establishing a domain of non-coding polymerase II transcription necessary for gene activation (262).


Pit-1 is mainly expressed in the pituitary somatotrophs, but it has also notably been demonstrated to be expressed in extrapituitary tissues. Pit-1 regulates local GH expression in the mammary gland and may be involved in mammary development and possibly the pathogenesis of breast carcinoma (263).


GROWTH HORMONE STRUCTURE


This is a 191 amino acid single chain polypeptide hormone that occurs in various modified forms in the circulation. During spontaneous pulses of secretion, the majority full-length isoform of 22 kDa makes up 73%, the alternatively spliced 20 kDa isoform contributes 16%, while the ‘acidic’ desamido and N-alpha acylated isoforms make up 10%. During basal secretion between pulses other forms (30 kDa, 16 kDa and 12 kDa) can also be identified which consist of immunoreactive fragments of GH (264-266).


Higher molecular weight forms of GH exist in the circulation, representing GH bound to growth hormone binding proteins (GHBP) (267). The high-affinity GHBP consists of the extracellular domain of the hepatic GH receptor, and this binds the 22 kDa GH isoform preferentially (268). This high-affinity GHBP is released into circulation by proteolytic processing of the GH receptor by the metalloprotease TACE/ADAM-17 (269). The low-affinity GHBP binds the 20 kDa isoform preferentially (270). Binding of GH to GHBP prolongs the circulation time of GH as the complex is not filtered by the glomeruli (265). GH/GHBP interactions may also compete for GH binding to its surface receptors (271).


GH is also expressed in other areas of the brain, such as the cortex, hippocampus, cortex, caudate nucleus, and retinal areas (272), as is the GH receptor, IGF-1, and the IGF-1 receptor, where it is thought that these mediate neuroprotective and regenerative functions (273).


HYPOPHYSIOTROPIC HORMONES AFFECTING GH RELEASE


GHRH


GHRH was originally isolated from a pancreatic tumor taken from a patient that presented with acromegaly and somatotroph hyperplasia (274). GHRH is derived from a 108 amino acid prepro-hormone to give GHRH (1-40) and (1-44) (Figure 6), which are both found in the human hypothalamus (275,276). The C-terminal 30-44 residues appear to be dispensable, as residues 1-29 show full bioactivity. GHRH binds to a seven-transmembrane domain G-protein coupled receptor that activates adenylate cyclase (277), which stimulates transcription of the GH gene as well as release of GH from intracellular pools (278,279). No other hormone is released by GHRH, although GHRH has homology to other neuropeptides such as PHI, glucagon, secretin and GIP (280).

Figure 6. Hypophysiotrophic hormones influencing GH release. The pathway of GPR101 leading to GH release is currently unclear therefore not shown on this figure.

Somatostatin


Somatostatin (a.k.a. somatotropin release inhibitory factor or SRIF) is derived from a 116 amino acid prohormone to give rise to two principal forms, somatostatin-28 and -14 (281). Both of these are cyclic peptides due to an intramolecular disulphide bond (Figure 6). Somatostatin has multiple effects on anterior pituitary as well as pancreatic, liver and gastrointestinal function:


  • It inhibits GH secretion directly from somatotrophs (282,283) and antagonizes the GH secretagogue activity of ghrelin (284).
  • It inhibits GH secretion indirectly via antagonizing GHRH secretion.
  • It inhibits GH secretion indirectly via inhibiting the secretion of ghrelin from the stomach (285-287).
  • It inhibits secretion of TSH and TRH stimulation of TSH secretion from the pituitary (288,289).
  • It inhibits the secretion of CCK, glucagon, gastrin, secretin, GIP, insulin and VIP from the pancreas (290).


Somatostatin binds to specific seven-transmembrane domain G-protein coupled receptors (SSTRs), of which there are at least 5 subtypes. SSTRs 2 and 5 are the most abundant in the pituitary (291). An immunohistochemical study on fetal pituitaries has shown that SSTR 2 is present from 13 weeks gestation, mainly on thyrotrophs and gonadotrophs. SSTR 5 is mainly found on somatotrophs and develops relatively late in gestation at 35-38 weeks of gestation, suggesting that SSTR 2 regulates TSH, LH and FSH whereas SSTR 5 regulates GH (292). The somatostatin receptors couple to various 2nd messenger systems such as adenylate cyclase, protein phosphatases, phospholipase C, cGMP dependent protein kinases, potassium, and calcium ion channels (293).


Ghrelin


Ghrelin is an orexigenic (appetite-stimulatory) peptide that was isolated from stomach and can stimulate the release of GH. It is derived from preproghrelin, a 117 amino acid peptide, by cleavage and n-octanoylation at the third residue to give a 28 amino acid active peptide (Figure 3 and Figure 6). Ghrelin is the endogenous ligand of the GH secretagogue receptor (GHS-R) 1a, another member of the seven-transmembrane receptor family G-protein coupled to the phospholipase C-phosphoinositide pathway (294,295). This variant of GHS-R has been shown to transduce the GH-releasing effect of synthetic growth hormone secretagogues (GHSs) as well as ghrelin, and also plays a role in neuroendocrine and appetite-stimulating activities centrally. Both ghrelin and GHS-R1a have corresponding widespread tissue expression (296). The other GHS-R variant, GHS-R1b, is a 289 amino acid G-protein coupled receptor with five transmembrane domains. The biological function of GHS-R1b is unclear. It has widespread expression throughout the body (296) but does not bind to ghrelin or other GHSs. However, it was shown to have counter-regulatory attenuating role on GHS-R1a signaling, possibly via the formation of heterodimers with GHS-R1a (297).


The majority of circulating ghrelin exists as the des-octanoylated (des-acyl) form: octanoylated ghrelin constitutes approximately 1.8% of the total amount of circulating ghrelin (298). Octanoylation appears to be essential for GH secretagogue activity, as des-acyl ghrelin is inactive for GH release (294). The enzyme that octanoylates ghrelin has recently been identified as ghrelin O-acyltransferase (GOAT) (299). GOAT is a porcupine-like enzyme belonging to the super-family of membrane-bound O-acyltransferase 4 (MBOAT4) and has widespread tissue expression corresponding to ghrelin (300). Historically, the earliest GH secretagogues discovered such as GHRP-1, GHRP-2, GHRP-6, and hexarelin were synthetic and derived from the enkephalins (301).


In the circulation, ghrelin appears to be bound to a subfraction of HDL particles containing clusterin and the A-esterase paraoxonase. It has been suggested that paraoxonase may be responsible for catalyzing the conversion of ghrelin to des-acyl ghrelin (302). However, inhibition of paraoxonase in human serum does not inhibit the de-acylation of ghrelin, and there is a negative correlation in these sera between the paraoxonase activity and ghrelin degradation. Instead, it is more likely that butyrylcholinesterase and other B-esterases are responsible for this activity (303).


Ghrelin is present in the arcuate nucleus of the hypothalamus and in the anterior pituitary (304). Immunofluorescence studies show that ghrelin is localized in somatotrophs, thyrotrophs, and lactotrophs, but not in corticotrophs or gonadotrophs, suggesting that ghrelin may be acting in a paracrine fashion in the anterior pituitary (305). It stimulates GH release in vitro directly from somatotrophs (294) and also when infused in vivo, although the latter action appears to require the participation of an intact GHRH system (284). Ghrelin stimulates GH secretion in a synergistic fashion when co-infused with GHRH (98). Both GHS and ghrelin have been shown to stimulate the release of GH in a dose-related pattern which is more marked in humans than in animals (306,307).


Besides its GH releasing activity, ghrelin has orexigenic activity (308,309), and stimulates insulin secretion (310), ACTH and prolactin release (311). Knocking out the preproghrelin gene in mice does not seem to affect their size, growth rate, food intake, body composition, and reproduction, indicating that proghrelin products (acyl- or desacyl-ghrelin, obestatin) are not dominantly and critically involved in mouse viability, appetite regulation, and fertility (312), although subtle reductions in the amplitude of secretory GH peaks can be detected in these knockout mice during their youth: these differences recede with aging (313). Ghrelin null mice show an increased utilization of fat as an energy substrate when placed on a high-fat diet, which may indicate that ghrelin is involved in modulating the use of metabolic substrates (314). GHS-R knockout mice have the same food intake and body composition as their wild-type littermates, although their body weight is decreased in comparison. However, treatment of GHS-R null mice with ghrelin does not stimulate GH release or food intake, confirming that these properties of ghrelin are mediated through the GHS-R (315).


Although it is clear that acyl-ghrelin activates GH secretion when injected into mice and men, the specific contribution of acyl-ghrelin to physiological pulsatile GH release is less clear. This question has been studied by knocking out GOAT: these mice showed an overall decline in the amount of GH release compared to age matched wild-type mice. The alteration of the GH release observed did not coincide with alterations in the pituitary GH content and GHRH, somatostatin, neuropeptide Y, or GHS-R mRNA expression. However, an increase in pulse number and greater irregularity of GH pulses was observed in these mice. Although other mutations that cause derangement of GH secretion have been previously associated with the ‘feminization’ of the expression of GH-dependent sexually divergent liver genes in male animals, there was no evidence of this in the Goat-/- mice. An increase in IGF-1 in the circulation, in the liver and also in the muscle was observed in the Goat-/- mice, either as a result of the disordered GH pulse pattern, or because there was a failure of the elevated IGF-1 levels to feedback on GH release. Overall, the data suggest that acyl-ghrelin has a regulatory role in the patterning of GH secretion, but the absence of acyl-ghrelin does not fatally knock out GH production (316).


To complicate things further, des-acyl ghrelin may have biological effects of its own. It has been shown to inhibit apoptosis and cell death in primary cardiomyocyte and endothelial cell cultures (317), to have varying effects on the proliferation of various prostate carcinoma cell lines (318), to inhibit isoproterenol-induced lipolysis in rat adipocyte cultures (319), and to induce hypotension and bradycardia when injected into the nucleus tractus solitarii of rats (320). More controversially, intracerebroventricular or peripherally administered des-acyl ghrelin causes a decrease in food consumption in fasted mice and inhibits gastric emptying. Des-acyl ghrelin overexpression in transgenic mice causes a decrease in body weight, food intake, fat pad mass weight, and decreased linear growth compared to normal littermates (321).  These observations were not replicated by other researchers, who found no effect of des-acyl ghrelin on feeding (322). The effects of des-acyl ghrelin appear not to be mediated via the type 1a or 1b GHS-R (317-319). The effects of peripherally administered des-acyl ghrelin on stomach motility can be inhibited by intracerebrovascular CRH receptor type 2 antagonists, suggesting that CRH receptor type 2 is involved, but there is no direct evidence that des-acyl ghrelin binds this receptor (323)


As noted above, the GH-stimulatory actions of ghrelin in vivo seem to require an intact GHRH system, as immunoneutralization of GHRH blocks ghrelin-induced GH secretion (284). The actions of GH secretagogues are blocked by hypothalamo-pituitary disconnection, which suggests that in vivo ghrelin’s stimulatory actions are indirect and mediated by GHRH (324). However, GHRH cannot be the sole mediator of ghrelin’s actions as the GH response to ghrelin is greater than that to GHRH (325), and, as noted above, ghrelin synergistically potentiates GH release by a maximal dose of GHRH (98). There is no evidence to suggest that ghrelin decreases somatostatinergic tone as immunoneutralization of somatostatin does not block ghrelin’s ability to release GH (284). There may therefore be another mediator, the so-called ‘U’ factor, released by ghrelin, which causes GH secretion (326).


LEAP2


Liver-expressed antimicrobial peptide 2 (LEAP2) has recently been discovered as an endogenous antagonist to ghrelin receptor (GHSR) (327). It is produced in the small intestines, mainly in the jejunum (327). Level of LEAP2 declines with fasting, as opposed to the level of ghrelin which goes up (327,328). In addition, the expression of LEAP2 is significantly upregulated following bariatric surgery, which is currently the most effective treatment for obesity (327).In vivo studies have shown that LEAP2 is capable of inhibiting the effects of ghrelin on GH secretion and food intake(327). LEAP2 is also shown to bind to GHSR in a non-competitive manner to ghrelin, thereby suggesting the presence of an allosteric site on the receptor (327).


Obestatin


As mentioned earlier, the effects of obestatin on pituitary hormones release remain controversial. Initial study has shown that intravenous or intracerebrovascular treatment of obestatin did not affect the release of growth hormone in male rats (104). However, a more recent study has shown that obestatin treatment inhibits both basal and ghrelin-induced GH release and expression, both in vitro and in vivo in non-human primates and in mice (107). This inhibitory effect is mediated by the adenylyl-cyclase and MAPK pathways. Obestatin treatment causes a reduction in Pit-1 and GHRH-R mRNA levels in the pituitary as well as a decrease in hypothalamic GHRH and ghrelin expression. Obestatin also reduces the expression of pituitary somatostatin receptors, namely SSTR subtypes 1 and 2 (107).  


OTHER INFLUENCES ON GROWTH HORMONE RELEASE


Glucocorticoids and Sex Hormones


Glucocorticoid treatment has a biphasic effect on GH secretion: an initial acute stimulation in 3 hours, followed by suppression within 12 hours (329,330). The latter is the clinically important effect, as excess endogenous and exogenous glucocorticoids are well known to suppress growth in children (331). The inhibitory effect of glucocorticoids on GH release is possibly mediated by increase in expression of somatostatin (332).


Sex hormones are also involved in regulating GH release particularly during puberty and also later in life. They affect GH release by acting at hypothalamic, pituitary, and peripheral levels. Both estrogen and testosterone increase GH secretion in humans by amplifying secretory burst mass and reduce the orderliness of GH secretion (333). Estrogen affects GH secretion mainly by interacting with the estrogen receptor-alpha expressed in the GHRH neurons and in the GH-secreting pituitary cells. The stimulatory effects of estrogen on GH secretion are possibly mediated by the release of GHRH and/or by enhancing the sensitivity to ghrelin released from the hypothalamus (334).  Estrogen increases the irregularity in pulsatility and lowering total and free IGF-1. Although estrogen increases the secretion of GH, it is also known to counter-regulate itself by reducing GH sensitivity in the liver and other peripheral organs, hence decreasing the secretion of IGF-1. The mechanism of this effect is via upregulating the SOCS-2 protein which in turn inhibits the JAK1-STAT5 signal transduction pathway of the GHR (335). GH deficient patients started on estrogen therapy therefore require a higher dose of GH replacement therapy to achieve a particular target IGF-1 level (336). The route of estrogen replacement is an important influence on GH requirement and those on oral estrogen are clearly more GH resistant than women using transdermal preparations (337,338). Testosterone, on the other hand, increases basal GH secretion and IGF-1 concentrations, thus relieving the negative feedback on GH secretion (333).


Leptin


Leptin is a 167 amino acid anorexigenic peptide primarily produced by white adipose tissue (339), regulates body fat mass (340) by feedback inhibition of the appetite centers of the hypothalamus (341). Leptin and its receptor have been detected both by RT-PCR and immunohistochemistry in surgical pituitary adenoma specimens and in normal pituitary tissue (342,343). However, pituitary adenoma cells in culture do not secrete GH in response to leptin treatment (343,344).


Leptin increases GH secretion in the short term, mainly via an increase in GHRH secretion and decrease in somatostatin expression. In the long term, it leads to a decrease in GH secretion, probably reducing GHRH sensitivity (345). In obese subjects, in whom which plasma leptin levels are persistently elevated, GH secretion and responsiveness are reduced in both animals and humans (346). However, if leptin-deficient obese subjects are studied in parallel with sex and BMI-matched leptin-replete obese subjects, it is found that their GH responses to GHRH and GHRP-6 are equally blunted suggesting that the leptin is not influential in mediating the hyposomatotropinism of obesity (347).


IGSF1


IGSF1 (X-linked immunoglobulin superfamily, member 1) gene encodes a transmembrane immunoglobulin superfamily glycoprotein that is highly expressed in the Rathke’s pouch, adult anterior pituitary cells, and the hypothalamus. Loss of function mutations in IGSF1 result in a variable spectrum of anterior pituitary dysfunction, including central hypothyroidism and hypoprolactinemia (348,349). More recently, effects of IGSF1 deficiency on somatroph function were characterized in adult males harboring hemizygous IGSF1 loss-of-function mutations and Igsf1-deficient mice (350). It was shown that IGFS1-deficient patients develop acromegaloid facial features accompanied with elevated IGF-1 concentrations and GH profile. Similar biochemical profiles were also observed in the male Igsf1-deficient mice. The exact mechanism of how IGSF1 regulates or influence GH secretion has not been elucidated.


Kisspeptin


Kisspeptin is a peptide hormone that binds to the G-protein coupled receptor GPR54. Although it was originally characterized as a ‘metastasis suppressor’ gene, its most well-characterized role is in stimulating the secretion of GnRH from GnRH neurons, in turn leading to gonadotrophin production from pituitary gonadotrophs. In addition to this, kisspeptin stimulates GH release from somatotrophs (351,352). These positive effects of kisspeptin are seen when given in vivo to cows or sheep (353), but so far have not been seen when given intravenously in small studies in human volunteers (354), although this may be because the GH stimulatory effects are only observed with central administration.


Catecholamines


In general, alpha-adrenergic pathways stimulate GH secretion, by stimulation of GHRH release and inhibition of somatostatinergic tone, while beta-adrenergic pathways inhibit secretion by increasing somatostatin release (355,356). The alpha2-adrenoceptor agonist clonidine can therefore be used as a provocative test of GH secretion (357,358) although clinical experience suggests that this is an unreliable stimulatory test for GH secretion in practice. L-dopa stimulates GH secretion; however, this action does not appear to be mediated via dopamine receptors as specific blockade of these receptors with pimozide does not alter the GH response to L-dopa (359). Instead, L-dopa’s effects appear to depend on conversion to noradrenaline or adrenaline, as alpha-adrenoceptor blockade with phentolamine disrupts the GH response to L-dopa (360).


Acetylcholine


Muscarinic pathways are known to stimulate GH secretion, probably by modulating somatostatinergic tone (361). Pyridostigmine, an indirect agonist which blocks acetylcholinesterase, increases the 24 hour secretion of GH by selectively increasing GH pulse mass (362). On the other hand, the muscarinic antagonist atropine is able to blunt the GH release associated with slow wave sleep (363) and that associated with GHRH administration (364). Passive immunization with anti-somatostatin antibodies abolishes the pyridostigmine induced rise in GH in rats, but not immunization with anti-GHRH antibodies, supporting the central role of somatostatinergic tone in mediating this response (365).


Dopamine


Continuous infusion of dopamine into normal healthy men leads to an increase in mean GH secretion comparable to that observed with GHRH. When given together, dopamine and GHRH have additive effects on GH secretion, and similarly the dopamine agonist bromocriptine augments the effects of GHRH (366).


Endogenous Opioids


Endorphins and enkephalins are able to stimulate GH secretion in man (367), and blockade with opiate antagonists can attenuate the GH response to exercise (368). Passive immunization against GHRH in rats inhibits GH release in response to an enkephalin analogue, which argues for stimulation of GHRH in response to these compounds (369). In keeping with this, a recent study demonstrated close juxtapositions between the enkephalinergic/ endorphinergic/ dynorphinergic axonal varicosities and GHRH-immunoreactive perikarya in the human hypothalamus (370). Morphologically, the majority of contacts between the GHRH perikarya and endogenous opiates were enkephalinergic while only few dynorphin- and endorphin-GHRH interactions were detected. Enkephalinergic-GHRH interactions and fibers are known to be densely populated in the infundibular nucleus and anterior periventricular area, thereby suggesting that enkephalin regulates not only the activity of GHRH- but also somatostatin-synthesizing neurons (371). The balance between the activation of GHRH and somatostatin neuronal systems may determine if enkephalin stimulates or inhibits or has no effect on pituitary GH secretion. Unfortunately, the study was unable to detect the presence of synapses between the enkephalinergic/ endorphinergic/ dynorphinergic and GHRH neurons because the immunocytochemistry was carried out under light microscope. Electron microscopy was not applied in the study due to the long post-mortem period. Nevertheless, these findings demonstrated the presence of intimate associations between the endogenous opioid and GHRH systems in the human hypothalamus, as well as indicated the significant differences between the regulatory roles of endogenous opioids on growth in human.


Stimulation of GHRH by endorphins and enkephalins cannot be the only mechanism increasing GH release, however, as the met-enkephalin analogue DAMME is able to increase GH release over and above the levels released during maximal stimulation by a GHRH analogue (372). It is possible that the actions of endogenous opioids occur via an interaction with the GHS-R, as the original GH secretagogues characterized were derived from the enkephalins (301).


Endocannabinoids


As with ACTH/cortisol, the endocannabinoids may also influence the release of GH. Somatotroph cells bear the CB1 receptor (89). The administration of THC for 14 days suppresses GH secretion in response to hypoglycemia in healthy human subjects (92). Oddly enough, THC and anandamide appear to have opposing effects on GH levels in ovariectomized rats: THC increases and anandamide decreases GH secretion in this context (373). However, the treatment of anterior pituitary cells in primary culture with THC does not seem to influence the release of GH and prolactin to GHRH and TRH, suggesting that the effects of THC are mediated via the hypothalamus and not directly on the anterior pituitary (374), perhaps by stimulating somatostatin release (375).


Ghrelin and the Endocannabinoid System


Ghrelin and the endocannabinoid system interact in a bidirectional fashion. The intraperitoneal administration of cannabinoids results in increased plasma ghrelin levels and stomach ghrelin expression in rats (376) and CB1 receptor antagonism with rimonabant reduces ghrelin levels (377), suggesting that the orexigenic effects of cannabinoids may also be connected to an increase in ghrelin secretion from the gastric X/A-like cells. The effects of ghrelin on appetite were also abolished in CB1 knockout or in the presence of the CB1 antagonist rimonabant (378-380). In addition, the effects of cannabinoids are also abolished in the absence of the ghrelin receptor GHS-R1a (381). These findings confirm that both ghrelin and cannabinoid signaling pathways have to intact to mediate the effects of these two systems on appetite. Interestingly, in vivo and in vitro GH release is intact in response to ghrelin in CB1-knockout animals (379). These findings are intriguing because they suggest that the effects of ghrelin on GH release are somehow modulated differently at the receptor-binding stage of the pathway compared to its orexigenic and metabolic effects. Moreover, it has also been proposed that the bidirectional relationship of the ghrelin and endocannabinoid system might be potentially mediated by the interaction (e.g. heterodimerization) between GHS-R1a and CB1 receptors (381). However, further molecular and functional studies are needed to elucidate the exact mechanism of interaction between these two systems.


Other Neuropeptides and Factors Affecting GH Secretion


Many neuropeptides, including the ones in the following paragraphs, have been shown to influence GH secretion in various contexts. For the most part, however, their physiological role in man is not well characterized.


Infusion of galanin, a 29 amino acid peptide originally isolated from the small intestine, causes stimulation of GH secretion when infused alone and also enhances GHRH-stimulated GH secretion (382).


Calcitonin, the 32 amino acid peptide secreted from the C cells of the thyroid gland, appears to inhibit the stimulated secretion of GH by GHRH, arginine, and insulin-induced hypoglycemia (383,384).


Neuropeptide Y (NPY) is an orexigenic peptide that has been shown to inhibit GH secretion in rats (385-387), from human somatotroph tumor cells in culture (388), and from rat hypothalamic explants (389). When infused into patients with prolactin-secreting pituitary adenomas, 9 out of 15 patients showed a paradoxical rise in GH levels (390). However, when infused into healthy young men overnight, NPY did not have any significant effect on GH secretion (391).


Pituitary adenylate cyclase-activating polypeptide (PACAP) is a hypothalamic C-terminally amidated 38 residue peptide hormone originally characterized on the basis of its ability to stimulate cAMP accumulation from anterior pituitary cells (392). In rats, PACAP stimulates GH release from pituitary cell lines and also when infused in vivo (393-395). When infused into human volunteers, however, GH levels do not appear to be affected (396).


Klotho, a transmembrane protein that is classically known for its ‘co-receptor’ activity with fibroblast growth hormone receptors, has recently been characterized as a possible secretagogue for GH. Although it is usually attached to membranes, the extracellular region can be shed from the cell surface, and there is some evidence for endocrine activity. Klotho knockout mice exhibit reduced growth in the context of a ‘early aging’ phenotype, and histopathological examination of their somatotrophs demonstrate reduced numbers of secretory granules. Klotho treatment of somatotrophs in vitro has been demonstrated to increase GH secretion, but at present its physiological role is yet to be fully elucidated (397).


GPR101, an orphan GPCR that is constitutively coupled to Gs, has been shown to induce GH secretion through the activation of protein kinase A and protein kinase C in the Gs and Gq/11 pathways (398). Transgenic mice with overexpression of pituitary-specific Gpr101 develops gigantism phenotype and has hypersecretion of GH, in the absence of pituitary hyperplasia or tumorigenesis, thereby indicating that the role of Gpr101 in the pituitary enhances secretion rather than enhancing proliferation (398). In humans, duplication of the GPR101 gene and thus, overexpression of GPR101, leads to a severe form of pituitary gigantism known as X-linked acrogigantism (X-LAG) (399-402). X-LAG is characterized by infant-onset somatotroph tumors or hyperplasia with high levels of GH and in most cases prolactin as well.


FEEDBACK LOOPS OF GH SECRETION


Multiple negative feedback loops exist to autoregulate the GH axis (Figure 7).


  • Somatostatin auto-inhibits its own secretion (403).
  • GHRH auto-inhibits its own secretion by stimulating somatostatin release (404).
  • GH auto-regulates its own secretion in short term by stimulating somatostatin release and inhibiting GHRH-stimulated GH release (405-407). There is also a negative feedback on stomach ghrelin release by GH (408). More recently, it is demonstrated that in long-term feedback situation, the inhibition of GH release is most likely due to feedback inhibition by IGF-1 (409).
  • IGF-1, whose production is stimulated by GH, inhibits GH release in a biphasic manner: (1) by stimulating hypothalamic somatostatin release early, and (2) by inhibiting GH release after 24 hours, probably by inhibiting GH mRNA transcription (410,411). Interestingly, IGF-1 infusion suppresses GHRH-induced GH release in males but not in females, suggesting a sexually dimorphic effect (409).

Figure 7. Regulation of GH. Green arrows denote stimulatory influences, red arrows denote inhibitory influences.

PHYSIOLOGY OF GH SECRETION


Pulsatility of GH Secretion


The secretory pattern of GH was first elucidated in rats (412). Circulating GH levels are pulsatile, with high peaks separated by valleys where the GH is undetectable by conventional RIAs or IRMAs (Figure 8). The recent development of sensitive chemiluminescent assays for GH with high frequency sampling and deconvolution analysis has allowed the detailed study of GH secretion. This shows that there are detectable levels of basal GH secretion in the ‘valleys’ (413). On average, there are 10 pulses of GH secretion per day lasting a mean of 96.4 mins with 128 mins between each pulse (414). The diurnal secretory pattern of GH in human is fully developed after puberty, demonstrating a major peak at late night/early morning which is associated with NREM (slow wave)-sleep, and a number of peaks during the light hours of the day, but with quite large individual difference (415).

Figure 8. Pulsatility of circulating GH levels in adult men and women.

There is a dynamic interplay of pulsatile GHRH and somatostatin secretion:

  • Via crosstalk: GHRH neurons receive inhibitory inputs from somatostatin neurons, whilst somatostatin neurons receive direct stimulatory inputs from GHRH neurons
  • Via synergistic actions on somatotrophs: Pre-exposure to somatostatin enhances GHRH-stimulated secretion of GH (416).


Further studies in animals have revealed that somatotropin releasing inhibiting factor regulates the magnitude of the troughs of GH as well as the amplitude of the peaks, whereas GHRH functions as the main regulator of the pulsatile pattern (409,417,418). Interestingly, continuous GHRH administration in human volunteers does not affect the pulsatility of GH secretion (419). Moreover, patients with an inactivating mutation of the GHRH receptor continue to show pulsatile GH secretion, suggesting that somatostatin pulsatility is sufficient to determine GH pulsatility (420). These observations suggest that the mechanisms involved in human may differ from the animal models.


GH and Sexual Dimorphism


The technical developments in sensitive detection of GH and deconvolution analysis referred to above have elucidated differences in secretion between men and women. Women have higher mean GH levels throughout the day than men due to higher incremental and maximal GH peak amplitudes (Figure 8), but show no significant difference in GH half-life, interpulse times, or pulse frequency (421). The higher basal GH levels may underlie the higher nadir GH levels seen in normal women after GH suppression with oral glucose (422). Recent evidence suggests that there are sexual differences in the expression of somatostatin and somatostatin receptor subtypes in the rat pituitary, which would clearly cause differences in the physiological regulation of GH release (423).


Differences in GH secretion patterns between the sexes, with male ‘pulsatile’ secretion versus female ‘continuous’ secretion, can cause different patterns of gene activation in target tissues, e.g. induction of linear growth patterns, gain of body weight, induction of liver enzymes and STAT 5b signaling pathway activity (424).


GH and Aging


GH and IGF-1 levels are known to decline continuously with age and to very low levels in those aged ≥60 years (425). This phenomenon, known as the ‘somatopause’, is also seen in other mammals and has led to the speculation that GH treatment can be a potent anti-aging therapy (426). Conversely, decreased GH/IGF-1 signaling has also been shown to extend longevity in a wide variety of species such as worms, fruit flies, mice, and yeast (427), thus raising the question of whether decreased activity of the GH/IGF-1 axis might be beneficial for human longevity. Somatopause might therefore be nature’s way of sustaining the aging individual (428).


It is also suggested that the anorexia associated with aging is due to the decline in the level of acylated ghrelin in older adults. This is supported by a recent study that showed an age-dependent decline in both circulating acyl-ghrelin and growth hormone levels in older adults (aged 62-74 years, BMI range 20.9-29 kg/m2) compared to young adults (aged 18-28 years, BMI range 20.6-26.2 kg/m2) (429). By estimating the correlations between amplitudes of individual GH secretory events and the average acyl-ghrelin concentration in the 60-minute interval preceding each GH burst, the ghrelin/GH association was more than 3-fold lower in the older group compared with the young adults, thus suggesting that with normal aging, endogenous acyl-ghrelin levels are less tightly linked to GH regulation. In addition, ghrelin mimetics have also been shown to be a potential treatment for the musculoskeletal impairment associated with aging (430).


Sleep


The secretion rate of GH shows a circadian pattern, with peak rates measured during sleep. These are approximately triple the daytime rate (431). GH secretion is especially associated with slow wave sleep (SWS – stages 3 and 4) (432). Deep sleep is also shown to enhance the activity of GH axis and has an inhibitory effect on cortisol levels (433). The decline in GH secretion during aging is paralleled by the decreasing proportion of time spent in SWS, although it is unclear which is cause and which is effect (434). In early data from a clinical trial, GH deficient patients have increased sleep fragmentation and decreased total sleep time, and it is conjectured that such alterations in sleep patterns may be responsible for excessive daytime sleepiness in such patients (435).


Sleep deprivation, in the laboratory or due to travel causing ‘jet lag’, causes two alterations in the GH secretory pattern: the magnitude of secretory spikes is augmented: the return to pre-travel levels takes at least 11 days and is slower to recover after westward travel. The major pulse of GH secretion occurring in early sleep is also shifted to late sleep (436). It is also noted that the GH pulses are more equally distributed throughout 24 hours of sleep deprivation compared to a night-time sleep condition, with large individual pulses occurring during the day (437).


Administration of a GHRH antagonist reduces nocturnal GH pulsatility by 75% (438). Normal subjects remain sensitive to GHRH boluses during the night, however, and the lowering of somatostatinergic tone during the night may be responsible for the increase in GH secretion rate (439). Recent work, however, has also demonstrated that ghrelin levels rise through the night in lean men (440). It is likely, therefore, that a combination of increased GHRH, decreased somatostatin and increased ghrelin levels underlie the circadian variation in GH secretion.


Administration of GHRH augments increased nocturnal GH release and promotes SWS. Somatostatin does not change nocturnal GH release, and does not affect the proportion of SWS, but may increase rapid eye movement (REM) sleep density (441). Ghrelin has been shown to promote slow wave sleep at the expense of REM sleep, accompanied by an increase in GH and prolactin release when administered exogenously (442).


Exercise


Exercise is a powerful stimulus to secretion of GH (443), which occurs by about 15 min from the start of exercise (444). The kinetics may vary between subjects, an effect which is likely to be related to differences in age, sex and body composition (445). Ten minutes of high-intensity exercise is required to stimulate a significant rise in GH (446). Anaerobic exercise causes a larger release of GH than aerobic exercise of the same duration (447).


Acetylcholine, adrenaline, noradrenaline, and endogenous opioids have been implicated in exercise-induced GH release (361). However, ghrelin levels do not rise in acute exercise, indicating that ghrelin may not have a role to play in exercise-induced GH release (448).


Recent evidence also indicates that exercise enhances SWS and thus leads to increase in GH release as well as brain-derived neutrotrophic factors (BDNF) and IGF-1 gene expression and protein levels (449,450). This is thought to improve learning and memory performance, especially in the elderly (449,450). Sleep-deprived individuals seem to have a larger exercise-induced GH response, although the reason behind this is still unclear (451).


Hypoglycemia


Insulin-induced hypoglycemia is another powerful stimulus to GH secretion (Figure 9) (452,453). The peak GH levels achieved during insulin stress testing correlate well with those achieved during slow wave sleep (454). The hypoglycemic response is mediated by alpha2-adrenergic receptors (455) to cause inhibition of somatostatin release (361), although other evidence argues for a role of stimulated GHRH release, as a GHRH receptor antagonist significantly suppressed hypoglycemic GH release (456). Ghrelin is unlikely to be involved in the GH response to insulin-induced hypoglycemia as circulating ghrelin levels are suppressed by the insulin bolus (457).

Figure 9. Normal response of GH to insulin-induced hypoglycemia (≤2.2 mmol/l). Peak GH secreted is ≥6.66 µg/L.

Other Stressors


Other physical stresses such as hypovolemic shock (458) and elective surgery (459) cause increased GH release; alpha-adrenergic dependent mechanisms are thought to underly this, as blockade with phentolamine inhibits the response (459).


Hyperglycemia


In contrast to hypoglycemia, ingestion of an oral glucose load causes an initial suppression of plasma GH levels for 1-3 hours (Figure 10), followed by a rise in GH concentrations at 3-5 hours (460). The initial suppression could be mediated by increased somatostatin release as pyridostigmine, a postulated inhibitor of somatostatin release, blocks this suppression (461). Circulating ghrelin levels also fall following ingestion of glucose (462). The GH response to ghrelin and GHRH infusions is blunted by oral glucose, an effect that is probably mediated by somatostatin (463). The later rise in GH levels is postulated to be due to a decline in somatostatinergic tone plus a reciprocal increase in GHRH, leading to a ‘rebound’ rise (361).

Figure 10. GH response to 75g oral glucose in 8 non-acromegalic, non-diabetic women, given at time 0. Error bars denote SD. Note the high variability of the baseline GH level due to the pulsatile nature of GH secretion. GH levels fall to <0.4 µg/L at 120 minutes.

In type I diabetes mellitus, GH dynamics are disordered, with elevated 24 hour release of GH (464). Deconvolution analysis shows that GH pulse frequencies and maximal amplitudes are increased. The latter is accounted for by higher ‘valley’ levels (465). Better glycemic control appears to normalize these disordered dynamics (466). The pathophysiological mechanism appears to involve reduced somatostatinergic tone (361).


There is conflicting evidence for increased, decreased, or normal GH dynamics in type II diabetics. It is likely that this reflects two factors acting in opposite directions: (1) the confounding factor of obesity in these patients, which leads to hyposecretion of GH; and (2) the hyperglycemia, which leads to hypersecretion (361).


Dietary Restriction and Fasting


Dietary restriction and fasting lead to a significant increase in pituitary secretion of GH (467). A 5-day fast in normal healthy men resulted in a significant increase in the pulse frequency as well as pulse amplitude of GH release. This was coupled with a decrease in expression and secretion of IGF-1, which could explain the lack of feedback inhibitory effect on pituitary GH secretion in the fasting state.


Obesity and Malnutrition


Chronic malnutrition states such as marasmus and kwashiorkor cause a rise in GH levels (468). On the other hand, obesity is known to be associated with lower GH levels, partially due to decreased levels of GH binding protein and partially due to decreased frequency of GH pulses (469). Visceral adiposity, as assessed by CT scanning and dual energy X-ray absorptiometry, seems to be especially important, and correlates negatively with mean 24 hour GH concentrations (470). The mechanism of decreased GH release in obesity has been ascribed to increased somatostatinergic tone, as pyridostigmine is able to reverse this, to some extent, by suppressing somatostatin release (471-473). However, this cannot be the full explanation, as pyridostigmine is not able to fully reverse the hyposomatotropinism of obesity, even when combined with GHRH and the GH secretagogue GHRP-6 (474).


The fasting induced elevation in secretion of GH is blunted in obesity (475,476). Nevertheless, fasting in obese volunteers still induces an appreciable increase in GH secretion, with accompanying increase in lipolysis and insulin resistance. Co-administration of pegvisomant (a GH receptor antagonist) abrogated this phenomenon, suggesting that the elevation in GH during fasting is responsible for the insulin resistance induced by fasting (477).


Although leptin has been shown to be influential on GH secretion in rats (478), this may not be so in humans. Leptin-deficient subjects have been compared with obese non-deficient control subjects in their GH responses when stimulated with GHRH plus GHRP-6. Both these groups have decreased GH peaks compared to non-obese control subjects, as expected. There was no significant difference in mean GH peaks between leptin-deficient and leptin-replete controls, suggesting that leptin does not play a significant role in the GH suppression seen in obese humans, and that the decreased GH secretion of obesity is mediated via other mechanisms (347).


Another candidate for the mechanism linking obesity to GH secretion is ghrelin. Its levels correlate negatively with body fat content (479). A comparative study between 5 lean and 5 obese men employed rapid sampling and pulse analysis of ghrelin levels over 24 hours. Ghrelin levels increased at night in the lean controls but did not in the obese group (440). Weight loss caused circulating ghrelin levels to rise in two studies (480,481). Contradicting this, however, Lindeman and colleagues found that ghrelin levels paradoxically correlated positively with visceral fat area, in contrast with 24-hour GH secretion, which correlated negatively. Moreover, in their study, weight loss increased GH secretion but did not affect ghrelin levels (482). More recently, a study comparing subjects with central obesity only with subjects suffering from the metabolic syndrome showed changes in ghrelin levels not to be associated with central obesity per se but with other components of the metabolic syndrome (483). The response of GH secretion to exogenous ghrelin is significantly blunted in obese patients and this response is restored early on after Roux-en-Y gastric bypass (prior to any major weight loss), suggesting that there is an intrinsic resistance to ghrelin in obesity which is reversed with gastric bypass, and which is not linked to weight loss (484). Therefore, there does not appear to be a simple relationship where obesity-induced reduction in ghrelin levels leads to the reduced secretion of GH.


Amino Acids


GH release is stimulated by a protein meal (485). L-arginine, an essential amino acid, can be used as a provocative test for GH secretion (486). Evidence that L-arginine acts through inhibition of somatostatin release includes the observation that L-arginine can still enhance the GH response to GHRH despite the use of maximal doses of GHRH (487). However, a specific GHRH antagonist blunted the GH response to L-arginine, an observation that supports the notion that L-arginine also acts through stimulation of GHRH secretion (456). Unlike oral glucose, L-arginine does not modify the GH response to ghrelin infusion (463).

REFERENCES

1.       Marshall J. Control of Pituitary Hormone Secretion – Role of Pulsatility. In: Besser G, Thorner M, eds. Comprehensive Clinical Endocrinology. Edinburgh, UK: Mosby; 2002:19-34.

2.       Doniach I. Histopathology of the pituitary. Clin Endocrinol Metab. 1985;14(4):765-789.

3.       McKusick V, Phillips JI, Hamosh A, Tiller G, O'Neill M. Pro-opiomelanocortin. In: McKusick V, ed. Online Mendelian Inheritance in Man. Baltimore, MD, USA: Johns Hopkins University; 2007: http://www.ncbi.nlm.nih.gov:80/entrez/dispomim.cgi?id=176830. Accessed 20 Jan 2007

4.       Drouin J. 60 YEARS OF POMC: Transcriptional and epigenetic regulation of POMC gene expression. J Mol Endocrinol. 2016;56(4):T99-T112.

5.       Drouin J, Chamberland M, Charron J, Jeannotte L, Nemer M. Structure of the rat pro-opiomelanocortin (POMC) gene. FEBS Lett. 1985;193(1):54-58.

6.       Therrien M, Drouin J. Pituitary pro-opiomelanocortin gene expression requires synergistic interactions of several regulatory elements. Mol Cell Biol. 1991;11(7):3492-3503.

7.       Therrien M, Drouin J. Cell-specific helix-loop-helix factor required for pituitary expression of the pro-opiomelanocortin gene. Mol Cell Biol. 1993;13(4):2342-2353.

8.       Poulin G, Turgeon B, Drouin J. NeuroD1/beta2 contributes to cell-specific transcription of the proopiomelanocortin gene. Mol Cell Biol. 1997;17(11):6673-6682.

9.       Lamonerie T, Tremblay JJ, Lanctot C, Therrien M, Gauthier Y, Drouin J. Ptx1, a bicoid-related homeo box transcription factor involved in transcription of the pro-opiomelanocortin gene. Genes Dev. 1996;10(10):1284-1295.

10.     Lamolet B, Pulichino AM, Lamonerie T, Gauthier Y, Brue T, Enjalbert A, Drouin J. A pituitary cell-restricted T box factor, Tpit, activates POMC transcription in cooperation with Pitx homeoproteins. Cell. 2001;104(6):849-859.

11.     Langlais D, Couture C, Sylvain-Drolet G, Drouin J. A Pituitary-Specific Enhancer of the POMC Gene with Preferential Activity in Corticotrope Cells. Mol Endocrinol. 2011;25(2):348-359.

12.     Murakami I, Takeuchi S, Kudo T, Sutou S, Takahashi S. Corticotropin-releasing hormone or dexamethasone regulates rat proopiomelanocortin transcription through Tpit/Pitx-responsive element in its promoter. J Endocrinol. 2007;193(2):279-290.

13.     Budry L, Balsalobre A, Gauthier Y, Khetchoumian K, L'Honore A, Vallette S, Brue T, Figarella-Branger D, Meij B, Drouin J. The selector gene Pax7 dictates alternate pituitary cell fates through its pioneer action on chromatin remodeling. Genes Dev. 2012;26(20):2299-2310.

14.     Ezzat S, Mader R, Yu S, Ning T, Poussier P, Asa SL. Ikaros integrates endocrine and immune system development. J Clin Invest. 2005;115(4):1021-1029.

15.     Aguilera G, Harwood JP, Wilson JX, Morell J, Brown JH, Catt KJ. Mechanisms of action of corticotropin-releasing factor and other regulators of corticotropin release in rat pituitary cells. J Biol Chem. 1983;258(13):8039-8045.

16.     Jin WD, Boutillier AL, Glucksman MJ, Salton SR, Loeffler JP, Roberts JL. Characterization of a corticotropin-releasing hormone-responsive element in the rat proopiomelanocortin gene promoter and molecular cloning of its binding protein. Mol Endocrinol. 1994;8(10):1377-1388.

17.     Autelitano DJ, Cohen DR. CRF stimulates expression of multiple fos and jun related genes in the AtT-20 corticotroph cell. Mol Cell Endocrinol. 1996;119(1):25-35.

18.     Loeffler JP, Kley N, Pittius CW, Hollt V. Calcium ion and cyclic adenosine 3',5'-monophosphate regulate proopiomelanocortin messenger ribonucleic acid levels in rat intermediate and anterior pituitary lobes. Endocrinology. 1986;119(6):2840-2847.

19.     Antoni FA. Interactions between intracellular free Ca2+ and cyclic AMP in neuroendocrine cells. Cell Calcium. 2012;51(3-4):260-266.

20.     Jenks BG. Regulation of proopiomelanocortin gene expression: an overview of the signaling cascades, transcription factors, and responsive elements involved. Ann N Y Acad Sci. 2009;1163:17-30.

21.     Martens C, Bilodeau S, Maira M, Gauthier Y, Drouin J. Protein-protein interactions and transcriptional antagonism between the subfamily of NGFI-B/Nur77 orphan nuclear receptors and glucocorticoid receptor. Mol Endocrinol. 2005;19(4):885-897.

22.     Boutillier AL, Monnier D, Koch B, Loeffler JP. Pituitary adenyl cyclase-activating peptide: a hypophysiotropic factor that stimulates proopiomelanocortin gene transcription, and proopiomelanocortin-derived peptide secretion in corticotropic cells. Neuroendocrinology. 1994;60(5):493-502.

23.     Karalis KP, Venihaki M, Zhao J, van Vlerken LE, Chandras C. NF-kappaB participates in the corticotropin-releasing, hormone-induced regulation of the pituitary proopiomelanocortin gene. J Biol Chem. 2004;279(12):10837-10840.

24.     Asaba K, Iwasaki Y, Asai M, Yoshida M, Nigawara T, Kambayashi M, Hashimoto K. High glucose activates pituitary proopiomelanocortin gene expression: possible role of free radical-sensitive transcription factors. Diabetes Metab Res Rev. 2007;23(4):317-323.

25.     Suda T, Tozawa F, Yamada M, Ushiyama T, Tomori N, Sumitomo T, Nakagami Y, Demura H, Shizume K. Effects of corticotropin-releasing hormone and dexamethasone on proopiomelanocortin messenger RNA level in human corticotroph adenoma cells in vitro. J Clin Invest. 1988;82(1):110-114.

26.     Wardlaw SL, McCarthy KC, Conwell IM. Glucocorticoid regulation of hypothalamic proopiomelanocortin. Neuroendocrinology. 1998;67(1):51-57.

27.     Drouin J, Charron J, Gagner JP, Jeannotte L, Nemer M, Plante RK, Wrange O. Pro-opiomelanocortin gene: a model for negative regulation of transcription by glucocorticoids. J Cell Biochem. 1987;35(4):293-304.

28.     Drouin J, Sun YL, Chamberland M, Gauthier Y, De Lean A, Nemer M, Schmidt TJ. Novel glucocorticoid receptor complex with DNA element of the hormone-repressed POMC gene. Embo J. 1993;12(1):145-156.

29.     Autelitano DJ, Lundblad JR, Blum M, Roberts JL. Hormonal regulation of POMC gene expression. Annu Rev Physiol. 1989;51:715-726.

30.     Pozzoli G, Bilezikjian LM, Perrin MH, Blount AL, Vale WW. Corticotropin-releasing factor (CRF) and glucocorticoids modulate the expression of type 1 CRF receptor messenger ribonucleic acid in rat anterior pituitary cell cultures. Endocrinology. 1996;137(1):65-71.

31.     Parvin R, Saito-Hakoda A, Shimada H, Shimizu K, Noro E, Iwasaki Y, Fujiwara K, Yokoyama A, Sugawara A. Role of NeuroD1 on the negative regulation of Pomc expression by glucocorticoid. PLoS One. 2017;12(4):e0175435.

32.     Paez-Pereda M, Kovalovsky D, Hopfner U, Theodoropoulou M, Pagotto U, Uhl E, Losa M, Stalla J, Grubler Y, Missale C, Arzt E, Stalla GK. Retinoic acid prevents experimental Cushing syndrome. J Clin Invest. 2001;108(8):1123-1131.

33.     Frederic F, Chianale C, Oliver C, Mariani J. Enhanced endocrine response to novel environment stress and lack of corticosterone circadian rhythm in staggerer (Rora sg/sg) mutant mice. J Neurosci Res. 2006;83(8):1525-1532.

34.     Martin NM, Small CJ, Sajedi A, Liao XH, Weiss RE, Gardiner JV, Ghatei MA, Bloom SR. Abnormalities of the hypothalamo-pituitary-thyroid axis in the pro-opiomelanocortin deficient mouse. Regul Pept. 2004;122(3):169-172.

35.     Ray DW, Ren SG, Melmed S. Leukemia inhibitory factor (LIF) stimulates proopiomelanocortin (POMC) expression in a corticotroph cell line. Role of STAT pathway. J Clin Invest. 1996;97(8):1852-1859.

36.     Ray DW, Ren SG, Melmed S. Leukemia inhibitory factor regulates proopiomelanocortin transcription. Ann N Y Acad Sci. 1998;840:162-173.

37.     Mynard V, Guignat L, Devin-Leclerc J, Bertagna X, Catelli MG. Different mechanisms for leukemia inhibitory factor-dependent activation of two proopiomelanocortin promoter regions. Endocrinology. 2002;143(10):3916-3924.

38.     Bousquet C, Zatelli MC, Melmed S. Direct regulation of pituitary proopiomelanocortin by STAT3 provides a novel mechanism for immuno-neuroendocrine interfacing. J Clin Invest. 2000;106(11):1417-1425.

39.     Iwasaki Y, Taguchi T, Nishiyama M, Asai M, Yoshida M, Kambayashi M, Takao T, Hashimoto K. Lipopolysaccharide stimulates proopiomelanocortin gene expression in AtT20 corticotroph cells. Endocr J. 2008;55(2):285-290.

40.     Smith ZD, Meissner A. DNA methylation: roles in mammalian development. Nat Rev Genet. 2013;14(3):204-220.

41.     Newell-Price J, King P, Clark AJ. The CpG island promoter of the human proopiomelanocortin gene is methylated in nonexpressing normal tissue and tumors and represses expression. Mol Endocrinol. 2001;15(2):338-348.

42.     Benjannet S, Rondeau N, Day R, Chretien M, Seidah NG. PC1 and PC2 are proprotein convertases capable of cleaving proopiomelanocortin at distinct pairs of basic residues. Proc Natl Acad Sci U S A. 1991;88(9):3564-3568.

43.     Chretien M, Seidah NG. Chemistry and biosynthesis of pro-opiomelanocortin. ACTH, MSH's, endorphins and their related peptides. Mol Cell Biochem. 1981;34(2):101-127.

44.     Seidah NG, Chretien M. Complete amino acid sequence of a human pituitary glycopeptide: an important maturation product of pro-opiomelanocortin. Proc Natl Acad Sci U S A. 1981;78(7):4236-4240.

45.     Seidah NG, Rochemont J, Hamelin J, Benjannet S, Chretien M. The missing fragment of the pro-sequence of human pro-opiomelanocortin: sequence and evidence for C-terminal amidation. Biochem Biophys Res Commun. 1981;102(2):710-716.

46.     Eipper BA, Mains RE. Structure and biosynthesis of pro-adrenocorticotropin/endorphin and related peptides. Endocr Rev. 1980;1(1):1-27.

47.     Bradbury AF, Smyth DG, Snell CR. Prohormones of beta-melanotropin (beta-melanocyte-stimulating hormone, beta-MSH) and corticotropin (adrenocorticotropic hormone, ACTH): structure and activation. Ciba Found Symp. 1976;41:61-75.

48.     Barnea A, Cho G. Acetylation of adrenocorticotropin and beta-endorphin by hypothalamic and pituitary acetyltransferases. Neuroendocrinology. 1983;37(6):434-439.

49.     Vale W, Spiess J, Rivier C, Rivier J. Characterization of a 41-residue ovine hypothalamic peptide that stimulates secretion of corticotropin and beta-endorphin. Science. 1981;213(4514):1394-1397.

50.     Shibahara S, Morimoto Y, Furutani Y, Notake M, Takahashi H, Shimizu S, Horikawa S, Numa S. Isolation and sequence analysis of the human corticotropin-releasing factor precursor gene. Embo J. 1983;2(5):775-779.

51.     Sawchenko PE, Swanson LW. Localization, colocalization, and plasticity of corticotropin-releasing factor immunoreactivity in rat brain. Fed Proc. 1985;44(1 Pt 2):221-227.

52.     Deussing JM, Chen A. The Corticotropin-Releasing Factor Family: Physiology of the Stress Response. Physiol Rev. 2018;98(4):2225-2286.

53.     Perrin M, Donaldson C, Chen R, Blount A, Berggren T, Bilezikjian L, Sawchenko P, Vale W. Identification of a second corticotropin-releasing factor receptor gene and characterization of a cDNA expressed in heart. Proc Natl Acad Sci U S A. 1995;92(7):2969-2973.

54.     Chen R, Lewis KA, Perrin MH, Vale WW. Expression cloning of a human corticotropin-releasing-factor receptor. Proc Natl Acad Sci U S A. 1993;90(19):8967-8971.

55.     Takefuji M, Murohara T. Corticotropin-Releasing Hormone Family and Their Receptors in the Cardiovascular System. Circ J. 2019;83(2):261-266.

56.     Bale TL, Vale WW. CRF and CRF receptors: role in stress responsivity and other behaviors. Annu Rev Pharmacol Toxicol. 2004;44:525-557.

57.     DeBold CR, DeCherney GS, Jackson RV, Sheldon WR, Alexander AN, Island DP, Rivier J, Vale W, Orth DN. Effect of synthetic ovine corticotropin-releasing factor: prolonged duration of action and biphasic response of plasma adrenocorticotropin and cortisol. J Clin Endocrinol Metab. 1983;57(2):294-298.

58.     Tse A, Lee AK, Tse FW. Ca2+ signaling and exocytosis in pituitary corticotropes. Cell Calcium. 2012;51(3-4):253-259.

59.     Muglia L, Jacobson L, Dikkes P, Majzoub JA. Corticotropin-releasing hormone deficiency reveals major fetal but not adult glucocorticoid need. Nature. 1995;373(6513):427-432.

60.     Timpl P, Spanagel R, Sillaber I, Kresse A, Reul JM, Stalla GK, Blanquet V, Steckler T, Holsboer F, Wurst W. Impaired stress response and reduced anxiety in mice lacking a functional corticotropin-releasing hormone receptor 1. Nat Genet. 1998;19(2):162-166.

61.     Wang X, Su H, Copenhagen LD, Vaishnav S, Pieri F, Shope CD, Brownell WE, De Biasi M, Paylor R, Bradley A. Urocortin-deficient mice display normal stress-induced anxiety behavior and autonomic control but an impaired acoustic startle response. Mol Cell Biol. 2002;22(18):6605-6610.

62.     Neufeld-Cohen A, Tsoory MM, Evans AK, Getselter D, Gil S, Lowry CA, Vale WW, Chen A. A triple urocortin knockout mouse model reveals an essential role for urocortins in stress recovery. Proc Natl Acad Sci U S A. 2010;107(44):19020-19025.

63.     Chen A, Zorrilla E, Smith S, Rousso D, Levy C, Vaughan J, Donaldson C, Roberts A, Lee KF, Vale W. Urocortin 2-deficient mice exhibit gender-specific alterations in circadian hypothalamus-pituitary-adrenal axis and depressive-like behavior. J Neurosci. 2006;26(20):5500-5510.

64.     Sugimoto T, Saito M, Mochizuki S, Watanabe Y, Hashimoto S, Kawashima H. Molecular cloning and functional expression of a cDNA encoding the human V1b vasopressin receptor. J Biol Chem. 1994;269(43):27088-27092.

65.     Raymond V, Leung PC, Veilleux R, Labrie F. Vasopressin rapidly stimulates phosphatidic acid-phosphatidylinositol turnover in rat anterior pituitary cells. FEBS Lett. 1985;182(1):196-200.

66.     Abou-Samra AB, Catt KJ, Aguilera G. Involvement of protein kinase C in the regulation of adrenocorticotropin release from rat anterior pituitary cells. Endocrinology. 1986;118(1):212-217.

67.     Plotsky PM. Hypophysiotropic regulation of stress-induced ACTH secretion. Adv Exp Med Biol. 1988;245:65-81.

68.     Bilezikjian LM, Woodgett JR, Hunter T, Vale WW. Phorbol ester-induced down-regulation of protein kinase C abolishes vasopressin-mediated responses in rat anterior pituitary cells. Mol Endocrinol. 1987;1(8):555-560.

69.     Levin N, Blum M, Roberts JL. Modulation of basal and corticotropin-releasing factor-stimulated proopiomelanocortin gene expression by vasopressin in rat anterior pituitary. Endocrinology. 1989;125(6):2957-2966.

70.     Morgenthaler NG, Struck J, Alonso C, Bergmann A. Assay for the measurement of copeptin, a stable peptide derived from the precursor of vasopressin. Clin Chem. 2006;52(1):112-119.

71.     Lewandowski KC, Lewinski A, Skowronska-Jozwiak E, Stasiak M, Horzelski W, Brabant G. Copeptin under glucagon stimulation. Endocrine. 2016;52(2):344-351.

72.     Kacheva S, Kolk K, Morgenthaler NG, Brabant G, Karges W. Gender-specific co-activation of arginine vasopressin and the hypothalamic-pituitary-adrenal axis during stress. Clin Endocrinol (Oxf). 2015;82(4):570-576.

73.     Brownstein MJ, Russell JT, Gainer H. Synthesis, transport, and release of posterior pituitary hormones. Science. 1980;207(4429):373-378.

74.     Legros JJ, Chiodera P, Demey-Ponsart E. Inhibitory influence of exogenous oxytocin on adrenocorticotropin secretion in normal human subjects. J Clin Endocrinol Metab. 1982;55(6):1035-1039.

75.     Legros JJ, Chiodera P, Geenen V, von Frenckell R. Confirmation of the inhibitory influence of exogenous oxytocin on cortisol and ACTH in man: evidence of reproducibility. Acta Endocrinol (Copenh). 1987;114(3):345-349.

76.     Lewis DA, Sherman BM. Oxytocin does not influence adrenocorticotropin secretion in man. J Clin Endocrinol Metab. 1985;60(1):53-56.

77.     Antoni FA, Holmes MC, Kiss JZ. Pituitary binding of vasopressin is altered by experimental manipulations of the hypothalamo-pituitary-adrenocortical axis in normal as well as homozygous (di/di) Brattleboro rats. Endocrinology. 1985;117(4):1293-1299.

78.     Winter J, Jurek B. The interplay between oxytocin and the CRF system: regulation of the stress response. Cell Tissue Res. 2019;375(1):85-91.

79.     Gibbs DM, Vale W, Rivier J, Yen SS. Oxytocin potentiates the ACTH-releasing activity of CRF(41) but not vasopressin. Life Sci. 1984;34(23):2245-2249.

80.     Alexander LD, Evans K, Sander LD. A possible involvement of VIP in feeding-induced secretion of ACTH and corticosterone in the rat. Physiol Behav. 1995;58(2):409-413.

81.     Alexander LD, Sander LD. Involvement of vasopressin and corticotropin-releasing hormone in VIP- and PHI-induced secretion of ACTH and corticosterone. Neuropeptides. 1995;28(3):167-173.

82.     Jirikowski GF, Back H, Forssmann WG, Stumpf WE. Coexistence of atrial natriuretic factor (ANF) and oxytocin in neurons of the rat hypothalamus. Neuropeptides. 1986;8(3):243-249.

83.     King MS, Baertschi AJ. Physiological concentrations of atrial natriuretic factors with intact N-terminal sequences inhibit corticotropin-releasing factor-stimulated adrenocorticotropin secretion from cultured anterior pituitary cells. Endocrinology. 1989;124(1):286-292.

84.     Kellner M, Wiedemann K, Holsboer F. Atrial natriuretic factor inhibits the CRH-stimulated secretion of ACTH and cortisol in man. Life Sci. 1992;50(24):1835-1842.

85.     Ur E, Faria M, Tsagarakis S, Anderson JV, Besser GM, Grossman A. Atrial natriuretic peptide in physiological doses does not inhibit the ACTH or cortisol response to corticotrophin-releasing hormone-41 in normal human subjects. J Endocrinol. 1991;131(1):163-167.

86.     Taylor T, Dluhy RG, Williams GH. beta-endorphin suppresses adrenocorticotropin and cortisol levels in normal human subjects. J Clin Endocrinol Metab. 1983;57(3):592-596.

87.     Tsagarakis S, Navarra P, Rees LH, Besser M, Grossman A, Navara P. Morphine directly modulates the release of stimulated corticotrophin-releasing factor-41 from rat hypothalamus in vitro [published erratum appears in Endocrinology 1989 Dec;125(6):3095]. Endocrinology. 1989;124(5):2330-2335.

88.     Jackson RV, Grice JE, Hockings GI, Torpy DJ. Naloxone-induced ACTH release: mechanism of action in humans. Clin Endocrinol (Oxf). 1995;43(4):423-424.

89.     Pagotto U, Marsicano G, Fezza F, Theodoropoulou M, Grubler Y, Stalla J, Arzberger T, Milone A, Losa M, Di Marzo V, Lutz B, Stalla GK. Normal human pituitary gland and pituitary adenomas express cannabinoid receptor type 1 and synthesize endogenous cannabinoids: first evidence for a direct role of cannabinoids on hormone modulation at the human pituitary level. J Clin Endocrinol Metab. 2001;86(6):2687-2696.

90.     Wade MR, Degroot A, Nomikos GG. Cannabinoid CB1 receptor antagonism modulates plasma corticosterone in rodents. Eur J Pharmacol. 2006;551(1-3):162-167.

91.     Cota D, Steiner MA, Marsicano G, Cervino C, Herman JP, Grubler Y, Stalla J, Pasquali R, Lutz B, Stalla GK, Pagotto U. Requirement of Cannabinoid Receptor Type 1 for the Basal Modulation of Hypothalamic-Pituitary-Adrenal Axis Function. Endocrinology. 2006.

92.     Benowitz NL, Jones RT, Lerner CB. Depression of growth hormone and cortisol response to insulin-induced hypoglycemia after prolonged oral delta-9-tetrahydrocannabinol administration in man. J Clin Endocrinol Metab. 1976;42(5):938-941.

93.     al-Damluji S. Adrenergic control of the secretion of anterior pituitary hormones. Baillieres Clin Endocrinol Metab. 1993;7(2):355-392.

94.     Kostoglou-Athanassiou I, Costa A, Navarra P, Nappi G, Forsling ML, Grossman AB. Endotoxin stimulates an endogenous pathway regulating corticotropin-releasing hormone and vasopressin release involving the generation of nitric oxide and carbon monoxide. J Neuroimmunol. 1998;86(1):104-109.

95.     Pozzoli G, Mancuso C, Mirtella A, Preziosi P, Grossman AB, Navarra P. Carbon monoxide as a novel neuroendocrine modulator: inhibition of stimulated corticotropin-releasing hormone release from acute rat hypothalamic explants. Endocrinology. 1994;135(6):2314-2317.

96.     Korbonits M, Kaltsas G, Perry LA, Grossman AB, Monson JP, Besser GM, Trainer PJ. Hexarelin as a test of pituitary reserve in patients with pituitary disease. Clin Endocrinol (Oxf). 1999;51(3):369-375.

97.     Korbonits M, Kaltsas G, Perry LA, Putignano P, Grossman AB, Besser GM, Trainer PJ. The growth hormone secretagogue hexarelin stimulates the hypothalamo-pituitary-adrenal axis via arginine vasopressin. J Clin Endocrinol Metab. 1999;84(7):2489-2495.

98.     Arvat E, Maccario M, Di Vito L, Broglio F, Benso A, Gottero C, Papotti M, Muccioli G, Dieguez C, Casanueva FF, Deghenghi R, Camanni F, Ghigo E. Endocrine activities of ghrelin, a natural growth hormone secretagogue (GHS), in humans: comparison and interactions with hexarelin, a nonnatural peptidyl GHS, and GH-releasing hormone. J Clin Endocrinol Metab. 2001;86(3):1169-1174.

99.     Mozid AM, Tringali G, Forsling ML, Hendricks MS, Ajodha S, Edwards R, Navarra P, Grossman AB, Korbonits M. Ghrelin is released from rat hypothalamic explants and stimulates corticotrophin-releasing hormone and arginine-vasopressin. Horm Metab Res. 2003;35(8):455-459.

100.   Arvat E, di Vito L, Maccagno B, Broglio F, Boghen MF, Deghenghi R, Camanni F, Ghigo E. Effects of GHRP-2 and hexarelin, two synthetic GH-releasing peptides, on GH, prolactin, ACTH and cortisol levels in man. Comparison with the effects of GHRH, TRH and hCRH. Peptides. 1997;18(6):885-891.

101.   Kimura T, Shimatsu A, Arimura H, Mori H, Tokitou A, Fukudome M, Nakazaki M, Tei C. Concordant and discordant adrenocorticotropin (ACTH) responses induced by growth hormone-releasing peptide-2 (GHRP-2), corticotropin-releasing hormone (CRH) and insulin-induced hypoglycemia in patients with hypothalamopituitary disorders: evidence for direct ACTH releasing activity of GHRP-2. Endocr J. 2010;57(7):639-644.

102.   Perras B, Schultes B, Schwaiger R, Metz C, Wesseler W, Born J, Fehm HL. Growth hormone-releasing hormone facilitates hypoglycemia-induced release of cortisol. Regul Pept. 2002;110(1):85-91.

103.   Zhang JV, Ren PG, Avsian-Kretchmer O, Luo CW, Rauch R, Klein C, Hsueh AJ. Obestatin, a peptide encoded by the ghrelin gene, opposes ghrelin's effects on food intake. Science. 2005;310(5750):996-999.

104.   Yamamoto D, Ikeshita N, Daito R, Herningtyas EH, Toda K, Takahashi K, Iida K, Takahashi Y, Kaji H, Chihara K, Okimura Y. Neither intravenous nor intracerebroventricular administration of obestatin affects the secretion of GH, PRL, TSH and ACTH in rats. Regul Pept. 2007;138(2-3):141-144.

105.   McKee KK, Tan CP, Palyha OC, Liu J, Feighner SD, Hreniuk DL, Smith RG, Howard AD, Van der Ploeg LH. Cloning and characterization of two human G protein-coupled receptor genes (GPR38 and GPR39) related to the growth hormone secretagogue and neurotensin receptors. Genomics. 1997;46(3):426-434.

106.   Holst B, Egerod KL, Schild E, Vickers SP, Cheetham S, Gerlach LO, Storjohann L, Stidsen CE, Jones R, Beck-Sickinger AG, Schwartz TW. GPR39 signaling is stimulated by zinc ions but not by obestatin. Endocrinology. 2007;148(1):13-20.

107.   Luque RM, Cordoba-Chacon J, Ibanez-Costa A, Gesmundo I, Grande C, Gracia-Navarro F, Tena-Sempere M, Ghigo E, Gahete MD, Granata R, Kineman RD, Castano JP. Obestatin plays an opposite role in the regulation of pituitary somatotrope and corticotrope function in female primates and male/female mice. Endocrinology. 2014:en20131728.

108.   Gaillard RC, Favrod-Coune CA, Capponi AM, Muller AF. Corticotropin-releasing activity of the renin-angiotensin system peptides in rat and in man. Neuroendocrinology. 1985;41(6):511-517.

109.   Rivier C, Vale W. Effect of angiotensin II on ACTH release in vivo: role of corticotropin-releasing factor. Regul Pept. 1983;7(3):253-258.

110.   Murakami K, Ganong WF. Site at which angiotensin II acts to stimulate ACTH secretion in vivo. Neuroendocrinology. 1987;46(3):231-235.

111.   Sumitomo T, Suda T, Nakano Y, Tozawa F, Yamada M, Demura H. Angiotensin II increases the corticotropin-releasing factor messenger ribonucleic acid level in the rat hypothalamus. Endocrinology. 1991;128(5):2248-2252.

112.   Armando I, Volpi S, Aguilera G, Saavedra JM. Angiotensin II AT1 receptor blockade prevents the hypothalamic corticotropin-releasing factor response to isolation stress. Brain Res. 2007;1142:92-99.

113.   Armando I, Carranza A, Nishimura Y, Hoe KL, Barontini M, Terron JA, Falcon-Neri A, Ito T, Juorio AV, Saavedra JM. Peripheral administration of an angiotensin II AT(1) receptor antagonist decreases the hypothalamic-pituitary-adrenal response to isolation Stress. Endocrinology. 2001;142(9):3880-3889.

114.   Strowski MZ, Dashkevicz MP, Parmar RM, Wilkinson H, Kohler M, Schaeffer JM, Blake AD. Somatostatin receptor subtypes 2 and 5 inhibit corticotropin-releasing hormone-stimulated adrenocorticotropin secretion from AtT-20 cells. Neuroendocrinology. 2002;75(6):339-346.

115.   Lamberts SW, Zuyderwijk J, den Holder F, van Koetsveld P, Hofland L. Studies on the conditions determining the inhibitory effect of somatostatin on adrenocorticotropin, prolactin and thyrotropin release by cultured rat pituitary cells. Neuroendocrinology. 1989;50(1):44-50.

116.   van der Hoek J, Waaijers M, van Koetsveld PM, Sprij-Mooij D, Feelders RA, Schmid HA, Schoeffter P, Hoyer D, Cervia D, Taylor JE, Culler MD, Lamberts SW, Hofland LJ. Distinct functional properties of native somatostatin receptor subtype 5 compared with subtype 2 in the regulation of ACTH release by corticotroph tumor cells. Am J Physiol Endocrinol Metab. 2005;289(2):E278-287.

117.   Silva AP, Schoeffter P, Weckbecker G, Bruns C, Schmid HA. Regulation of CRH-induced secretion of ACTH and corticosterone by SOM230 in rats. Eur J Endocrinol. 2005;153(3):R7-R10.

118.   Stafford PJ, Kopelman PG, Davidson K, McLoughlin L, White A, Rees LH, Besser GM, Coy DH, Grossman A. The pituitary-adrenal response to CRF-41 is unaltered by intravenous somatostatin in normal subjects. Clin Endocrinol (Oxf). 1989;30(6):661-666.

119.   Fehm HL, Voigt KH, Lang R, Beinert KE, Raptis S, Pfeiffer EF. Somatostatin: a potent inhibitor of ACTH-hypersecretion in adrenal insufficiency. Klin Wochenschr. 1976;54(4):173-175.

120.   de Bruin C, Pereira AM, Feelders RA, Romijn JA, Roelfsema F, Sprij-Mooij DM, van Aken MO, van der Lelij AJ, de Herder WW, Lamberts SW, Hofland LJ. Coexpression of dopamine and somatostatin receptor subtypes in corticotroph adenomas. J Clin Endocrinol Metab. 2009;94(4):1118-1124.

121.   Hofland LJ, van der Hoek J, Feelders R, van Aken MO, van Koetsveld PM, Waaijers M, Sprij-Mooij D, Bruns C, Weckbecker G, de Herder WW, Beckers A, Lamberts SW. The multi-ligand somatostatin analogue SOM230 inhibits ACTH secretion by cultured human corticotroph adenomas via somatostatin receptor type 5. Eur J Endocrinol. 2005;152(4):645-654.

122.   Feelders RA, de Bruin C, Pereira AM, Romijn JA, Netea-Maier RT, Hermus AR, Zelissen PM, van Heerebeek R, de Jong FH, van der Lely AJ, de Herder WW, Hofland LJ, Lamberts SW. Pasireotide alone or with cabergoline and ketoconazole in Cushing's disease. N Engl J Med. 2010;362(19):1846-1848.

123.   de Herder WW, Lamberts SW. Is there a role for somatostatin and its analogs in Cushing's syndrome? Metabolism. 1996;45(8 Suppl 1):83-85.

124.   Redei E, Hilderbrand H, Aird F. Corticotropin release inhibiting factor is encoded within prepro-TRH. Endocrinology. 1995;136(4):1813-1816.

125.   Redei E, Hilderbrand H, Aird F. Corticotropin release-inhibiting factor is preprothyrotropin-releasing hormone-(178-199). Endocrinology. 1995;136(8):3557-3563.

126.   Nicholson WE, Orth DN. Preprothyrotropin-releasing hormone-(178-199) does not inhibit corticotropin release. Endocrinology. 1996;137(5):2171-2174.

127.   Gershengorn MC, Arevalo CO, Geras E, Rebecchi MJ. Thyrotropin-releasing hormone stimulation of adrenocorticotropin production by mouse pituitary tumor cells in culture: possible model for anomalous release of adrenocorticotropin by thyrotropin-releasing hormone in some patients with Cushing's disease and Nelson's syndrome. J Clin Invest. 1980;65(6):1294-1300.

128.   Bernardini R, Kamilaris TC, Calogero AE, Johnson EO, Gomez MT, Gold PW, Chrousos GP. Interactions between tumor necrosis factor-alpha, hypothalamic corticotropin-releasing hormone, and adrenocorticotropin secretion in the rat. Endocrinology. 1990;126(6):2876-2881.

129.   Perlstein RS, Mougey EH, Jackson WE, Neta R. Interleukin-1 and interleukin-6 act synergistically to stimulate the release of adrenocorticotropic hormone in vivo. Lymphokine Cytokine Res. 1991;10(1-2):141-146.

130.   Uehara A, Gottschall PE, Dahl RR, Arimura A. Stimulation of ACTH release by human interleukin-1 beta, but not by interleukin-1 alpha, in conscious, freely-moving rats. Biochem Biophys Res Commun. 1987;146(3):1286-1290.

131.   Uehara A, Gottschall PE, Dahl RR, Arimura A. Interleukin-1 stimulates ACTH release by an indirect action which requires endogenous corticotropin releasing factor. Endocrinology. 1987;121(4):1580-1582.

132.   Besedovsky HO, del Rey A. Immune-neuro-endocrine interactions: facts and hypotheses. Endocr Rev. 1996;17(1):64-102.

133.   Murdoch GH, Potter E, Nicolaisen AK, Evans RM, Rosenfeld MG. Epidermal growth factor rapidly stimulates prolactin gene transcription. Nature. 1982;300(5888):192-194.

134.   Kontogeorgos G, Stefaneanu L, Kovacs K, Cheng Z. Localization of Epidermal Growth Factor (EGF) and Epidermal Growth Factor Receptor (EGFr) in Human Pituitary Adenomas and Nontumorous Pituitaries: An Immunocytochemical Study. Endocr Pathol. 1996;7(1):63-70.

135.   Reincke M, Sbiera S, Hayakawa A, Theodoropoulou M, Osswald A, Beuschlein F, Meitinger T, Mizuno-Yamasaki E, Kawaguchi K, Saeki Y, Tanaka K, Wieland T, Graf E, Saeger W, Ronchi CL, Allolio B, Buchfelder M, Strom TM, Fassnacht M, Komada M. Mutations in the deubiquitinase gene USP8 cause Cushing's disease. Nat Genet. 2015;47(1):31-38.

136.   Araki T, Liu X, Kameda H, Tone Y, Fukuoka H, Tone M, Melmed S. EGFR Induces E2F1-Mediated Corticotroph Tumorigenesis. J Endocr Soc. 2017;1(2):127-143.

137.   Fukuoka H, Cooper O, Ben-Shlomo A, Mamelak A, Ren SG, Bruyette D, Melmed S. EGFR as a therapeutic target for human, canine, and mouse ACTH-secreting pituitary adenomas. J Clin Invest. 2011;121(12):4712-4721.

138.   Perez-Rivas LG, Theodoropoulou M, Ferrau F, Nusser C, Kawaguchi K, Stratakis CA, Faucz FR, Wildemberg LE, Assie G, Beschorner R, Dimopoulou C, Buchfelder M, Popovic V, Berr CM, Toth M, Ardisasmita AI, Honegger J, Bertherat J, Gadelha MR, Beuschlein F, Stalla G, Komada M, Korbonits M, Reincke M. The Gene of the Ubiquitin-Specific Protease 8 Is Frequently Mutated in Adenomas Causing Cushing's Disease. J Clin Endocrinol Metab. 2015;100(7):E997-1004.

139.   Perez-Rivas LG, Osswald A, Knosel T, Lucia K, Schaaf C, Hristov M, Fazel J, Kirchner T, Beuschlein F, Reincke M, Theodoropoulou M. Expression and mutational status of USP8 in tumors causing ectopic ACTH secretion syndrome. Endocr Relat Cancer. 2017;24(9):L73-L77.

140.   Veldhuis JD, Iranmanesh A, Johnson ML, Lizarralde G. Amplitude, but not frequency, modulation of adrenocorticotropin secretory bursts gives rise to the nyctohemeral rhythm of the corticotropic axis in man. J Clin Endocrinol Metab. 1990;71(2):452-463.

141.   Krishnan KR, Ritchie JC, Saunders W, Wilson W, Nemeroff CB, Carroll BJ. Nocturnal and early morning secretion of ACTH and cortisol in humans. Biol Psychiatry. 1990;28(1):47-57.

142.   Desir D, Van Cauter E, Beyloos M, Bosson D, Golstein J, Copinschi G. Prolonged pulsatile administration of ovine corticotropin-releasing hormone in normal man. J Clin Endocrinol Metab. 1986;63(6):1292-1299.

143.   Gambacciani M, Liu JH, Swartz WH, Tueros VS, Rasmussen DD, Yen SS. Intrinsic pulsatility of ACTH release from the human pituitary in vitro. Clin Endocrinol (Oxf). 1987;26(5):557-563.

144.   Kiessling S, Eichele G, Oster H. Adrenal glucocorticoids have a key role in circadian resynchronization in a mouse model of jet lag. J Clin Invest. 2010;120(7):2600-2609.

145.   Moore RY, Eichler VB. Loss of a circadian adrenal corticosterone rhythm following suprachiasmatic lesions in the rat. Brain Res. 1972;42(1):201-206.

146.   Dunlap JC. Molecular bases for circadian clocks. Cell. 1999;96(2):271-290.

147.   Koch CE, Leinweber B, Drengberg BC, Blaum C, Oster H. Interaction between circadian rhythms and stress. Neurobiol Stress. 2017;6:57-67.

148.   Kornhauser JM, Nelson DE, Mayo KE, Takahashi JS. Photic and circadian regulation of c-fos gene expression in the hamster suprachiasmatic nucleus. Neuron. 1990;5(2):127-134.

149.   Kornhauser JM, Nelson DE, Mayo KE, Takahashi JS. Regulation of jun-B messenger RNA and AP-1 activity by light and a circadian clock. Science. 1992;255(5051):1581-1584.

150.   Crosio C, Cermakian N, Allis CD, Sassone-Corsi P. Light induces chromatin modification in cells of the mammalian circadian clock. Nat Neurosci. 2000;3(12):1241-1247.

151.   Leliavski A, Shostak A, Husse J, Oster H. Impaired glucocorticoid production and response to stress in Arntl-deficient male mice. Endocrinology. 2014;155(1):133-142.

152.   Turek FW, Joshu C, Kohsaka A, Lin E, Ivanova G, McDearmon E, Laposky A, Losee-Olson S, Easton A, Jensen DR, Eckel RH, Takahashi JS, Bass J. Obesity and metabolic syndrome in circadian Clock mutant mice. Science. 2005;308(5724):1043-1045.

153.   Yang S, Liu A, Weidenhammer A, Cooksey RC, McClain D, Kim MK, Aguilera G, Abel ED, Chung JH. The role of mPer2 clock gene in glucocorticoid and feeding rhythms. Endocrinology. 2009;150(5):2153-2160.

154.   Barclay JL, Shostak A, Leliavski A, Tsang AH, Johren O, Muller-Fielitz H, Landgraf D, Naujokat N, van der Horst GT, Oster H. High-fat diet-induced hyperinsulinemia and tissue-specific insulin resistance in Cry-deficient mice. Am J Physiol Endocrinol Metab. 2013;304(10):E1053-1063.

155.   Lamia KA, Papp SJ, Yu RT, Barish GD, Uhlenhaut NH, Jonker JW, Downes M, Evans RM. Cryptochromes mediate rhythmic repression of the glucocorticoid receptor. Nature. 2011;480(7378):552-556.

156.   Watabe T, Tanaka K, Kumagae M, Itoh S, Hasegawa M, Horiuchi T, Miyabe S, Ohno H, Shimizu N. Diurnal rhythm of plasma immunoreactive corticotropin-releasing factor in normal subjects. Life Sci. 1987;40(17):1651-1655.

157.   Cai A, Wise PM. Age-related changes in the diurnal rhythm of CRH gene expression in the paraventricular nuclei. Am J Physiol. 1996;270(2 Pt 1):E238-243.

158.   Cunnah D, Jessop DS, Besser GM, Rees LH. Measurement of circulating corticotrophin-releasing factor in man. J Endocrinol. 1987;113(1):123-131.

159.   Ur E, Capstick C, McLoughlin L, Checkley S, Besser GM, Grossman A. Continuous administration of human corticotropin-releasing hormone in the absence of glucocorticoid feedback in man. Neuroendocrinology. 1995;61(2):191-197.

160.   Yamase K, Takahashi S, Nomura K, Haruta K, Kawashima S. Circadian changes in arginine vasopressin level in the suprachiasmatic nuclei in the rat. Neurosci Lett. 1991;130(2):255-258.

161.   Jin X, Shearman LP, Weaver DR, Zylka MJ, de Vries GJ, Reppert SM. A molecular mechanism regulating rhythmic output from the suprachiasmatic circadian clock. Cell. 1999;96(1):57-68.

162.   Fahrenkrug J, Hannibal J, Georg B. Diurnal rhythmicity of the canonical clock genes Per1, Per2 and Bmal1 in the rat adrenal gland is unaltered after hypophysectomy. J Neuroendocrinol. 2008;20(3):323-329.

163.   Ishida A, Mutoh T, Ueyama T, Bando H, Masubuchi S, Nakahara D, Tsujimoto G, Okamura H. Light activates the adrenal gland: timing of gene expression and glucocorticoid release. Cell Metab. 2005;2(5):297-307.

164.   Oster H, Damerow S, Hut RA, Eichele G. Transcriptional profiling in the adrenal gland reveals circadian regulation of hormone biosynthesis genes and nucleosome assembly genes. J Biol Rhythms. 2006;21(5):350-361.

165.   Yoder JM, Brandeland M, Engeland WC. Phase-dependent resetting of the adrenal clock by ACTH in vitro. Am J Physiol Regul Integr Comp Physiol. 2014;306(6):R387-393.

166.   Plotsky PM, Bruhn TO, Vale W. Hypophysiotropic regulation of adrenocorticotropin secretion in response to insulin-induced hypoglycemia. Endocrinology. 1985;117(1):323-329.

167.   Plotsky PM, Bruhn TO, Vale W. Evidence for multifactor regulation of the adrenocorticotropin secretory response to hemodynamic stimuli. Endocrinology. 1985;116(2):633-639.

168.   Berkenbosch F, De Goeij DC, Tilders FJ. Hypoglycemia enhances turnover of corticotropin-releasing factor and of vasopressin in the zona externa of the rat median eminence. Endocrinology. 1989;125(1):28-34.

169.   Jones BJ, Tan T, Bloom SR. Minireview: Glucagon in stress and energy homeostasis. Endocrinology. 2012;153(3):1049-1054.

170.   Meeran K, Hattersley A, Mould G, Bloom SR. Venepuncture causes rapid rise in plasma ACTH. Br J Clin Pract. 1993;47(5):246-247.

171.   Plumpton FS, Besser GM. The adrenocortical response to surgery and insulin-induced hypoglycaemia in corticosteroid-treated and normal subjects. Br J Surg. 1969;56(3):216-219.

172.   Plumpton FS, Besser GM, Cole PV. Corticosteroid treatment and surgery. 1. An investigation of the indications for steroid cover. Anaesthesia. 1969;24(1):3-11.

173.   Plumpton FS, Besser GM, Cole PV. Corticosteroid treatment and surgery. 2. The management of steroid cover. Anaesthesia. 1969;24(1):12-18.

174.   Khoo B, Boshier PR, Freethy A, Tharakan G, Saeed S, Hill N, Williams EL, Moorthy K, Tolley N, Jiao LR, Spalding D, Palazzo F, Meeran K, Tan T. Redefining the stress cortisol response to surgery. Clin Endocrinol (Oxf). 2017.

175.   Ma XM, Levy A, Lightman SL. Rapid changes in heteronuclear RNA for corticotrophin-releasing hormone and arginine vasopressin in response to acute stress. J Endocrinol. 1997;152(1):81-89.

176.   Ma XM, Aguilera G. Transcriptional responses of the vasopressin and corticotropin-releasing hormone genes to acute and repeated intraperitoneal hypertonic saline injection in rats. Brain Res Mol Brain Res. 1999;68(1-2):129-140.

177.   Kim CK, Rivier CL. Nitric oxide and carbon monoxide have a stimulatory role in the hypothalamic-pituitary-adrenal response to physico-emotional stressors in rats. Endocrinology. 2000;141(6):2244-2253.

178.   Bernstein HG, Keilhoff G, Seidel B, Stanarius A, Huang PL, Fishman MC, Reiser M, Bogerts B, Wolf G. Expression of hypothalamic peptides in mice lacking neuronal nitric oxide synthase: reduced beta-END immunoreactivity in the arcuate nucleus. Neuroendocrinology. 1998;68(6):403-411.

179.   Yamada K, Emson P, Hokfelt T. Immunohistochemical mapping of nitric oxide synthase in the rat hypothalamus and colocalization with neuropeptides. J Chem Neuroanat. 1996;10(3-4):295-316.

180.   Keilhoff G, Seidel B, Reiser M, Stanarius A, Huang PL, Bogerts B, Wolf G, Bernstein HG. Lack of neuronal NOS has consequences for the expression of POMC and POMC-derived peptides in the mouse pituitary. Acta Histochem. 2001;103(4):397-412.

181.   Bale TL, Contarino A, Smith GW, Chan R, Gold LH, Sawchenko PE, Koob GF, Vale WW, Lee KF. Mice deficient for corticotropin-releasing hormone receptor-2 display anxiety-like behaviour and are hypersensitive to stress. Nat Genet. 2000;24(4):410-414.

182.   Coste SC, Kesterson RA, Heldwein KA, Stevens SL, Heard AD, Hollis JH, Murray SE, Hill JK, Pantely GA, Hohimer AR, Hatton DC, Phillips TJ, Finn DA, Low MJ, Rittenberg MB, Stenzel P, Stenzel-Poore MP. Abnormal adaptations to stress and impaired cardiovascular function in mice lacking corticotropin-releasing hormone receptor-2. Nat Genet. 2000;24(4):403-409.

183.   Aguilera G, Rabadan-Diehl C. Vasopressinergic regulation of the hypothalamic-pituitary-adrenal axis: implications for stress adaptation. Regul Pept. 2000;96(1-2):23-29.

184.   Michalaki M, Margeli T, Tsekouras A, Gogos CH, Vagenakis AG, Kyriazopoulou V. Hypothalamic-pituitary-adrenal axis response to the severity of illness in non-critically ill patients: does relative corticosteroid insufficiency exist? Eur J Endocrinol. 2010;162(2):341-347.

185.   Tan T, Khoo B, Mills EG, Phylactou M, Patel B, Eng PC, Thurston L, Muzi B, Meeran K, Prevost AT, Comninos AN, Abbara A, Dhillo WS. Association between high serum total cortisol concentrations and mortality from COVID-19. Lancet Diabetes Endocrinol. 2020.

186.   Dumbell R, Matveeva O, Oster H. Circadian Clocks, Stress, and Immunity. Front Endocrinol (Lausanne). 2016;7:37.

187.   Itoi K, Mouri T, Takahashi K, Murakami O, Imai Y, Sasaki S, Yoshinaga K, Sasano N. Suppression by glucocorticoid of the immunoreactivity of corticotropin-releasing factor and vasopressin in the paraventricular nucleus of rat hypothalamus. Neurosci Lett. 1987;73(3):231-236.

188.   Davis LG, Arentzen R, Reid JM, Manning RW, Wolfson B, Lawrence KL, Baldino F, Jr. Glucocorticoid sensitivity of vasopressin mRNA levels in the paraventricular nucleus of the rat. Proc Natl Acad Sci U S A. 1986;83(4):1145-1149.

189.   Abou-Samra AB, Catt KJ, Aguilera G. Biphasic inhibition of adrenocorticotropin release by corticosterone in cultured anterior pituitary cells. Endocrinology. 1986;119(3):972-977.

190.   Russell GM, Henley DE, Leendertz J, Douthwaite JA, Wood SA, Stevens A, Woltersdorf WW, Peeters BW, Ruigt GS, White A, Veldhuis JD, Lightman SL. Rapid glucocorticoid receptor-mediated inhibition of hypothalamic-pituitary-adrenal ultradian activity in healthy males. J Neurosci. 2010;30(17):6106-6115.

191.   Dallman MF, Akana SF, Cascio CS, Darlington DN, Jacobson L, Levin N. Regulation of ACTH secretion: variations on a theme of B. Recent Prog Horm Res. 1987;43:113-173.

192.   Keller-Wood ME, Dallman MF. Corticosteroid inhibition of ACTH secretion. Endocr Rev. 1984;5(1):1-24.

193.   Deng Q, Riquelme D, Trinh L, Low MJ, Tomic M, Stojilkovic S, Aguilera G. Rapid Glucocorticoid Feedback Inhibition of ACTH Secretion Involves Ligand-Dependent Membrane Association of Glucocorticoid Receptors. Endocrinology. 2015;156(9):3215-3227.

194.   Taylor AD, Cowell AM, Flower J, Buckingham JC. Lipocortin 1 mediates an early inhibitory action of glucocorticoids on the secretion of ACTH by the rat anterior pituitary gland in vitro. Neuroendocrinology. 1993;58(4):430-439.

195.   Morris DG, Kola B, Borboli N, Kaltsas GA, Gueorguiev M, McNicol AM, Ferrier R, Jones TH, Baldeweg S, Powell M, Czirjak S, Hanzely Z, Johansson JO, Korbonits M, Grossman AB. Identification of adrenocorticotropin receptor messenger ribonucleic acid in the human pituitary and its loss of expression in pituitary adenomas. J Clin Endocrinol Metab. 2003;88(12):6080-6087.

196.   Evans AN, Liu Y, Macgregor R, Huang V, Aguilera G. Regulation of hypothalamic corticotropin-releasing hormone transcription by elevated glucocorticoids. Molecular endocrinology. 2013;27(11):1796-1807.

197.   Drouin J, Bilodeau S, Vallette S. Of old and new diseases: genetics of pituitary ACTH excess (Cushing) and deficiency. Clin Genet. 2007;72(3):175-182.

198.   Bilodeau S, Vallette-Kasic S, Gauthier Y, Figarella-Branger D, Brue T, Berthelet F, Lacroix A, Batista D, Stratakis C, Hanson J, Meij B, Drouin J. Role of Brg1 and HDAC2 in GR trans-repression of the pituitary POMC gene and misexpression in Cushing disease. Genes Dev. 2006;20(20):2871-2886.

199.   Suda T, Tomori N, Yajima F, Ushiyama T, Sumitomo T, Nakagami Y, Demura H, Shizume K. A short negative feedback mechanism regulating corticotropin-releasing hormone release. J Clin Endocrinol Metab. 1987;64(5):909-913.

200.   Sawchenko PE, Arias C. Evidence for short-loop feedback effects of ACTH on CRF and vasopressin expression in parvocellular neurosecretory neurons. J Neuroendocrinol. 1995;7(9):721-731.

201.   Roussel-Gervais A, Couture C, Langlais D, Takayasu S, Balsalobre A, Rueda BR, Zukerberg LR, Figarella-Branger D, Brue T, Drouin J. The Cables1 Gene in Glucocorticoid Regulation of Pituitary Corticotrope Growth and Cushing Disease. J Clin Endocrinol Metab. 2016;101(2):513-522.

202.   Quigley ME, Yen SS. A mid-day surge in cortisol levels. J Clin Endocrinol Metab. 1979;49(6):945-947.

203.   Follenius M, Brandenberger G, Hietter B. Diurnal cortisol peaks and their relationships to meals. J Clin Endocrinol Metab. 1982;55(4):757-761.

204.   Stimson RH, Mohd-Shukri NA, Bolton JL, Andrew R, Reynolds RM, Walker BR. The postprandial rise in plasma cortisol in men is mediated by macronutrient-specific stimulation of adrenal and extra-adrenal cortisol production. J Clin Endocrinol Metab. 2014;99(1):160-168.

205.   Al-Damluji S, Iveson T, Thomas JM, Pendlebury DJ, Rees LH, Besser GM. Food-induced cortisol secretion is mediated by central alpha-1 adrenoceptor modulation of pituitary ACTH secretion. Clin Endocrinol (Oxf). 1987;26(5):629-636.

206.   Korbonits M, Trainer PJ, Nelson ML, Howse I, Kopelman PG, Besser GM, Grossman AB, Svec F. Differential stimulation of cortisol and dehydroepiandrosterone levels by food in obese and normal subjects: relation to body fat distribution. Clin Endocrinol (Oxf). 1996;45(6):699-706.

207.   Wake DJ, Homer NZ, Andrew R, Walker BR. Acute in vivo regulation of 11beta-hydroxysteroid dehydrogenase type 1 activity by insulin and intralipid infusions in humans. J Clin Endocrinol Metab. 2006;91(11):4682-4688.

208.   Benedict C, Hallschmid M, Scheibner J, Niemeyer D, Schultes B, Merl V, Fehm HL, Born J, Kern W. Gut protein uptake and mechanisms of meal-induced cortisol release. J Clin Endocrinol Metab. 2005;90(3):1692-1696.

209.   Larsen PJ, Tang-Christensen M, Jessop DS. Central administration of glucagon-like peptide-1 activates hypothalamic neuroendocrine neurons in the rat. Endocrinology. 1997;138(10):4445-4455.

210.   Ryan AS, Egan JM, Habener JF, Elahi D. Insulinotropic hormone glucagon-like peptide-1-(7-37) appears not to augment insulin-mediated glucose uptake in young men during euglycemia. J Clin Endocrinol Metab. 1998;83(7):2399-2404.

211.   Gil-Lozano M, Perez-Tilve D, Alvarez-Crespo M, Martis A, Fernandez AM, Catalina PA, Gonzalez-Matias LC, Mallo F. GLP-1(7-36)-amide and Exendin-4 stimulate the HPA axis in rodents and humans. Endocrinology. 2010;151(6):2629-2640.

212.   Lacroix A, Bolte E, Tremblay J, Dupre J, Poitras P, Fournier H, Garon J, Garrel D, Bayard F, Taillefer R, et al. Gastric inhibitory polypeptide-dependent cortisol hypersecretion--a new cause of Cushing's syndrome. N Engl J Med. 1992;327(14):974-980.

213.   Gogebakan O, Andres J, Biedasek K, Mai K, Kuhnen P, Krude H, Isken F, Rudovich N, Osterhoff MA, Kintscher U, Nauck M, Pfeiffer AF, Spranger J. Glucose-dependent insulinotropic polypeptide reduces fat-specific expression and activity of 11beta-hydroxysteroid dehydrogenase type 1 and inhibits release of free fatty acids. Diabetes. 2012;61(2):292-300.

214.   Swaab DF, Bao AM, Lucassen PJ. The stress system in the human brain in depression and neurodegeneration. Ageing Res Rev. 2005;4(2):141-194.

215.   Ferrari E, Magri F. Role of neuroendocrine pathways in cognitive decline during aging. Ageing Res Rev. 2008;7(3):225-233.

216.   Aguilera G. HPA axis responsiveness to stress: implications for healthy aging. Exp Gerontol. 2011;46(2-3):90-95.

217.   Kasckow JW, Lupien SJ, Behan DP, Welge J, Hauger RJ. Circulating human corticotropin-releasing factor-binding protein levels following cortisol infusions. Life Sci. 2001;69(2):133-142.

218.   Tizabi Y, Aguilera G, Gilad GM. Age-related reduction in pituitary corticotropin-releasing hormone receptors in two rat strains. Neurobiol Aging. 1992;13(2):227-230.

219.   Lupien S, Lecours AR, Schwartz G, Sharma S, Hauger RL, Meaney MJ, Nair NP. Longitudinal study of basal cortisol levels in healthy elderly subjects: evidence for subgroups. Neurobiol Aging. 1996;17(1):95-105.

220.   Linkowski P, Van Onderbergen A, Kerkhofs M, Bosson D, Mendlewicz J, Van Cauter E. Twin study of the 24-h cortisol profile: evidence for genetic control of the human circadian clock. Am J Physiol. 1993;264(2 Pt 1):E173-181.

221.   Franz CE, York TP, Eaves LJ, Mendoza SP, Hauger RL, Hellhammer DH, Jacobson KC, Levine S, Lupien SJ, Lyons MJ, Prom-Wormley E, Xian H, Kremen WS. Genetic and environmental influences on cortisol regulation across days and contexts in middle-aged men. Behav Genet. 2010;40(4):467-479.

222.   Cai A, Scarbrough K, Hinkle DA, Wise PM. Fetal grafts containing suprachiasmatic nuclei restore the diurnal rhythm of CRH and POMC mRNA in aging rats. Am J Physiol. 1997;273(5 Pt 2):R1764-1770.

223.   Cooper MS. 11beta-Hydroxysteroid dehydrogenase: a regulator of glucocorticoid response in osteoporosis. J Endocrinol Invest. 2008;31(7 Suppl):16-21.

224.   Holmes MC, Carter RN, Noble J, Chitnis S, Dutia A, Paterson JM, Mullins JJ, Seckl JR, Yau JL. 11beta-hydroxysteroid dehydrogenase type 1 expression is increased in the aged mouse hippocampus and parietal cortex and causes memory impairments. J Neurosci. 2010;30(20):6916-6920.

225.   Lesniewska B, Miskowiak B, Nowak M, Malendowicz LK. Sex differences in adrenocortical structure and function. XXVII. The effect of ether stress on ACTH and corticosterone in intact, gonadectomized, and testosterone- or estradiol-replaced rats. Res Exp Med (Berl). 1990;190(2):95-103.

226.   Lesniewska B, Nowak M, Malendowicz LK. Sex differences in adrenocortical structure and function. XXVIII. ACTH and corticosterone in intact, gonadectomised and gonadal hormone replaced rats. Horm Metab Res. 1990;22(7):378-381.

227.   Jezova D, Kvetnansky R, Vigas M. Sex differences in endocrine response to hyperthermia in sauna. Acta Physiol Scand. 1994;150(3):293-298.

228.   Jezova D, Jurankova E, Mosnarova A, Kriska M, Skultetyova I. Neuroendocrine response during stress with relation to gender differences. Acta Neurobiol Exp (Wars). 1996;56(3):779-785.

229.   Vamvakopoulos NC, Chrousos GP. Evidence of direct estrogenic regulation of human corticotropin-releasing hormone gene expression. Potential implications for the sexual dimophism of the stress response and immune/inflammatory reaction. J Clin Invest. 1993;92(4):1896-1902.

230.   Kirschbaum C, Wust S, Faig HG, Hellhammer DH. Heritability of cortisol responses to human corticotropin-releasing hormone, ergometry, and psychological stress in humans. J Clin Endocrinol Metab. 1992;75(6):1526-1530.

231.   Matthews KA, Gump BB, Owens JF. Chronic stress influences cardiovascular and neuroendocrine responses during acute stress and recovery, especially in men. Health Psychol. 2001;20(6):403-410.

232.   Horvath E, Kovacs K. Fine structural cytology of the adenohypophysis in rat and man. J Electron Microsc Tech. 1988;8(4):401-432.

233.   Cohen LE, Radovick S. Molecular basis of combined pituitary hormone deficiencies. Endocr Rev. 2002;23(4):431-442.

234.   Kapali J, Kabat BE, Schmidt KL, Stallings CE, Tippy M, Jung DO, Edwards BS, Nantie LB, Raeztman LT, Navratil AM, Ellsworth BS. Foxo1 Is Required for Normal Somatotrope Differentiation. Endocrinology. 2016;157(11):4351-4363.

235.   Zhu X, Zhang J, Tollkuhn J, Ohsawa R, Bresnick EH, Guillemot F, Kageyama R, Rosenfeld MG. Sustained Notch signaling in progenitors is required for sequential emergence of distinct cell lineages during organogenesis. Genes Dev. 2006;20(19):2739-2753.

236.   Li CH, Papkoff H. Preparation and properties of growth hormone from human and monkey pituitary glands. Science. 1956;124(3235):1293-1294.

237.   Li CH, Dixon JS. Human pituitary growth hormone. 32. The primary structure of the hormone: revision. Arch Biochem Biophys. 1971;146(1):233-236.

238.   Niall HD, Hogan ML, Sauer R, Rosenblum IY, Greenwood FC. Sequences of pituitary and placental lactogenic and growth hormones: evolution from a primordial peptide by gene reduplication. Proc Natl Acad Sci U S A. 1971;68(4):866-870.

239.   Owerbach D, Rutter WJ, Martial JA, Baxter JD, Shows TB. Genes for growth hormone, chorionic somatommammotropin, and growth hormones-like gene on chromosome 17 in humans. Science. 1980;209(4453):289-292.

240.   McKusick V, Phillips JI, Bottani A, Antonarakis S, O'Neill M, Kniffin C, Hartz P, Gross M. GROWTH HORMONE 1; GH1. In: McKusick V, ed. Online Mendelian Inheritance in Man. Baltimore, MD, USA: Johns Hopkins University; 2007: http://www.ncbi.nlm.nih.gov:80/entrez/dispomim.cgi?id=139250. Accessed 20 Jan 2007

241.   Frankenne F, Rentier-Delrue F, Scippo ML, Martial J, Hennen G. Expression of the growth hormone variant gene in human placenta. J Clin Endocrinol Metab. 1987;64(3):635-637.

242.   Liebhaber SA, Urbanek M, Ray J, Tuan RS, Cooke NE. Characterization and histologic localization of human growth hormone-variant gene expression in the placenta. J Clin Invest. 1989;83(6):1985-1991.

243.   McKusick V, Phillips JI. GROWTH HORMONE 2; GH2. In: McKusick V, ed. Online Mendelian Inheritance in Man. Baltimore, MD: Johns Hopkins University; 2007: http://www.ncbi.nlm.nih.gov:80/entrez/dispomim.cgi?id=139240. Accessed 20 Jan 2007

244.   McKusick V, Phillips JI, Rasooly R. CHORIONIC SOMATOMAMMOTROPIN HORMONE 1; CSH1. In: McKusick V, ed. Online Mendelian Inheritance in Man. Baltimore, MD: Johns Hopkins University; 2007: http://www.ncbi.nlm.nih.gov:80/entrez/dispomim.cgi?id=150200. Accessed 20 Jan 2007

245.   McKusick V, Rasooly R. CHORIONIC SOMATOMAMMOTROPIN HORMONE 2; CSH2. In: McKusick V, ed. Online Mendelian Inheritance in Man. Baltimore, MD: Johns Hopkins University; 2007: http://www.ncbi.nlm.nih.gov:80/entrez/dispomim.cgi?id=118820. Accessed 20 Jan 2007

246.   Rasooly R. CHORIONIC SOMATOMAMMOTROPIN HORMONE-LIKE 1; CSHL1. In: McKusick V, ed. Online Mendelian Inheritance in Man. Baltimore, MD: Johns Hopkins University; 2007: http://www.ncbi.nlm.nih.gov:80/entrez/dispomim.cgi?id=603515. Accessed 20 Jan 2007

247.   Chen EY, Liao YC, Smith DH, Barrera-Saldana HA, Gelinas RE, Seeburg PH. The human growth hormone locus: nucleotide sequence, biology, and evolution. Genomics. 1989;4(4):479-497.

248.   Bodner M, Castrillo JL, Theill LE, Deerinck T, Ellisman M, Karin M. The pituitary-specific transcription factor GHF-1 is a homeobox-containing protein. Cell. 1988;55(3):505-518.

249.   Lemaigre FP, Peers B, Lafontaine DA, Mathy-Hartert M, Rousseau GG, Belayew A, Martial JA. Pituitary-specific factor binding to the human prolactin, growth hormone, and placental lactogen genes. DNA. 1989;8(3):149-159.

250.   Lemaigre FP, Courtois SJ, Durviaux SM, Egan CJ, LaFontaine DA, Rousseau GG. Analysis of cis- and trans-acting elements in the hormone-sensitive human somatotropin gene promoter. J Steroid Biochem. 1989;34(1-6):79-83.

251.   Nachtigal MW, Nickel BE, Klassen ME, Zhang WG, Eberhardt NL, Cattini PA. Human chorionic somatomammotropin and growth hormone gene expression in rat pituitary tumour cells is dependent on proximal promoter sequences. Nucleic Acids Res. 1989;17(11):4327-4337.

252.   Li S, Crenshaw EB, 3rd, Rawson EJ, Simmons DM, Swanson LW, Rosenfeld MG. Dwarf locus mutants lacking three pituitary cell types result from mutations in the POU-domain gene pit-1. Nature. 1990;347(6293):528-533.

253.   Fox SR, Jong MT, Casanova J, Ye ZS, Stanley F, Samuels HH. The homeodomain protein, Pit-1/GHF-1, is capable of binding to and activating cell-specific elements of both the growth hormone and prolactin gene promoters. Mol Endocrinol. 1990;4(7):1069-1080.

254.   Tansey WP, Catanzaro DF. Sp1 and thyroid hormone receptor differentially activate expression of human growth hormone and chorionic somatomammotropin genes. J Biol Chem. 1991;266(15):9805-9813.

255.   Nickel BE, Nachtigal MW, Bock ME, Cattini PA. Differential binding of rat pituitary-specific nuclear factors to the 5'-flanking region of pituitary and placental members of the human growth hormone gene family. Mol Cell Biochem. 1991;106(2):181-187.

256.   Walker WH, Fitzpatrick SL, Saunders GF. Human placental lactogen transcriptional enhancer. Tissue specificity and binding with specific proteins. J Biol Chem. 1990;265(22):12940-12948.

257.   Nachtigal MW, Nickel BE, Cattini PA. Pituitary-specific repression of placental members of the human growth hormone gene family. A possible mechanism for locus regulation. J Biol Chem. 1993;268(12):8473-8479.

258.   Jones BK, Monks BR, Liebhaber SA, Cooke NE. The human growth hormone gene is regulated by a multicomponent locus control region. Mol Cell Biol. 1995;15(12):7010-7021.

259.   Shewchuk BM, Liebhaber SA, Cooke NE. Specification of unique Pit-1 activity in the hGH locus control region. Proc Natl Acad Sci U S A. 2002;99(18):11784-11789.

260.   Elefant F, Cooke NE, Liebhaber SA. Targeted recruitment of histone acetyltransferase activity to a locus control region. J Biol Chem. 2000;275(18):13827-13834.

261.   Ho Y, Elefant F, Cooke N, Liebhaber S. A defined locus control region determinant links chromatin domain acetylation with long-range gene activation. Mol Cell. 2002;9(2):291-302.

262.   Ho Y, Tadevosyan A, Liebhaber SA, Cooke NE. The juxtaposition of a promoter with a locus control region transcriptional domain activates gene expression. EMBO Rep. 2008;9(9):891-898.

263.   Gil-Puig C, Seoane S, Blanco M, Macia M, Garcia-Caballero T, Segura C, Perez-Fernandez R. Pit-1 is expressed in normal and tumorous human breast and regulates GH secretion and cell proliferation. Eur J Endocrinol. 2005;153(2):335-344.

264.   Frohman LA, Burek L, Stachura MA. Characterization of growth hormone of different molecular weights in rat, dog and human pituitaries. Endocrinology. 1972;91(1):262-269.

265.   Baumann G, Winter RJ, Shaw M. Circulating molecular variants of growth hormone in childhood. Pediatr Res. 1987;22(1):21-22.

266.   Baumann G, Stolar MW, Amburn K. Molecular forms of circulating growth hormone during spontaneous secretory episodes and in the basal state. J Clin Endocrinol Metab. 1985;60(6):1216-1220.

267.   Herington AC, Ymer S, Stevenson J. Identification and characterization of specific binding proteins for growth hormone in normal human sera. J Clin Invest. 1986;77(6):1817-1823.

268.   Leung DW, Spencer SA, Cachianes G, Hammonds RG, Collins C, Henzel WJ, Barnard R, Waters MJ, Wood WI. Growth hormone receptor and serum binding protein: purification, cloning and expression. Nature. 1987;330(6148):537-543.

269.   Zhang Y, Jiang J, Black RA, Baumann G, Frank SJ. Tumor necrosis factor-alpha converting enzyme (TACE) is a growth hormone binding protein (GHBP) sheddase: the metalloprotease TACE/ADAM-17 is critical for (PMA-induced) GH receptor proteolysis and GHBP generation. Endocrinology. 2000;141(12):4342-4348.

270.   Baumann G, Shaw MA. Plasma transport of the 20,000-dalton variant of human growth hormone (20K): evidence for a 20K-specific binding site. J Clin Endocrinol Metab. 1990;71(5):1339-1343.

271.   Ross RJ, Esposito N, Shen XY, Von Laue S, Chew SL, Dobson PR, Postel-Vinay MC, Finidori J. A short isoform of the human growth hormone receptor functions as a dominant negative inhibitor of the full-length receptor and generates large amounts of binding protein. Mol Endocrinol. 1997;11(3):265-273.

272.   Gossard F, Dihl F, Pelletier G, Dubois PM, Morel G. In situ hybridization to rat brain and pituitary gland of growth hormone cDNA. Neurosci Lett. 1987;79(3):251-256.

273.   Aberg ND, Brywe KG, Isgaard J. Aspects of growth hormone and insulin-like growth factor-I related to neuroprotection, regeneration, and functional plasticity in the adult brain. ScientificWorldJournal. 2006;6:53-80.

274.   Thorner MO, Perryman RL, Cronin MJ, Rogol AD, Draznin M, Johanson A, Vale W, Horvath E, Kovacs K. Somatotroph hyperplasia. Successful treatment of acromegaly by removal of a pancreatic islet tumor secreting a growth hormone-releasing factor. J Clin Invest. 1982;70(5):965-977.

275.   Mayo K, Vale W, Rivier J, Rosenfeld M, Evans R. Expression-cloning and sequence of a cDNA encoding human growth hormone-releasing factor. Nature. 1983;306(5938):86-88.

276.   Gubler U, Monahan J, Lomedico P, Bhatt R, Collier K, Hoffman B, Bohlen P, Esch F, Ling N, Zeytin F, Brazeau P, Poonian M, Gage L. Cloning and sequence analysis of cDNA for the precursor of human growth hormone-releasing factor, somatocrinin. Proc Natl Acad Sci U S A. 1983;80(14):4311-4314.

277.   Mayo K. Molecular cloning and expression of a pituitary-specific receptor for growth hormone-releasing hormone. Mol Endocrinol. 1992;6(10):1734-1744.

278.   Barinaga M, Yamonoto G, Rivier C, Vale W, Evans R, Rosenfeld M. Transcriptional regulation of growth hormone gene expression by growth hormone-releasing factor. Nature. 1983;306(5938):84-85.

279.   Fukata J, Diamond D, Martin J. Effects of rat growth hormone (rGH)-releasing factor and somatostatin on the release and synthesis of rGH in dispersed pituitary cells. Endocrinology. 1985;117(2):457-467.

280.   Campbell R, Scanes C. Evolution of the growth hormone-releasing factor (GRF) family of peptides. Growth Regul. 1992;2(4):175-191.

281.   Shen L, Pictet R, Rutter W. Human somatostatin I: sequence of the cDNA. Proc Natl Acad Sci U S A. 1982;79(15):4575-4579.

282.   Siler T, VandenBerg G, Yen S, Brazeau P, Vale W, Guillemin R. Inhibition of growth hormone release in humans by somatostatin. J Clin Endocrinol Metab. 1973;37(4):632-634.

283.   Brazeau P, Vale W, Burgus R, Ling N, Butcher M, Rivier J, Guillemin R. Hypothalamic polypeptide that inhibits the secretion of immunoreactive pituitary growth hormone. Science. 1973;179(68):77-79.

284.   Tannenbaum GS, Epelbaum J, Bowers CY. Interrelationship between the Novel Peptide Ghrelin and Somatostatin/Growth Hormone-Releasing Hormone in Regulation of Pulsatile Growth Hormone Secretion. Endocrinology. 2003;144(3):967-974.

285.   Broglio F, Koetsveld Pv P, Benso A, Gottero C, Prodam F, Papotti M, Muccioli G, Gauna C, Hofland L, Deghenghi R, Arvat E, Van Der Lely AJ, Ghigo E. Ghrelin secretion is inhibited by either somatostatin or cortistatin in humans. J Clin Endocrinol Metab. 2002;87(10):4829-4832.

286.   Norrelund H, Hansen TK, Orskov H, Hosoda H, Kojima M, Kangawa K, Weeke J, Moller N, Christiansen JS, Jorgensen JO. Ghrelin immunoreactivity in human plasma is suppressed by somatostatin. Clin Endocrinol (Oxf). 2002;57(4):539-546.

287.   Shimada M, Date Y, Mondal MS, Toshinai K, Shimbara T, Fukunaga K, Murakami N, Miyazato M, Kangawa K, Yoshimatsu H, Matsuo H, Nakazato M. Somatostatin suppresses ghrelin secretion from the rat stomach. Biochem Biophys Res Commun. 2003;302(3):520-525.

288.   Vale W, Rivier C, Brazeau P, Guillemin R. Effects of somatostatin on the secretion of thyrotropin and prolactin. Endocrinology. 1974;95(4):968-977.

289.   Siler TM, Yen SC, Vale W, Guillemin R. Inhibition by somatostatin on the release of TSH induced in man by thyrotropin-releasing factor. J Clin Endocrinol Metab. 1974;38(5):742-745.

290.   Liddle R. Physiology of somatostatin and its analogues. UpToDate version 14.3. Wellesley, MA, United States of America: UpToDate, Inc.; 2006.

291.   Patel Y, Greenwood M, Panetta R, Hukovic N, Grigorakis S, Robertson L, Srikant C. Molecular biology of somatostatin receptor subtypes. Metabolism. 1996;45(8 Suppl 1):31-38.

292.   Peineau S, Guimiot F, Csaba Z, Jacquier S, Fafouri A, Schwendimann L, de Roux N, Schulz S, Gressens P, Auvin S, Dournaud P. Somatostatin receptors type 2 and 5 expression and localization during human pituitary development. Endocrinology. 2014;155(1):33-39.

293.   Reisine T, Bell GI. Molecular biology of somatostatin receptors. Endocr Rev. 1995;16(4):427-442.

294.   Kojima M, Hosoda H, Date Y, Nakazato M, Matsuo H, Kangawa K. Ghrelin is a growth-hormone-releasing acylated peptide from stomach. Nature. 1999;402(6762):656-660.

295.   Howard AD, Feighner SD, Cully DF, Arena JP, Liberator PA, Rosenblum CI, Hamelin M, Hreniuk DL, Palyha OC, Anderson J, Paress PS, Diaz C, Chou M, Liu KK, McKee KK, Pong SS, Chaung LY, Elbrecht A, Dashkevicz M, Heavens R, Rigby M, Sirinathsinghji DJ, Dean DC, Melillo DG, Van der Ploeg LH, et al. A receptor in pituitary and hypothalamus that functions in growth hormone release. Science. 1996;273(5277):974-977.

296.   Gnanapavan S, Kola B, Bustin SA, Morris DG, McGee P, Fairclough P, Bhattacharya S, Carpenter R, Grossman AB, Korbonits M. The tissue distribution of the mRNA of ghrelin and subtypes of its receptor, GHS-R, in humans. J Clin Endocrinol Metab. 2002;87(6):2988.

297.   Chan CB, Cheng CH. Identification and functional characterization of two alternatively spliced growth hormone secretagogue receptor transcripts from the pituitary of black seabream Acanthopagrus schlegeli. Mol Cell Endocrinol. 2004;214(1-2):81-95.

298.   Hosoda H, Kojima M, Matsuo H, Kangawa K. Ghrelin and des-acyl ghrelin: two major forms of rat ghrelin peptide in gastrointestinal tissue. Biochem Biophys Res Commun. 2000;279(3):909-913.

299.   Yang J, Brown MS, Liang G, Grishin NV, Goldstein JL. Identification of the acyltransferase that octanoylates ghrelin, an appetite-stimulating peptide hormone. Cell. 2008;132(3):387-396.

300.   Lim CT, Kola B, Grossman A, Korbonits M. The expression of ghrelin O-acyltransferase (GOAT) in human tissues. Endocr J. 2011;58(8):707-710.

301.   Momany FA, Bowers CY, Reynolds GA, Chang D, Hong A, Newlander K. Design, synthesis, and biological activity of peptides which release growth hormone in vitro. Endocrinology. 1981;108(1):31-39.

302.   Beaumont NJ, Skinner VO, Tan TM, Ramesh BS, Byrne DJ, MacColl GS, Keen JN, Bouloux PM, Mikhailidis DP, Bruckdorfer KR, Vanderpump MP, Srai KS. Ghrelin Can Bind to a Species of High Density Lipoprotein Associated with Paraoxonase. J Biol Chem. 2003;278(11):8877-8880.

303.   De Vriese C, Gregoire F, Lema-Kisoka R, Waelbroeck M, Robberecht P, Delporte C. Ghrelin degradation by serum and tissue homogenates: identification of the cleavage sites. Endocrinology. 2004;145(11):4997-5005.

304.   Korbonits M, Bustin SA, Kojima M, Jordan S, Adams EF, Lowe DG, Kangawa K, Grossman AB. The expression of the growth hormone secretagogue receptor ligand ghrelin in normal and abnormal human pituitary and other neuroendocrine tumors. J Clin Endocrinol Metab. 2001;86(2):881-887.

305.   Caminos JE, Nogueiras R, Blanco M, Seoane LM, Bravo S, Alvarez CV, Garcia-Caballero T, Casanueva FF, Dieguez C. Cellular distribution and regulation of ghrelin messenger ribonucleic acid in the rat pituitary gland. Endocrinology. 2003;144(11):5089-5097.

306.   Kojima M, Hosoda H, Date Y, Nakazato M, Matsuo H, Kangawa K. Ghrelin is a growth-hormone-releasing acylated peptide from stomach. Nature. 1999;402(6762):656-660.

307.   Muccioli G, Tschop M, Papotti M, Deghenghi R, Heiman M, Ghigo E. Neuroendocrine and peripheral activities of ghrelin: implications in metabolism and obesity. Eur J Pharmacol. 2002;440(2-3):235-254.

308.   Wren A, Small C, Abbott C, Dhillo W, Seal L, Cohen M, Batterham R, Taheri S, Stanley S, Ghatei M, Bloom S. Ghrelin causes hyperphagia and obesity in rats. Diabetes. 2001;50(11):2540-2547.

309.   Wren A, Seal L, Cohen M, Brynes A, Frost G, Murphy K, Dhillo W, Ghatei M, Bloom S. Ghrelin enhances appetite and increases food intake in humans. J Clin Endocrinol Metab. 2001;86(12):5992.

310.   Date Y, Nakazato M, Hashiguchi S, Dezaki K, Mondal M, Hosoda H, Kojima M, Kangawa K, Arima T, Matsuo H, Yada T, Matsukura S. Ghrelin is present in pancreatic alpha-cells of humans and rats and stimulates insulin secretion. Diabetes. 2002;51(1):124-129.

311.   Takaya K, Ariyasu H, Kanamoto N, Iwakura H, Yoshimoto A, Harada M, Mori K, Komatsu Y, Usui T, Shimatsu A, Ogawa Y, Hosoda K, Akamizu T, Kojima M, Kangawa K, Nakao K. Ghrelin strongly stimulates growth hormone release in humans. J Clin Endocrinol Metab. 2000;85(12):4908-4911.

312.   Sun Y, Ahmed S, Smith RG. Deletion of ghrelin impairs neither growth nor appetite. Mol Cell Biol. 2003;23(22):7973-7981.

313.   Hassouna R, Zizzari P, Tomasetto C, Veldhuis JD, Fiquet O, Labarthe A, Cognet J, Steyn F, Chen C, Epelbaum J, Tolle V. An early reduction in GH peak amplitude in preproghrelin-deficient male mice has a minor impact on linear growth. Endocrinology. 2014;155(9):3561-3571.

314.   Wortley KE, Anderson KD, Garcia K, Murray JD, Malinova L, Liu R, Moncrieffe M, Thabet K, Cox HJ, Yancopoulos GD, Wiegand SJ, Sleeman MW. Genetic deletion of ghrelin does not decrease food intake but influences metabolic fuel preference. Proc Natl Acad Sci U S A. 2004;101(21):8227-8232.

315.   Sun Y, Wang P, Zheng H, Smith RG. Ghrelin stimulation of growth hormone release and appetite is mediated through the growth hormone secretagogue receptor. Proc Natl Acad Sci U S A. 2004;101(13):4679-4684.

316.   Xie TY, Ngo ST, Veldhuis JD, Jeffery PL, Chopin LK, Tschop M, Waters MJ, Tolle V, Epelbaum J, Chen C, Steyn FJ. Effect of Deletion of Ghrelin-O-Acyltransferase on the Pulsatile Release of Growth Hormone in Mice. J Neuroendocrinol. 2015;27(12):872-886.

317.   Baldanzi G, Filigheddu N, Cutrupi S, Catapano F, Bonissoni S, Fubini A, Malan D, Baj G, Granata R, Broglio F, Papotti M, Surico N, Bussolino F, Isgaard J, Deghenghi R, Sinigaglia F, Prat M, Muccioli G, Ghigo E, Graziani A. Ghrelin and des-acyl ghrelin inhibit cell death in cardiomyocytes and endothelial cells through ERK1/2 and PI 3-kinase/AKT. J Cell Biol. 2002;159(6):1029-1037.

318.   Cassoni P, Ghe C, Marrocco T, Tarabra E, Allia E, Catapano F, Deghenghi R, Ghigo E, Papotti M, Muccioli G. Expression of ghrelin and biological activity of specific receptors for ghrelin and des-acyl ghrelin in human prostate neoplasms and related cell lines. Eur J Endocrinol. 2004;150(2):173-184.

319.   Muccioli G, Pons N, Ghe C, Catapano F, Granata R, Ghigo E. Ghrelin and des-acyl ghrelin both inhibit isoproterenol-induced lipolysis in rat adipocytes via a non-type 1a growth hormone secretagogue receptor. Eur J Pharmacol. 2004;498(1-3):27-35.

320.   Tsubota Y, Owada-Makabe K, Yukawa K, Maeda M. Hypotensive effect of des-acyl ghrelin at nucleus tractus solitarii of rat. Neuroreport. 2005;16(2):163-166.

321.   Asakawa A, Inui A, Fujimiya M, Sakamaki R, Shinfuku N, Ueta Y, Meguid MM, Kasuga M. Stomach regulates energy balance via acylated ghrelin and desacyl ghrelin. Gut. 2005;54(1):18-24.

322.   Neary NM, Druce MR, Small CJ, Bloom SR. Acylated ghrelin stimulates food intake in the fed and fasted states but desacylated ghrelin has no effect. Gut. 2006;55(1):135.

323.   Chen CY, Inui A, Asakawa A, Fujino K, Kato I, Chen CC, Ueno N, Fujimiya M. Des-acyl ghrelin acts by CRF type 2 receptors to disrupt fasted stomach motility in conscious rats. Gastroenterology. 2005;129(1):8-25.

324.   Popovic V, Damjanovic S, Micic D, Djurovic M, Dieguez C, Casanueva FF. Blocked growth hormone-releasing peptide (GHRP-6)-induced GH secretion and absence of the synergic action of GHRP-6 plus GH-releasing hormone in patients with hypothalamopituitary disconnection: evidence that GHRP-6 main action is exerted at the hypothalamic level. J Clin Endocrinol Metab. 1995;80(3):942-947.

325.   Seoane LM, Tovar S, Baldelli R, Arvat E, Ghigo E, Casanueva FF, Dieguez C. Ghrelin elicits a marked stimulatory effect on GH secretion in freely-moving rats. Eur J Endocrinol. 2000;143(5):R7-9.

326.   Bowers CY, Sartor AO, Reynolds GA, Badger TM. On the actions of the growth hormone-releasing hexapeptide, GHRP. Endocrinology. 1991;128(4):2027-2035.

327.   Ge X, Yang H, Bednarek MA, Galon-Tilleman H, Chen P, Chen M, Lichtman JS, Wang Y, Dalmas O, Yin Y, Tian H, Jermutus L, Grimsby J, Rondinone CM, Konkar A, Kaplan DD. LEAP2 Is an Endogenous Antagonist of the Ghrelin Receptor. Cell Metab. 2018;27(2):461-469 e466.

328.   Mani BK, Puzziferri N, He Z, Rodriguez JA, Osborne-Lawrence S, Metzger NP, Chhina N, Gaylinn B, Thorner MO, Thomas EL, Bell JD, Williams KW, Goldstone AP, Zigman JM. LEAP2 changes with body mass and food intake in humans and mice. J Clin Invest. 2019;129(9):3909-3923.

329.   Casanueva FF, Burguera B, Muruais C, Dieguez C. Acute administration of corticoids: a new and peculiar stimulus of growth hormone secretion in man. J Clin Endocrinol Metab. 1990;70(1):234-237.

330.   Burguera B, Muruais C, Penalva A, Dieguez C, Casanueva FF. Dual and selective actions of glucocorticoids upon basal and stimulated growth hormone release in man. Neuroendocrinology. 1990;51(1):51-58.

331.   Strickland AL, Underwood LE, Voina SJ, French FS, Van Wyk JJ. Growth retardation in Cushing's syndrome. Am J Dis Child. 1972;123(3):207-213.

332.   Giustina A, Wehrenberg WB. The role of glucocorticoids in the regulation of Growth Hormone secretion: mechanisms and clinical significance. Trends Endocrinol Metab. 1992;3(8):306-311.

333.   Veldhuis JD, Roemmich JN, Richmond EJ, Bowers CY. Somatotropic and gonadotropic axes linkages in infancy, childhood, and the puberty-adult transition. Endocr Rev. 2006;27(2):101-140.

334.   Kok P, Paulo RC, Cosma M, Mielke KL, Miles JM, Bowers CY, Veldhuis JD. Estrogen supplementation selectively enhances hypothalamo-pituitary sensitivity to ghrelin in postmenopausal women. J Clin Endocrinol Metab. 2008;93(10):4020-4026.

335.   Leung KC, Johannsson G, Leong GM, Ho KK. Estrogen regulation of growth hormone action. Endocr Rev. 2004;25(5):693-721.

336.   Amit Tanna RM, Harinderjeet Sandhu, Jake Powrie, Stephen Thomas, Anna Brackenridge, Louise Breen & Paul Carroll. Oral and transdermal oestrogen treatments have differing effects on GH sensitivity in hypopituitary women receiving GH replacement. Endocrine Abstract. 2010;21 P286

337.   Weissberger AJ, Ho KK, Lazarus L. Contrasting effects of oral and transdermal routes of estrogen replacement therapy on 24-hour growth hormone (GH) secretion, insulin-like growth factor I, and GH-binding protein in postmenopausal women. J Clin Endocrinol Metab. 1991;72(2):374-381.

338.   Isotton AL, Wender MC, Casagrande A, Rollin G, Czepielewski MA. Effects of oral and transdermal estrogen on IGF1, IGFBP3, IGFBP1, serum lipids, and glucose in patients with hypopituitarism during GH treatment: a randomized study. Eur J Endocrinol. 2014;166(2):207-213.

339.   Zhang Y, Proenca R, Maffei M, Barone M, Leopold L, Friedman JM. Positional cloning of the mouse obese gene and its human homologue. Nature. 1994;372(6505):425-432.

340.   Pelleymounter MA, Cullen MJ, Baker MB, Hecht R, Winters D, Boone T, Collins F. Effects of the obese gene product on body weight regulation in ob/ob mice. Science. 1995;269(5223):540-543.

341.   Schwartz MW, Woods SC, Porte D, Jr., Seeley RJ, Baskin DG. Central nervous system control of food intake. Nature. 2000;404(6778):661-671.

342.   Jin L, Burguera BG, Couce ME, Scheithauer BW, Lamsan J, Eberhardt NL, Kulig E, Lloyd RV. Leptin and leptin receptor expression in normal and neoplastic human pituitary: evidence of a regulatory role for leptin on pituitary cell proliferation. J Clin Endocrinol Metab. 1999;84(8):2903-2911.

343.   Korbonits M, Chitnis MM, Gueorguiev M, Norman D, Rosenfelder N, Suliman M, Jones TH, Noonan K, Fabbri A, Besser GM, Burrin JM, Grossman AB. The release of leptin and its effect on hormone release from human pituitary adenomas. Clin Endocrinol (Oxf). 2001;54(6):781-789.

344.   Kristiansen MT, Clausen LR, Nielsen S, Blaabjerg O, Ledet T, Rasmussen LM, Jorgensen JO. Expression of leptin receptor isoforms and effects of leptin on the proliferation and hormonal secretion in human pituitary adenomas. Horm Res. 2004;62(3):129-136.

345.   Saleri R, Giustina A, Tamanini C, Valle D, Burattin A, Wehrenberg WB, Baratta M. Leptin stimulates growth hormone secretion via a direct pituitary effect combined with a decreased somatostatin tone in a median eminence-pituitary perifusion study. Neuroendocrinology. 2004;79(4):221-228.

346.   Tannenbaum GS, Lapointe M, Gurd W, Finkelstein JA. Mechanisms of impaired growth hormone secretion in genetically obese Zucker rats: roles of growth hormone-releasing factor and somatostatin. Endocrinology. 1990;127(6):3087-3095.

347.   Ozata M, Dieguez C, Casanueva FF. The inhibition of growth hormone secretion presented in obesity is not mediated by the high leptin levels: a study in human leptin deficiency patients. J Clin Endocrinol Metab. 2003;88(1):312-316.

348.   Sun Y, Bak B, Schoenmakers N, van Trotsenburg AS, Oostdijk W, Voshol P, Cambridge E, White JK, le Tissier P, Gharavy SN, Martinez-Barbera JP, Stokvis-Brantsma WH, Vulsma T, Kempers MJ, Persani L, Campi I, Bonomi M, Beck-Peccoz P, Zhu H, Davis TM, Hokken-Koelega AC, Del Blanco DG, Rangasami JJ, Ruivenkamp CA, Laros JF, Kriek M, Kant SG, Bosch CA, Biermasz NR, Appelman-Dijkstra NM, Corssmit EP, Hovens GC, Pereira AM, den Dunnen JT, Wade MG, Breuning MH, Hennekam RC, Chatterjee K, Dattani MT, Wit JM, Bernard DJ. Loss-of-function mutations in IGSF1 cause an X-linked syndrome of central hypothyroidism and testicular enlargement. Nat Genet. 2012;44(12):1375-1381.

349.   Joustra SD, Roelfsema F, Endert E, Ballieux BE, van Trotsenburg AS, Fliers E, Corssmit EP, Bernard DJ, Oostdijk W, Wit JM, Pereira AM, Biermasz NR. Pituitary Hormone Secretion Profiles in IGSF1 Deficiency Syndrome. Neuroendocrinology. 2016;103(3-4):408-416.

350.   Joustra SD, Roelfsema F, van Trotsenburg ASP, Schneider HJ, Kosilek RP, Kroon HM, Logan JG, Butterfield NC, Zhou X, Toufaily C, Bak B, Turgeon MO, Brule E, Steyn FJ, Gurnell M, Koulouri O, Le Tissier P, Fontanaud P, Duncan Bassett JH, Williams GR, Oostdijk W, Wit JM, Pereira AM, Biermasz NR, Bernard DJ, Schoenmakers N. IGSF1 Deficiency Results in Human and Murine Somatotrope Neurosecretory Hyperfunction. J Clin Endocrinol Metab. 2020;105(3).

351.   Gutierrez-Pascual E, Martinez-Fuentes AJ, Pinilla L, Tena-Sempere M, Malagon MM, Castano JP. Direct pituitary effects of kisspeptin: activation of gonadotrophs and somatotrophs and stimulation of luteinising hormone and growth hormone secretion. J Neuroendocrinol. 2007;19(7):521-530.

352.   Kadokawa H, Suzuki S, Hashizume T. Kisspeptin-10 stimulates the secretion of growth hormone and prolactin directly from cultured bovine anterior pituitary cells. Anim Reprod Sci. 2008;105(3-4):404-408.

353.   Whitlock BK, Daniel JA, Wilborn RR, Maxwell HS, Steele BP, Sartin JL. Interaction of kisspeptin and the somatotropic axis. Neuroendocrinology. 2010;92(3):178-188.

354.   Jayasena CN, Comninos AN, Narayanaswamy S, Bhalla S, Abbara A, Ganiyu-Dada Z, Busbridge M, Ghatei MA, Bloom SR, Dhillo WS. Acute and chronic effects of kisspeptin-54 administration on GH, prolactin and TSH secretion in healthy women. Clin Endocrinol (Oxf). 2014;81(6):891-898.

355.   Massara F, Camanni F. Effect of various adrenergic receptor stimulating and blocking agents on human growth hormone secretion. J Endocrinol. 1972;54(2):195-206.

356.   Chihara K, Minamitani N, Kaji H, Kodama H, Kita T, Fujita T. Noradrenergic modulation of human pancreatic growth hormone-releasing factor (hpGHRF1-44)-induced growth hormone release in conscious male rabbits: involvement of endogenous somatostatin. Endocrinology. 1984;114(4):1402-1406.

357.   Milner RD, Burns EC. Investigation of suspected growth hormone deficiency. On behalf of the Health Services Human Growth Hormone Committee. Arch Dis Child. 1982;57(12):944-947.

358.   Grossman A, Weerasuriya K, Al-Damluji S, Turner P, Besser GM. Alpha 2-adrenoceptor agonists stimulate growth hormone secretion but have no acute effects on plasma cortisol under basal conditions. Horm Res. 1987;25(2):65-71.

359.   Masala A, Delitala G, Alagna S, Devilla L. Effect of pimozide on levodopa-induced growth hormone release in man. Clin Endocrinol (Oxf). 1977;7(3):253-256.

360.   Cammani F, Massara F. Phentolamine inhibition of human growth hormone secretion induced by L-DOPA. Horm Metab Res. 1972;4(2):128.

361.   Giustina A, Veldhuis JD. Pathophysiology of the neuroregulation of growth hormone secretion in experimental animals and the human. Endocr Rev. 1998;19(6):717-797.

362.   Friend K, Iranmanesh A, Login IS, Veldhuis JD. Pyridostigmine treatment selectively amplifies the mass of GH secreted per burst without altering GH burst frequency, half-life, basal GH secretion or the orderliness of GH release. Eur J Endocrinol. 1997;137(4):377-386.

363.   Taylor BJ, Smith PJ, Brook CG. Inhibition of physiological growth hormone secretion by atropine. Clin Endocrinol (Oxf). 1985;22(4):497-501.

364.   Massara F, Ghigo E, Demislis K, Tangolo D, Mazza E, Locatelli V, Muller EE, Molinatti GM, Camanni F. Cholinergic involvement in the growth hormone releasing hormone-induced growth hormone release: studies in normal and acromegalic subjects. Neuroendocrinology. 1986;43(6):670-675.

365.   Wehrenberg WB, Wiviott SD, Voltz DM, Giustina A. Pyridostigmine-mediated growth hormone release: evidence for somatostatin involvement. Endocrinology. 1992;130(3):1445-1450.

366.   Vance ML, Kaiser DL, Frohman LA, Rivier J, Vale WW, Thorner MO. Role of dopamine in the regulation of growth hormone secretion: dopamine and bromocriptine augment growth hormone (GH)-releasing hormone-stimulated GH secretion in normal man. J Clin Endocrinol Metab. 1987;64(6):1136-1141.

367.   Grossman A. Brain opiates and neuroendocrine function. Clin Endocrinol Metab. 1983;12(3):725-746.

368.   Moretti C, Fabbri A, Gnessi L, Cappa M, Calzolari A, Fraioli F, Grossman A, Besser GM. Naloxone inhibits exercise-induced release of PRL and GH in athletes. Clin Endocrinol (Oxf). 1983;18(2):135-138.

369.   Miki N, Ono M, Shizume K. Evidence that opiatergic and alpha-adrenergic mechanisms stimulate rat growth hormone release via growth hormone-releasing factor (GRF). Endocrinology. 1984;114(5):1950-1952.

370.   Olsen J, Peroski M, Kiczek M, Grignol G, Merchenthaler I, Dudas B. Intimate associations between the endogenous opiate systems and the growth hormone-releasing hormone system in the human hypothalamus. Neuroscience. 2014;258:238-245.

371.   Dudas B, Merchenthaler I. Topography and associations of leu-enkephalin and luteinizing hormone-releasing hormone neuronal systems in the human diencephalon. J Clin Endocrinol Metab. 2003;88(4):1842-1848.

372.   Delitala G, Tomasi PA, Palermo M, Ross RJ, Grossman A, Besser GM. Opioids stimulate growth hormone (GH) release in man independently of GH-releasing hormone. J Clin Endocrinol Metab. 1989;69(2):356-358.

373.   Wenger T, Toth BE, Martin BR. Effects of anandamide (endogen cannabinoid) on anterior pituitary hormone secretion in adult ovariectomized rats. Life Sci. 1995;56(23-24):2057-2063.

374.   Rettori V, Wenger T, Snyder G, Dalterio S, McCann SM. Hypothalamic action of delta-9-tetrahydrocannabinol to inhibit the release of prolactin and growth hormone in the rat. Neuroendocrinology. 1988;47(6):498-503.

375.   Rettori V, Aguila MC, Gimeno MF, Franchi AM, McCann SM. In vitro effect of delta 9-tetrahydrocannabinol to stimulate somatostatin release and block that of luteinizing hormone-releasing hormone by suppression of the release of prostaglandin E2. Proc Natl Acad Sci U S A. 1990;87(24):10063-10066.

376.   Zbucki RL, Sawicki B, Hryniewicz A, Winnicka MM. Cannabinoids enhance gastric X/A-like cells activity. Folia Histochem Cytobiol. 2008;46(2):219-224.

377.   Senin LL, Al-Massadi O, Folgueira C, Castelao C, Pardo M, Barja-Fernandez S, Roca-Rivada A, Amil M, Crujeiras AB, Garcia-Caballero T, Gabellieri E, Leis R, Dieguez C, Pagotto U, Casanueva FF, Seoane LM. The gastric CB1 receptor modulates ghrelin production through the mTOR pathway to regulate food intake. PLoS One. 2013;8(11):e80339.

378.   Kola B, Farkas I, Christ-Crain M, Wittmann G, Lolli F, Amin F, Harvey-White J, Liposits Z, Kunos G, Grossman AB, Fekete C, Korbonits M. The orexigenic effect of ghrelin is mediated through central activation of the endogenous cannabinoid system. PLoS One. 2008;3(3):e1797.

379.   Kola B, Wittman G, Bodnar I, Amin F, Lim CT, Olah M, Christ-Crain M, Lolli F, van Thuijl H, Leontiou CA, Fuzesi T, Dalino P, Isidori AM, Harvey-White J, Kunos G, Nagy GM, Grossman AB, Fekete C, Korbonits M. The CB1 receptor mediates the peripheral effects of ghrelin on AMPK activity but not on growth hormone release. FASEB J. 2013;27(12):5112-5121.

380.   Lim CT, Kola B, Korbonits M. The ghrelin/GOAT/GHS-R system and energy metabolism. Rev Endocr Metab Disord. 2011;12(3):173-186.

381.   Lim CT, Kola B, Feltrin D, Perez-Tilve D, Tschop MH, Grossman AB, Korbonits M. Ghrelin and cannabinoids require the ghrelin receptor to affect cellular energy metabolism. Mol Cell Endocrinol. 2013;365(2):303-308.

382.   Giustina A, Licini M, Schettino M, Doga M, Pizzocolo G, Negro-Vilar A. Physiological role of galanin in the regulation of anterior pituitary function in humans. Am J Physiol. 1994;266(1 Pt 1):E57-61.

383.   Cantalamessa L, Catania A, Reschini E, Peracchi M. Inhibitory effect of calcitonin on growth hormone and insulin secretion in man. Metabolism. 1978;27(8):987-992.

384.   Petralito A, Lunetta M, Liuzzo A, Mangiafico RA, Fiore CE. Effects of salmon calcitonin on insulin-induced growth hormone release in man. Horm Metab Res. 1979;11(11):641-643.

385.   Harfstrand A, Eneroth P, Agnati L, Fuxe K. Further studies on the effects of central administration of neuropeptide Y on neuroendocrine function in the male rat: relationship to hypothalamic catecholamines. Regul Pept. 1987;17(3):167-179.

386.   Rettori V, Milenkovic L, Aguila MC, McCann SM. Physiologically significant effect of neuropeptide Y to suppress growth hormone release by stimulating somatostatin discharge. Endocrinology. 1990;126(5):2296-2301.

387.   Catzeflis C, Pierroz DD, Rohner-Jeanrenaud F, Rivier JE, Sizonenko PC, Aubert ML. Neuropeptide Y administered chronically into the lateral ventricle profoundly inhibits both the gonadotropic and the somatotropic axis in intact adult female rats. Endocrinology. 1993;132(1):224-234.

388.   Adams EF, Venetikou MS, Woods CA, Lacoumenta S, Burrin JM. Neuropeptide Y directly inhibits growth hormone secretion by human pituitary somatotropic tumours. Acta Endocrinol (Copenh). 1987;115(1):149-154.

389.   Korbonits M, Little JA, Forsling ML, Tringali G, Costa A, Navarra P, Trainer PJ, Grossman AB. The effect of growth hormone secretagogues and neuropeptide Y on hypothalamic hormone release from acute rat hypothalamic explants. J Neuroendocrinol. 1999;11(7):521-528.

390.   Watanobe H, Tamura T. Stimulation by neuropeptide Y of growth hormone secretion in prolactinoma in vivo. Neuropeptides. 1996;30(5):429-432.

391.   Antonijevic IA, Murck H, Bohlhalter S, Frieboes RM, Holsboer F, Steiger A. Neuropeptide Y promotes sleep and inhibits ACTH and cortisol release in young men. Neuropharmacology. 2000;39(8):1474-1481.

392.   Miyata A, Arimura A, Dahl RR, Minamino N, Uehara A, Jiang L, Culler MD, Coy DH. Isolation of a novel 38 residue-hypothalamic polypeptide which stimulates adenylate cyclase in pituitary cells. Biochem Biophys Res Commun. 1989;164(1):567-574.

393.   Goth MI, Lyons CE, Canny BJ, Thorner MO. Pituitary adenylate cyclase activating polypeptide, growth hormone (GH)-releasing peptide and GH-releasing hormone stimulate GH release through distinct pituitary receptors. Endocrinology. 1992;130(2):939-944.

394.   Jarry H, Leonhardt S, Schmidt WE, Creutzfeldt W, Wuttke W. Contrasting effects of pituitary adenylate cyclase activating polypeptide (PACAP) on in vivo and in vitro prolactin and growth hormone release in male rats. Life Sci. 1992;51(11):823-830.

395.   Propato-Mussafiri R, Kanse SM, Ghatei MA, Bloom SR. Pituitary adenylate cyclase-activating polypeptide releases 7B2, adrenocorticotrophin, growth hormone and prolactin from the mouse and rat clonal pituitary cell lines AtT-20 and GH3. J Endocrinol. 1992;132(1):107-113.

396.   Chiodera P, Volpi R, Capretti L, Caffarri G, Magotti MG, Coiro V. Effects of intravenously infused pituitary adenylate cyclase-activating polypeptide on adenohypophyseal Hormone secretion in normal men. Neuroendocrinology. 1996;64(3):242-246.

397.   Shahmoon S, Rubinfeld H, Wolf I, Cohen ZR, Hadani M, Shimon I, Rubinek T. The aging suppressor klotho: a potential regulator of growth hormone secretion. Am J Physiol Endocrinol Metab. 2014;307(3):E326-334.

398.   Abboud D, Daly AF, Dupuis N, Bahri MA, Inoue A, Chevigne A, Ectors F, Plenevaux A, Pirotte B, Beckers A, Hanson J. GPR101 drives growth hormone hypersecretion and gigantism in mice via constitutive activation of Gs and Gq/11. Nat Commun. 2020;11(1):4752.

399.   Iacovazzo D, Caswell R, Bunce B, Jose S, Yuan B, Hernandez-Ramirez LC, Kapur S, Caimari F, Evanson J, Ferrau F, Dang MN, Gabrovska P, Larkin SJ, Ansorge O, Rodd C, Vance ML, Ramirez-Renteria C, Mercado M, Goldstone AP, Buchfelder M, Burren CP, Gurlek A, Dutta P, Choong CS, Cheetham T, Trivellin G, Stratakis CA, Lopes MB, Grossman AB, Trouillas J, Lupski JR, Ellard S, Sampson JR, Roncaroli F, Korbonits M. Germline or somatic GPR101 duplication leads to X-linked acrogigantism: a clinico-pathological and genetic study. Acta Neuropathol Commun. 2016;4(1):56.

400.   Iacovazzo D, Korbonits M. Gigantism: X-linked acrogigantism and GPR101 mutations. Growth Horm IGF Res. 2016;30-31:64-69.

401.   Beckers A, Lodish MB, Trivellin G, Rostomyan L, Lee M, Faucz FR, Yuan B, Choong CS, Caberg JH, Verrua E, Naves LA, Cheetham TD, Young J, Lysy PA, Petrossians P, Cotterill A, Shah NS, Metzger D, Castermans E, Ambrosio MR, Villa C, Strebkova N, Mazerkina N, Gaillard S, Barra GB, Casulari LA, Neggers SJ, Salvatori R, Jaffrain-Rea ML, Zacharin M, Santamaria BL, Zacharieva S, Lim EM, Mantovani G, Zatelli MC, Collins MT, Bonneville JF, Quezado M, Chittiboina P, Oldfield EH, Bours V, Liu P, W WdH, Pellegata N, Lupski JR, Daly AF, Stratakis CA. X-linked acrogigantism syndrome: clinical profile and therapeutic responses. Endocr Relat Cancer. 2015;22(3):353-367.

402.   Trivellin G, Daly AF, Faucz FR, Yuan B, Rostomyan L, Larco DO, Schernthaner-Reiter MH, Szarek E, Leal LF, Caberg JH, Castermans E, Villa C, Dimopoulos A, Chittiboina P, Xekouki P, Shah N, Metzger D, Lysy PA, Ferrante E, Strebkova N, Mazerkina N, Zatelli MC, Lodish M, Horvath A, de Alexandre RB, Manning AD, Levy I, Keil MF, Sierra Mde L, Palmeira L, Coppieters W, Georges M, Naves LA, Jamar M, Bours V, Wu TJ, Choong CS, Bertherat J, Chanson P, Kamenicky P, Farrell WE, Barlier A, Quezado M, Bjelobaba I, Stojilkovic SS, Wess J, Costanzi S, Liu P, Lupski JR, Beckers A, Stratakis CA. Gigantism and acromegaly due to Xq26 microduplications and GPR101 mutation. N Engl J Med. 2014;371(25):2363-2374.

403.   Peterfreund RA, Vale WW. Somatostatin analogs inhibit somatostatin secretion from cultured hypothalamus cells. Neuroendocrinology. 1984;39(5):397-402.

404.   Aguila MC, McCann SM. The influence of hGRF, CRF, TRH and LHRH on SRIF release from median eminence fragments. Brain Res. 1985;348(1):180-182.

405.   Sheppard MC, Kronheim S, Pimstone BL. Stimulation by growth hormone of somatostatin release from the rat hypothalamus in vitro. Clin Endocrinol (Oxf). 1978;9(6):583-586.

406.   Ross RJ, Tsagarakis S, Grossman A, Nhagafoong L, Touzel RJ, Rees LH, Besser GM. GH feedback occurs through modulation of hypothalamic somatostatin under cholinergic control: studies with pyridostigmine and GHRH. Clin Endocrinol (Oxf). 1987;27(6):727-733.

407.   Aguila MC, McCann SM. Growth hormone increases somatostatin release and messenger ribonucleic acid levels in the rat hypothalamus. Brain Res. 1993;623(1):89-94.

408.   Qi X, Reed J, Englander EW, Chandrashekar V, Bartke A, Greeley GH, Jr. Evidence that growth hormone exerts a feedback effect on stomach ghrelin production and secretion. Exp Biol Med (Maywood). 2003;228(9):1028-1032.

409.   Goldenberg N, Barkan A. Factors regulating growth hormone secretion in humans. Endocrinol Metab Clin North Am. 2007;36(1):37-55.

410.   Berelowitz M, Szabo M, Frohman LA, Firestone S, Chu L, Hintz RL. Somatomedin-C mediates growth hormone negative feedback by effects on both the hypothalamus and the pituitary. Science. 1981;212(4500):1279-1281.

411.   Yamashita S, Melmed S. Insulin-like growth factor I action on rat anterior pituitary cells: suppression of growth hormone secretion and messenger ribonucleic acid levels. Endocrinology. 1986;118(1):176-182.

412.   Eden S, Bolle P, Modigh K. Monoaminergic control of episodic growth hormone secretion in the rat: effects of reserpine, alpha-methyl-p-tyrosine, p-chlorophenylalanine, and haloperidol. Endocrinology. 1979;105(2):523-529.

413.   Iranmanesh A, Grisso B, Veldhuis JD. Low basal and persistent pulsatile growth hormone secretion are revealed in normal and hyposomatotropic men studied with a new ultrasensitive chemiluminescence assay. J Clin Endocrinol Metab. 1994;78(3):526-535.

414.   Toogood AA, Nass RM, Pezzoli SS, O'Neill PA, Thorner MO, Shalet SM. Preservation of growth hormone pulsatility despite pituitary pathology, surgery, and irradiation. J Clin Endocrinol Metab. 1997;82(7):2215-2221.

415.   Surya S, Symons K, Rothman E, Barkan AL. Complex rhythmicity of growth hormone secretion in humans. Pituitary. 2006;9(2):121-125.

416.   Tannenbaum GS, Painson JC, Lengyel AM, Brazeau P. Paradoxical enhancement of pituitary growth hormone (GH) responsiveness to GH-releasing factor in the face of high somatostatin tone. Endocrinology. 1989;124(3):1380-1388.

417.   Plotsky PM, Vale W. Patterns of growth hormone-releasing factor and somatostatin secretion into the hypophysial-portal circulation of the rat. Science. 1985;230(4724):461-463.

418.   Cataldi M, Magnan E, Guillaume V, Dutour A, Conte-Devolx B, Lombardi G, Oliver C. Relationship between hypophyseal portal GHRH and somatostatin and peripheral GH levels in the conscious sheep. J Endocrinol Invest. 1994;17(9):717-722.

419.   Vance ML, Kaiser DL, Martha PM, Jr., Furlanetto R, Rivier J, Vale W, Thorner MO. Lack of in vivo somatotroph desensitization or depletion after 14 days of continuous growth hormone (GH)-releasing hormone administration in normal men and a GH-deficient boy. J Clin Endocrinol Metab. 1989;68(1):22-28.

420.   Roelfsema F, Biermasz NR, Veldman RG, Veldhuis JD, Frolich M, Stokvis-Brantsma WH, Wit JM. Growth hormone (GH) secretion in patients with an inactivating defect of the GH-releasing hormone (GHRH) receptor is pulsatile: evidence for a role for non-GHRH inputs into the generation of GH pulses. J Clin Endocrinol Metab. 2001;86(6):2459-2464.

421.   van den Berg G, Veldhuis JD, Frolich M, Roelfsema F. An amplitude-specific divergence in the pulsatile mode of growth hormone (GH) secretion underlies the gender difference in mean GH concentrations in men and premenopausal women. J Clin Endocrinol Metab. 1996;81(7):2460-2467.

422.   Chapman IM, Hartman ML, Straume M, Johnson ML, Veldhuis JD, Thorner MO. Enhanced sensitivity growth hormone (GH) chemiluminescence assay reveals lower postglucose nadir GH concentrations in men than women. J Clin Endocrinol Metab. 1994;78(6):1312-1319.

423.   Cordoba-Chacon J, Gahete MD, Castano JP, Kineman RD, Luque RM. Somatostatin and its receptors contribute in a tissue-specific manner to the sex-dependent metabolic (fed/fasting) control of growth hormone axis in mice. Am J Physiol Endocrinol Metab. 2011;300(1):E46-54.

424.   Udy GB, Towers RP, Snell RG, Wilkins RJ, Park SH, Ram PA, Waxman DJ, Davey HW. Requirement of STAT5b for sexual dimorphism of body growth rates and liver gene expression. Proc Natl Acad Sci U S A. 1997;94(14):7239-7244.

425.   Zadik Z, Chalew SA, McCarter RJ, Jr., Meistas M, Kowarski AA. The influence of age on the 24-hour integrated concentration of growth hormone in normal individuals. J Clin Endocrinol Metab. 1985;60(3):513-516.

426.   Rudman D, Feller AG, Nagraj HS, Gergans GA, Lalitha PY, Goldberg AF, Schlenker RA, Cohn L, Rudman IW, Mattson DE. Effects of human growth hormone in men over 60 years old. N Engl J Med. 1990;323(1):1-6.

427.   Fontana L, Partridge L, Longo VD. Extending healthy life span--from yeast to humans. Science. 2010;328(5976):321-326.

428.   Junnila RK, List EO, Berryman DE, Murrey JW, Kopchick JJ. The GH/IGF-1 axis in ageing and longevity. Nat Rev Endocrinol. 2013;9(6):366-376.

429.   Nass R, Farhy LS, Liu J, Pezzoli SS, Johnson ML, Gaylinn BD, Thorner MO. Age-dependent decline in acyl-ghrelin concentrations and reduced association of acyl-ghrelin and growth hormone in healthy older adults. J Clin Endocrinol Metab. 2014;99(2):602-608.

430.   Nass R. Growth hormone axis and aging. Endocrinol Metab Clin North Am. 2013;42(2):187-199.

431.   Van Cauter E, Kerkhofs M, Caufriez A, Van Onderbergen A, Thorner MO, Copinschi G. A quantitative estimation of growth hormone secretion in normal man: reproducibility and relation to sleep and time of day. J Clin Endocrinol Metab. 1992;74(6):1441-1450.

432.   Holl RW, Hartman ML, Veldhuis JD, Taylor WM, Thorner MO. Thirty-second sampling of plasma growth hormone in man: correlation with sleep stages. J Clin Endocrinol Metab. 1991;72(4):854-861.

433.   Brandenberger G, Gronfier C, Chapotot F, Simon C, Piquard F. Effect of sleep deprivation on overall 24 h growth-hormone secretion. Lancet. 2000;356(9239):1408.

434.   Van Cauter E, Leproult R, Plat L. Age-related changes in slow wave sleep and REM sleep and relationship with growth hormone and cortisol levels in healthy men. Jama. 2000;284(7):861-868.

435.   Van Cauter E, Latta F, Nedeltcheva A, Spiegel K, Leproult R, Vandenbril C, Weiss R, Mockel J, Legros JJ, Copinschi G. Reciprocal interactions between the GH axis and sleep. Growth Horm IGF Res. 2004;14 Suppl A:S10-17.

436.   Golstein J, Van Cauter E, Desir D, Noel P, Spire JP, Refetoff S, Copinschi G. Effects of "jet lag" on hormonal patterns. IV. Time shifts increase growth hormone release. J Clin Endocrinol Metab. 1983;56(3):433-440.

437.   Vgontzas AN, Mastorakos G, Bixler EO, Kales A, Gold PW, Chrousos GP. Sleep deprivation effects on the activity of the hypothalamic-pituitary-adrenal and growth axes: potential clinical implications. Clin Endocrinol (Oxf). 1999;51(2):205-215.

438.   Jaffe CA, Friberg RD, Barkan AL. Suppression of growth hormone (GH) secretion by a selective GH-releasing hormone (GHRH) antagonist. Direct evidence for involvement of endogenous GHRH in the generation of GH pulses. J Clin Invest. 1993;92(2):695-701.

439.   Jaffe CA, Turgeon DK, Friberg RD, Watkins PB, Barkan AL. Nocturnal augmentation of growth hormone (GH) secretion is preserved during repetitive bolus administration of GH-releasing hormone: potential involvement of endogenous somatostatin--a clinical research center study. J Clin Endocrinol Metab. 1995;80(11):3321-3326.

440.   Yildiz BO, Suchard MA, Wong M-L, McCann SM, Licinio J. Alterations in the dynamics of circulating ghrelin, adiponectin, and leptin in human obesity. PNAS. 2004;101(28):10434-10439.

441.   Steiger A, Guldner J, Hemmeter U, Rothe B, Wiedemann K, Holsboer F. Effects of growth hormone-releasing hormone and somatostatin on sleep EEG and nocturnal hormone secretion in male controls. Neuroendocrinology. 1992;56(4):566-573.

442.   Weikel JC, Wichniak A, Ising M, Brunner H, Friess E, Held K, Mathias S, Schmid DA, Uhr M, Steiger A. Ghrelin promotes slow-wave sleep in humans. Am J Physiol Endocrinol Metab. 2003;284(2):E407-415.

443.   Sutton J, Lazarus L. Growth hormone in exercise: comparison of physiological and pharmacological stimuli. J Appl Physiol. 1976;41(4):523-527.

444.   Lassarre C, Girard F, Durand J, Raynaud J. Kinetics of human growth hormone during submaximal exercise. J Appl Physiol. 1974;37(6):826-830.

445.   Raynaud J, Capderou A, Martineaud JP, Bordachar J, Durand J. Intersubject variability in growth hormone time course during different types of work. J Appl Physiol. 1983;55(6):1682-1687.

446.   Felsing NE, Brasel JA, Cooper DM. Effect of low and high intensity exercise on circulating growth hormone in men. J Clin Endocrinol Metab. 1992;75(1):157-162.

447.   Vanhelder WP, Goode RC, Radomski MW. Effect of anaerobic and aerobic exercise of equal duration and work expenditure on plasma growth hormone levels. Eur J Appl Physiol Occup Physiol. 1984;52(3):255-257.

448.   Schmidt A, Maier C, Schaller G, Nowotny P, Bayerle-Eder M, Buranyi B, Luger A, Wolzt M. Acute exercise has no effect on ghrelin plasma concentrations. Horm Metab Res. 2004;36(3):174-177.

449.   Chennaoui M, Leger D, Gomez-Merino D. Sleep and the GH/IGF-1 axis: Consequences and countermeasures of sleep loss/disorders. Sleep Med Rev. 2020;49:101223.

450.   Naylor E, Penev PD, Orbeta L, Janssen I, Ortiz R, Colecchia EF, Keng M, Finkel S, Zee PC. Daily social and physical activity increases slow-wave sleep and daytime neuropsychological performance in the elderly. Sleep. 2000;23(1):87-95.

451.   Ritsche K, Nindl BC, Wideman L. Exercise-Induced growth hormone during acute sleep deprivation. Physiol Rep. 2014;2(10).

452.   Roth J, Glick SM, Yalow RS, Berson SA. Hypoglycemia: a potent stimulus to secretion of growth hormone. Science. 1963;140:987-988.

453.   Greenwood FC, Landon J, Stamp TC. The plasma sugar, free fatty acid, cortisol, and growth hormone response to insulin. I. In control subjects. J Clin Invest. 1966;45(4):429-436.

454.   Hindmarsh PC, Smith PJ, Taylor BJ, Pringle PJ, Brook CG. Comparison between a physiological and a pharmacological stimulus of growth hormone secretion: response to stage IV sleep and insulin-induced hypoglycaemia. Lancet. 1985;2(8463):1033-1035.

455.   Tatar P, Vigas M. Role of alpha 1- and alpha 2-adrenergic receptors in the growth hormone and prolactin response to insulin-induced hypoglycemia in man. Neuroendocrinology. 1984;39(3):275-280.

456.   Jaffe CA, DeMott-Friberg R, Barkan AL. Endogenous growth hormone (GH)-releasing hormone is required for GH responses to pharmacological stimuli. J Clin Invest. 1996;97(4):934-940.

457.   Broglio F, Prodam F, Gottero C, Destefanis S, Me E, Riganti F, Giordano R, Picu A, Balbo M, Van der Lely AJ, Ghigo E, Arvat E. Ghrelin does not mediate the somatotroph and corticotroph responses to the stimulatory effect of glucagon or insulin-induced hypoglycaemia in humans. Clin Endocrinol (Oxf). 2004;60(6):699-704.

458.   Carey LC, Cloutier CT, Lowery BD. Growth hormone and adrenal cortical response to shock and trauma in the human. Ann Surg. 1971;174(3):451-460.

459.   Vigas M, Malatinsky J, Nemeth S, Jurcovicova J. Alpha-adrenergic control of growth hormone release during surgical stress in man. Metabolism. 1977;26(4):399-402.

460.   Roth A, Cligg SM, Yalow RS, Berson SA. Secretion of growth hormone: physiological and experimental modification. Metabolism. 1963;12:557-559.

461.   Penalva A, Burguera B, Casabiell X, Tresguerres JA, Dieguez C, Casanueva FF. Activation of cholinergic neurotransmission by pyridostigmine reverses the inhibitory effect of hyperglycemia on growth hormone (GH) releasing hormone-induced GH secretion in man: does acute hyperglycemia act through hypothalamic release of somatostatin? Neuroendocrinology. 1989;49(5):551-554.

462.   Shiiya T, Nakazato M, Mizuta M, Date Y, Mondal MS, Tanaka M, Nozoe S, Hosoda H, Kangawa K, Matsukura S. Plasma ghrelin levels in lean and obese humans and the effect of glucose on ghrelin secretion. J Clin Endocrinol Metab. 2002;87(1):240-244.

463.   Broglio F, Benso A, Gottero C, Prodam F, Grottoli S, Tassone F, Maccario M, Casanueva FF, Dieguez C, Deghenghi R, Ghigo E, Arvat E. Effects of glucose, free fatty acids or arginine load on the GH-releasing activity of ghrelin in humans. Clin Endocrinol (Oxf). 2002;57(2):265-271.

464.   Hayford JT, Danney MM, Hendrix JA, Thompson RG. Integrated concentration of growth hormone in juvenile-onset diabetes. Diabetes. 1980;29(5):391-398.

465.   Asplin CM, Faria AC, Carlsen EC, Vaccaro VA, Barr RE, Iranmanesh A, Lee MM, Veldhuis JD, Evans WS. Alterations in the pulsatile mode of growth hormone release in men and women with insulin-dependent diabetes mellitus. J Clin Endocrinol Metab. 1989;69(2):239-245.

466.   Salgado LR, Semer M, Nery M, Knoepfelmacher M, Lerario AC, Povoa G, Jana S, Villares SM, Wajchenberg BL, Liberman B, Nicolau W. Effect of glycemic control on growth hormone and IGFBP-1 secretion in patients with type I diabetes mellitus. J Endocrinol Invest. 1996;19(7):433-440.

467.   Ho KY, Veldhuis JD, Johnson ML, Furlanetto R, Evans WS, Alberti KG, Thorner MO. Fasting enhances growth hormone secretion and amplifies the complex rhythms of growth hormone secretion in man. J Clin Invest. 1988;81(4):968-975.

468.   Soliman AT, Hassan AE, Aref MK, Hintz RL, Rosenfeld RG, Rogol AD. Serum insulin-like growth factors I and II concentrations and growth hormone and insulin responses to arginine infusion in children with protein-energy malnutrition before and after nutritional rehabilitation. Pediatr Res. 1986;20(11):1122-1130.

469.   Veldhuis JD, Iranmanesh A, Ho KK, Waters MJ, Johnson ML, Lizarralde G. Dual defects in pulsatile growth hormone secretion and clearance subserve the hyposomatotropism of obesity in man. J Clin Endocrinol Metab. 1991;72(1):51-59.

470.   Vahl N, Jorgensen JO, Skjaerbaek C, Veldhuis JD, Orskov H, Christiansen JS. Abdominal adiposity rather than age and sex predicts mass and regularity of GH secretion in healthy adults. Am J Physiol. 1997;272(6 Pt 1):E1108-1116.

471.   Ghigo E, Mazza E, Corrias A, Imperiale E, Goffi S, Arvat E, Bellone J, De Sanctis C, Muller EE, Camanni F. Effect of cholinergic enhancement by pyridostigmine on growth hormone secretion in obese adults and children. Metabolism. 1989;38(7):631-633.

472.   Loche S, Pintor C, Cappa M, Ghigo E, Puggioni R, Locatelli V, Muller EE. Pyridostigmine counteracts the blunted growth hormone response to growth hormone-releasing hormone of obese children. Acta Endocrinol (Copenh). 1989;120(5):624-628.

473.   Cordido F, Casanueva FF, Dieguez C. Cholinergic receptor activation by pyridostigmine restores growth hormone (GH) responsiveness to GH-releasing hormone administration in obese subjects: evidence for hypothalamic somatostatinergic participation in the blunted GH release of obesity. J Clin Endocrinol Metab. 1989;68(2):290-293.

474.   Cordido F, Penalva A, Peino R, Casanueva FF, Dieguez C. Effect of combined administration of growth hormone (GH)-releasing hormone, GH-releasing peptide-6, and pyridostigmine in normal and obese subjects. Metabolism. 1995;44(6):745-748.

475.   Maccario M, Aimaretti G, Grottoli S, Gauna C, Tassone F, Corneli G, Rossetto R, Wu Z, Strasburger CJ, Ghigo E. Effects of 36 hour fasting on GH/IGF-I axis and metabolic parameters in patients with simple obesity. Comparison with normal subjects and hypopituitary patients with severe GH deficiency. Int J Obes Relat Metab Disord. 2001;25(8):1233-1239.

476.   Grottoli S, Gauna C, Tassone F, Aimaretti G, Corneli G, Wu Z, Strasburger CJ, Dieguez C, Casanueva FF, Ghigo E, Maccario M. Both fasting-induced leptin reduction and GH increase are blunted in Cushing's syndrome and in simple obesity. Clin Endocrinol (Oxf). 2003;58(2):220-228.

477.   Pedersen MH, Svart MV, Lebeck J, Bidlingmaier M, Stodkilde-Jorgensen H, Pedersen SB, Moller N, Jessen N, Jorgensen JOL. Substrate Metabolism and Insulin Sensitivity During Fasting in Obese Human Subjects: Impact of GH Blockade. J Clin Endocrinol Metab. 2017;102(4):1340-1349.

478.   Carro E, Senaris R, Considine RV, Casanueva FF, Dieguez C. Regulation of in vivo growth hormone secretion by leptin. Endocrinology. 1997;138(5):2203-2206.

479.   Tschop M, Weyer C, Tataranni PA, Devanarayan V, Ravussin E, Heiman ML. Circulating ghrelin levels are decreased in human obesity. Diabetes. 2001;50(4):707-709.

480.   Hansen TK, Dall R, Hosoda H, Kojima M, Kangawa K, Christiansen JS, Jorgensen JO. Weight loss increases circulating levels of ghrelin in human obesity. Clin Endocrinol (Oxf). 2002;56(2):203-206.

481.   Leidy HJ, Gardner JK, Frye BR, Snook ML, Schuchert MK, Richard EL, Williams NI. Circulating Ghrelin Is Sensitive to Changes in Body Weight during a Diet and Exercise Program in Normal-Weight Young Women. J Clin Endocrinol Metab. 2004;89(6):2659-2664.

482.   Lindeman JH, Pijl H, Van Dielen FM, Lentjes EG, Van Leuven C, Kooistra T. Ghrelin and the hyposomatotropism of obesity. Obes Res. 2002;10(11):1161-1166.

483.   Yu AP, Ugwu FN, Tam BT, Lee PH, Ma V, Pang S, Chow AS, Cheng KK, Lai CW, Wong CS, Siu PM. Obestatin and growth hormone reveal the interaction of central obesity and other cardiometabolic risk factors of metabolic syndrome. Sci Rep. 2020;10(1):5495.

484.   Tamboli RA, Antoun J, Sidani RM, Clements A, Harmata EE, Marks-Shulman P, Gaylinn BD, Williams B, Clements RH, Albaugh VL, Abumrad NN. Metabolic responses to exogenous ghrelin in obesity and early after Roux-en-Y gastric bypass in humans. Diabetes Obes Metab. 2017;19(9):1267-1275.

485.   Sukkar MY, Hunter WM, Passmore R. Changes in plasma levels of insulin and growth-hormone levels after a protein meal. Lancet. 1967;2(7524):1020-1022.

486.   Parker ML, Hammond JM, Daughaday WH. The arginine provocative test: an aid in the diagnosis of hyposomatotropism. J Clin Endocrinol Metab. 1967;27(8):1129-1136.

487.   Alba-Roth J, Muller OA, Schopohl J, von Werder K. Arginine stimulates growth hormone secretion by suppressing endogenous somatostatin secretion. J Clin Endocrinol Metab. 1988;67(6):1186-1189.

Growth and Growth Disorders

ABSTRACT


The process of growth is complex and is influenced by various factors that act centrally and peripherally. The genetic control of human growth is becoming increasingly clear. Many genes have been identified that contribute to the development and function of the pituitary gland including the somatotrope and the GH/IGF1 axis.  Genes encoding “downstream” factors, including the insulin and the insulin receptor, the Short Stature Homeobox and SHP2 affect growth unrelated to growth hormone status, while Aggrecan has been described in cases of short stature with an advanced bone age, as well as in multiple forms of spondyloepiphyseal dysplasia. Defects in these genes have been shown to be responsible for abnormal growth in humans. In this chapter, we describe conditions associated with multiple pituitary hormone deficiency, isolated growth hormone deficiency, and abnormal growth without growth hormone deficiency, discuss the genes that are associated with these conditions, and prepare guidelines for the clinicians to evaluate and treat a child with poor growth.


INTRODUCTION


Human growth starts at conception and proceeds through various identifiable developmental stages. The process of growth depends on both genetic and environmental factors that combine to determine an individual’s eventual height. The genetic control of statural growth is becoming increasingly clear. Many genes have been identified that are required for normal development and function of the pituitary in general, and that control the growth hormone/insulin-like growth factor axis in particular and many more that are involved in numerous cascades of intracellular processes “downstream” of GH/IGF1 action. Mutations of these genes have been shown to be responsible for abnormal growth in humans and animals.


Growth hormone (GH) has been used to treat short children since the 1950’s. Initially only those children with the most pronounced growth failure due to severe growth hormone deficiency (GHD) were considered appropriate candidates, but with time children with growth failure from a range of conditions have been shown to benefit from GH treatment. GH has also been used to treat several catabolic processes, including cystic fibrosis, inflammatory bowel disease, and AIDS wasting. Here we review the physiology of growth, the diagnosis of GH deficiency, treatment options and genetic growth hormone disorders.


GROWTH DISORDERS


Growth failure may be due to genetic mutations, acquired disease and/or environmental deficiencies. Growth failure may result from a failure of hypothalamic growth hormone-releasing hormone (GHRH) production or release, from (genetic or sporadic) mal-development of the pituitary somatotropes, secondary to ongoing chronic illness, malnutrition, intrinsic abnormalities of cartilage and/or bone such as osteochondrodysplasias, and from genetic disorders affecting growth hormone production and responsiveness. Children without any identifiable cause of their growth failure are commonly labeled as having idiopathic short stature (ISS).


Genetic factors affecting growth include pituitary transcription factors (PROP1, POU1F1, HESX1, LHX3, and LHX4), GHRH, the GH secretagogue (GHS), GH, insulin like growth factor-1 (IGF1), insulin like growth factor-2 (IGF2), insulin (INS) and their receptors (GHRHR, GHSR, GHR, IGF1R, IGF2R and INSR) as well as transcription factors controlling GH signaling, including STAT1, STAT3, STAT5a, and STAT5b. Growth is also influenced by other factors such as the Short Stature Homeobox, sex steroids (estrogens and androgens), glucocorticoids and thyroid hormone.


Since the replacement of human pituitary-derived GH with recombinant human GH, much experience has been gained with the use of GH therapy. The Food and Drug Administration (FDA) had expanded GH use for the following conditions for children (1):


  1. GH deficiency/insufficiency
  2. Chronic renal insufficiency (pretransplantation)
  3. Turner syndrome
  4. SHOX haploinsufficiency
  5. Short stature from Prader-Willi Syndrome (PWS)
  6. Children with a history of fetal growth restriction (SGA, IUGR) who have not    caught up to a normal height range by age 2 years
  7. Children with idiopathic short stature (ISS): height > 2.25 SD below the mean in height and unlikely to catch up in height.
  8. Noonan Syndrome
  9. Short Bowel Syndrome


FDA approved conditions for GH treatment for adults:


  1. Adults with GH deficiency
  2. Adults with AIDS wasting


The efficacy of GH treatment has been investigated in children whose height has been compromised due to chronic illnesses such as Crohn’s disease, cystic fibrosis, glucocorticoid-induced suppression of growth in other disorders (asthma and juvenile idiopathic arthritis (JIA), also known as juvenile rheumatoid arthritis (JRA)), and adrenal steroid disorders such as congenital adrenal hyperplasia (CAH). Studies have shown both anabolic effects and improvement of growth velocity after GH treatment in children with glucocorticoid dependent Crohn’s disease (2-4). Improvement in linear growth has also been observed after GH treatment in children with cystic fibrosis and JIA (5-7). The same studies have shown significant improvement in weight gain and body composition, changes that have been variably correlated with improvement in life expectancy and quality of life.


The growth-suppressing effects of glucocorticoids, is also seen in children affected with CAH where high androgens both increase short-term growth velocity and limit the height potential. Most patients with CAH complete their growth prematurely and are ultimately short adults. Lin-Su et al, showed that GH in combination with LHRHa significantly improved their final adult height in children with CAH (8). Larger, long-term prospective studies are needed to determine the safety and efficacy of GH treatment in these populations of children.


The key mediator of GH action in the periphery for both prenatal and postnatal mammalian growth is the IGF system. GH exerts its direct effects at the growth plate and indirect effects via IGF1. Better understanding the role of IGF1 on growth had led to the concept of IGF1 deficiency in addition to GH deficiency. With the introduction of recombinant human (rh) IGF1, today, it is possible to treat conditions due to genetic GH resistance or insensitivity caused by GH receptor defects, and the presence of neutralizing GH antibodies(9). 


MULTIPLE PITUITARY HORMONE DEFICIENCY (MPHD)


GH deficiency may occur in combination with other pituitary hormone deficiencies and is often referred to as hypopituitarism, panhypopituitarism or multiple pituitary hormone deficiency (MPHD).


The anterior portion of pituitary gland forms from Rathke's pouch around the third week of gestation (10). It is influenced by the expression of numerous transcription factors and signaling molecules; some of them required for continued normal function of pituitary gland. Mutations have been identified in the genes for several of these pituitary transcription factors and signaling molecules, including GLI2, LHX3, LHX4, HESX1, PROP1, POU1F1, SOX2, PITX2, OTX2 and SOX3 (Table 1). The most frequently mutated gene is PROP1, 6.7% in sporadic and 48.5% in familial cases (11).


The majority of cases of hypopituitarism are idiopathic in origin; however, familial inheritance, which may be either dominant or recessive, accounts for between 5 and 30% of all cases (12).  It may present early in the neonatal period or later in childhood. It can be associated with single or multiple pituitary hormone deficiencies, and the endocrinopathy. It may be associated with a number of extrapituitary defects such as optic nerve hypoplasia, anophtalmia, microphtalmia, agenesis of the corpus callosum, and absence of the septum pellucidum.


Table 1. Transcription Factors Required for Normal Pituitary Development

Transcription Factors 

Function

GLI2

Essential for the forebrain and early stages of the anterior pituitary development

LHX3

Essential for the early development of the anterior pituitary, including the somatotrope, thyrotrope, lactotrope and the gonadotrope (but not the corticotrope)

LHX4

Essential for the proliferation of the anterior pituitary cell types, including the somatotrope, thyrotrope and the corticotrope


HESX1

Essential for the development of the anterior pituitary, including the somatotrope, thyrotrope, lactotrope and the gonadotrope

PROP1

Essential for the development of most cell types of the anterior pituitary, including the somatotrope, the thyrotrope, the lactotrope and the gonadotrope (but not the corticotrope). Also essential for the expression of the PIT1 protein and the extinction of HESX1 in the anterior pituitary

POU1F1 (PIT1)

Necessary for somatotrope, lactotrope and thyrotrope development and also for their continued function

SOX2

Essential for the expression of POU1F1 and the development of gonadotrope

PITX2

Necessary for the development of gonadotrope, somatotrope, lactotrope and thyrotrope

OTX2

Transactivates HESX1 and POU1F1

SOX3

Essential for the early formation of hypothalamic-pituitary axis


GLI2


GLI2 is a transcription factor molecule, mediating Sonic Hedgehog (SHH) signaling and is necessary for forebrain development as well as  for the early stages of pituitary development (13). The clinical phenotype of persons with mutations in GLI2 may vary from asymptomatic individuals to isolated GH deficiency to hypopituitarism in combination with a small anterior pituitary, ectopic posterior pituitary, midfacial hypoplasia, holoprosencephaly, and polydactyly (14-16).

Figure 1. GLI2

LHX3


LHX3 is a member of the LIM family of HomeoboX transcription factors. The gene LHX3, is located on 9q34.3, comprises 7 exons (including two alternative exon 1's, 1a and 1b) and encodes a protein of 402 amino acids (Figure 2). LHX3 is expressed in the developing Rathke's pouch and is required for the development of most anterior pituitary cell types, including the somatotrope, the thyrotrope, the lactotrope, and the gonadotrope (but notably not the corticotrope). LHX3 binds as a dimer, synergizing with POU1F1 (PIT1). Two unrelated families with MPHD were identified in 2000(17) as harboring mutations in LHX3. The affected members of the family manifested severe growth retardation in association with restricted rotation of the cervical spine. Inheritance is consistent with an autosomal recessive pattern of inheritance and of note one individual was found to have an enlarged pituitary. Recently, a new mutation in LHX3 was described in a child with hypointense pituitary lesion, focal amyotrophy and mental retardation in addition to neck rigidity and growth retardation (18). These clinical findings expand the phenotype associated with mutations in LHX3.

Figure 2. LHX3

LHX4


LHX4 also has a critical role in the development of anterior pituitary cells, and is co-expressed with LHX3 in Rathke's pouch in an overlapping but not wholly redundant pattern. Raetzman et al showed overlapping functions with PROP1in early pituitary development, but also observed that their mechanisms of action were not identical. LHX4 is necessary for cell survival and LHX3 expression, with the pituitary hypoplasia seen in LHX4 mutants actually results from increased cell death and reduced differentiation, directly attributable to loss of LHX3; while PROP1 mutants exhibit normal cell proliferation and cell survival but show evidence of defective dorsal-ventral patterning (19). In the absence of both of these genes, no specification of corticotropes, gonadotropes or thyrotropes occurs in the anterior lobe. Although both LHX3 and LHX4 are crucial for the development of pituitary gland, LHX3 is expressed at all stages studied, whereas LHX4 expression is transient at 6 weeks of development (20). LHX4 is located on 1q25 and comprises 6 exons spread over a 45 kb genomic region (Figure 3). An intronic splice site mutation has been described in one family, manifesting GH, TSH and ACTH deficiency, along with cerebellar and skull defects. The mutation is transmitted as an autosomal dominant condition, with complete penetrance. Interestingly, a heterozygous mutant mouse model had no discernable phenotype, while homozygous loss of function in the mouse was fatal (21).

Figure 3. LHX4

HESX1


HESX1 (HomeoboX gene expressed in Embryonic Stem cells), also referred to as RPX1 (Rathke's Pouch HomeoboX), is necessary for the development of the anterior pituitary. RPX1 comprises 4 exons and encodes a protein of 185 amino acids that features both a homeodomain as well as a repressor domain and is located on chromosome 3p21.2 (Figure 4). The extinguishing of HESX1 requires the appearance of another pituitary transcription factor, PROP1. A mutation has been described in two children of a consanguineous union who had optic nerve hypoplasia, agenesis of the corpus callosum and panhypopituitarism, with an apparent autosomal recessive mode of inheritance (22). This Arg → Cys mutation lies between the repressor and homeodomains but the mutant protein was shown in vitro to be unable to bind to its cognate sequences. A novel homozygous missense mutation (126T) of the critical engrailed homology repressor domain (eh1) of HESX1 was described in a girl born to consanguineous parents (23). Neuroimaging revealed a thin pituitary stalk with anterior pituitary hypoplasia and an ectopic posterior pituitary. Unlike previous cases, she did not have midline or optic nerve abnormalities. Although 126T mutation did not affect the DNA-binding ability of HESX1, it impaired ability of HESX1 to recruit Groucho-related corepressor, thereby leading to partial loss of repression. It appears that HESX1 mutations exhibit variety of clinical phenotypes with no clear genotype-phenotype correlation. Tantalizingly, additional nucleotide variants have been described in individuals with isolated GH deficiency, although it is not convincingly clear that these polymorphisms are actually pathogenic (24,25).

Figure 4. HESX1

PROP1


PROP1 (the Prophet of PIT-1) encodes a transcription factor required for the development of most pituitary cell lines, including the somatotrope (GH secretion), lactotrope (prolactin (PRL) secretion), thyrotrope (TSH secretion), and the gonadotrope (FSH and LH secretion). Mutation of PROP1, therefore, results in the deficiency of GH, TSH, PRL, FSH and LH although some individuals with PROP1 mutations have been described with ACTH deficiency (26). Since PROP1 does not appear to be required for the development of the corticotrope cell line, the etiology of ACTH deficiency is unclear. It appears that the ACTH deficiency here is a consequence of the compensatory pituitary hyperplasia that develops over time. Significantly, the degree of TSH deficiency appears to be quite variable, even within mutation-identical individuals, suggesting that the general phenotype associated with PROP1 mutations is also quite variable. PROP1 is encoded by three exons and is located on 5q. Many mutations have been described in PROP1-all inherited in an autosomal recessive manner. Although several studies suggest that mutation of PROP1 is the most common cause of familial MPHD, but is less common in sporadic cases of MPHD (11,27). Two recurrent mutations have been described, both involving exonic runs of GA tandem repeats (Figure 5). In both cases, the loss of a tandem unit at either locus results in a frameshift and premature termination, and a protein incapable of transactivation.

Figure 5. PROP1

POU1F1


POU1F1 encodes the POU1F1 transcription factor, also known as PIT1, which is required for the development and function of three major cell lines of anterior pituitary: somatotropes, lactotropes and thyrotropes. Various mutations in the gene encoding POU1F1 have been described, resulting in a syndrome of multiple pituitary hormone deficiency involving GH, PRL and TSH hormones. POU1F1 is located on 3p11 and consists of six exons encoding 291 amino acids (Figure 6). Many mutations of POU1F1 have been described; some are inherited as autosomal recessive and some as autosomal dominant. There is a wide variety of clinical presentation in patients with POUF1 mutations. Generally, GH and prolactin deficiencies are seen early in life. However, TSH deficiency can be highly variable with presentation later in childhood or normal T4 secretion can be preserved into the 3rd decade (28,29). To date, POU1F1mutations have been described in a total of 46 patients from 34 families originating in 17 different countries (30).Recessive mutations are generally associated with decreased activation, while dominant mutations have been shown to bind but not transactivate - i.e. act as dominant-negative mutations, rather than through haploinsufficiency. One such mutation is the recurrent Arg271Trp (R271W), located in exon 6, which results from a C T transition at a CpG dinucleotide, i.e. a region predisposed to spontaneous mutagenesis. Another interesting mutation is the Lys216Glu mutation of exon 5. This mutation is unique in that the mutant transcription factor activates both the GH and PRL promoters at levels greater than wild-type (i.e. acts as a superagonist), but down-regulates its own (i.e. the POU1F1) promoter-leading to decreased expression of PIT1. R271W is the most frequent mutation of POU1F1. A recent report describing a novel mutational hot spot (E230K) in Maltese patients suggests a founder effect (29). The same group reported two additional novel mutations within POU1F1 gene; an insertion of a single base pair (ins778A) and a missense mutation (R172Q)(27).

Figure 6. POU1F1

SOX3


SOX3 encodes a single-exon gene SOX3, an HMG box protein, located on the X chromosome (Xq26.3) in all mammals (31). It is believed to be the gene from which SRY, testis–determining gene evolved (32). Based on sequence homology, SOX, however, is more closely related to SOX1 and SOX2, together comprising the SOXB1 subfamily and are expressed throughout the developing CNS (33,34). In humans, mutations in the SOX3 gene have been implicated in X-linked hypopituitarism and mental retardation. In a single family, a SOX3 gene mutation was shown in affected males who had mental retardation and short stature due to GH deficiency (35). The mutation was an in-frame duplication of 33 bp encoding for an additional 11-alanine, causing an expansion of a polyalanine tract within SOX3. Recently, other mutations including a submicroscopic duplication of Xq27.1 containing SOX3, a novel 7-alanine expansion within the polyalanine tract, and a novel polymorphism (A43T) in the SOX3 gene were described in males with hypopituitarism. Phenotypes of these patients include severe short stature, anterior pituitary hypoplasia, and ectopic posterior pituitary, colossal abnormalities, and infundibular hypoplasia. Although duplications of SOX3have been implicated in the etiology of X-linked hypopituitarism with mental retardation, in at least one study, none of the affected individuals had mental retardation or learning difficulties (36). Taken together, the data suggests that SOX3 has a critical role in the development of the hypothalamic-pituitary axis in humans, and mutations in SOX3 gene are associated with X-linked hypopituitarism but not necessarily mental retardation(36).


ISOLATED GH DEFICIENCY (IGHD)


Abnormalities either in the synthesis or the activity of GH can cause a wide variation in the clinical phenotype of the patient. Most frequently, it occurs as a sporadic condition of unknown etiology but severe forms of IGHD may result from mutations or deletions in GH1 or GHRHR gene. General clinical features of IGHD deficiency include proportionate growth retardation accompanied by a decreased growth velocity, puppet-like facies, mid-facial hypoplasia, frontal bossing, thin hair, a high-pitched voice, microphallus, moderate trunk obesity, acromicria, delayed bone maturation and dentition. Patients with IGHD appear younger than their chronological age. Puberty may be delayed until late teens, but usually fertility is preserved.

To date, four Mendelian patterns of inheritance for IGHD have been identified on the basis of the type of defect, mode of inheritance, and degree of deficiency.


1) Type 1 GH deficiency is an autosomal recessively inherited condition, which exists as either complete, or partial loss of GH expression.

  1. a) Type 1a deficiency is characterized by the complete absence of measurable GH. Infants born with a type 1a defect are generally of normal length and weight, suggesting that, in utero, GH is not an essential growth factor (37,38). Growth immediately after birth and during infancy may also be less dependent on circulating GH levels than during other phases of life. Patients with Type 1a deficiency initially respond to rhGH treatment well. However, about 1/3 of patients develop antibodies to GH which leads to markedly decreased final height as adults (30). The exact prevalence of Type 1a deficiency is not known, and most reported families are consanguineous (30). Mutations in Type 1a have been described in GH1 and GHRHR-including nonsense mutations, microdeletions/frame-shifts, and missense mutations.
  2. b) Type 1b deficiency represents a state of partial - rather than an absolute - deficiency of GH, with measurable (but insufficient) serum GH. Therefore, Type 1b is milder than Type 1a deficiency. Patients with Type 1b deficiency do not typically present with mid-facial hypoplasia or microphallus. They also have a good response to GH treatment without developing GH antibodies. Most cases of Type 1b GH deficiency are caused by missense and/or splice site mutations in the GH1 and GHRHR genes (39).


2) Type 2 GH deficiency is an autosomal dominantly inherited disorder with reduced secretion of GH. Patients with Type 2 GHD usually do not have any pituitary abnormality (40). However, recently, it has been shown that their pituitary may become small over time (41). They have a good response to GH treatment. This type of GH deficiency is intuitively less clear, since autosomal dominant conditions generally occur as a result of either haploinsufficiency or secondary to dominant-negative activity. Haploinsufficiency, however, has not been demonstrated in the obligate heterozygote carriers of individuals harboring GH1 deletions, and is therefore an unlikely explanation. Dominant-negative activity is usually associated with multimeric proteins, also making this explanation less intuitive. Type 2 GHD appears to be the most common form of IGHD and many mutations have been identified in GH1 including splicing and missense mutations(42-49). Recent studies suggest that GH1 may not be the only gene involved in Type 2 GHD. Screening 30 families with autosomal dominant IGHD did not show any GH1 mutations, raising the possibility of other gene(s) may be involved (50).


3) Type 3 growth hormone deficiency is inherited in an X-linked recessive manner. There are no candidate genes and no compelling explanations for this condition. There are no reported mutations of the GH-1 gene in Type 3 GHD. In addition to short stature, patients may also have agammaglobulinemia (30).  


Table 2 summarizes phenotype of mutations involved in human pituitary transcription factors causing IGHD and MPHD and their mode of inheritance.


Table 2. Genotype and Phenotype Correlations in Human Pituitary Transcription Factors

Gene

Phenotype

Mode of Inheritance

  IGHD

 GH-1

IGHD type 1a/1b

IGHD type 2

AR

AD

 GHRHR

IGHD type 1b

AR

  MPHD

  LHX3 

Deficiencies of GH, TSH, LH, FSH, PRL, rigid neck, small/normal/or enlarged anterior pituitary

AR

  LHX4

Deficiencies of GH, TSH and ACTH, small anterior pituitary, cerebellar and skull defects

AD

  HESX1 

Hypopituitarism, optic nerve hypoplasia, agenesis of the corpus callosum, ectopic posterior pituitary

AR/AD

  PROP1 

Hypopituitarism except ACTH deficiency, small/normal/or enlarged anterior pituitary

AR

  POU1F1 (PIT1)

Deficiencies of GH, TSH, PRL, small or normal anterior pituitary

AR/AD

  SOX3

Hypopituitarism, mental retardation, learning difficulties, small anterior pituitary, ectopic posterior pituitary

X-linked recessive

  OTX2

Hypopituitarism, microphtalmia

AD

  GLI2

Hypopituitarism, small anterior pituitary, ectopic posterior pituitary, holoprosencephaly, polydactily

AD

AR: Autosomal Recessive; AD: Autosomal Dominant.


HYPOTHALAMIC GH DEFICIENCY

Synthesis and Secretion of GH


GH is synthesized within the somatotropes of the anterior pituitary gland and is secreted into circulation in a pulsatile fashion under tripartite control, stimulated by growth hormone releasing hormone (GHRH), the Growth Hormone Secretagogue (GHS), and Ghrelin and inhibited by somatostatin (SST) (Figure 7). GHRH, GHS and SST secretion are themselves regulated by numerous central nervous system neurotransmitters (Table 3). GH, via a complex signal transduction, exerts direct metabolic effects on target tissues and exerts many of its growth effects through releasing of IGF1 which is mainly produced by the liver and the target tissues (e.g. growth plates).  Additional regulation of GH secretion is achieved through feedback control by IGF1 and GH at the pituitary and at the hypothalamus.

Figure 7. Hypothalamic-pituitary-peripheral regulation of GH Secretion. SST, somatostatin; GHRH, growth hormone releasing hormone; IGF1, insulin-like growth factor type 1


Table 3. Neurotransmitters and Neuropeptides Regulating GHRH Secretion from Hypothalamus.

Dopamine 

Gastrin

GABA 

Neurotensin

Substance-P 

Calcitonin

TRH 

Neuropeptide-Y

Acetylcholine 

Vasopressin

VIP 

CRHs


Timing


In addition to the absolute GH levels reached, the timing of the GH pulse is also physiologically important. GH is secreted in episodic pulses throughout the day, and the basal levels of GH are often immeasurably low between these peaks (Figure 8). Figure 8 illustrates normal spontaneous daily GH secretion, while figure 9 represents that of a child with GH deficiency.

Figure 8. The characteristic pulsatile pattern of GH secretion in normal children. Note the maximal GH secretion during the night.

Figure 9. GH secretion in a child with GH deficiency. Note the loss (both qualitative and quantitative) of episodic pulses seen in normal children


Approximately 67% or more of the daily production of GH in children and young adults occurs overnight, and most of that during the early nighttime hours that follow the onset of deep sleep. During puberty, there is an increase in GH pulse amplitude and duration, most likely due to estrogens (51). GH secretion is sexually dimorphic, with females having higher secretory burst mass per peak but no difference in the frequency of peaks, or basal GH release (52). In addition, GH secretion is stimulated by multiple physiologic factors (Table 4). Overweight children, independent of pubertal status, have reduced GH levels mainly due to reduced GH burst mass with no change in frequency (53).


Table 4. Physiologic Factors That Affect GH Secretion

Factors that stimulate GH secretion 

Factors that suppress GH secretion

Exercise 

Hypothyroidism

Stress 

Obesity

Hypoglycemia 

Hyperglycemia

Fasting 

High carbohydrate meals

High protein meals 

Excess glucocorticoids

Sleep


Growth Hormone Releasing Hormone


GHRH (also known as Somatocrinin) is the hypothalamic-releasing hormone isolated in 1982 (54) believed to be the chief mediator of GH secretion from the somatotrope. GHRH deficiency is thought to be the most common cause of 'acquired' GHRH deficiency, secondary to (even mild) birth trauma. GHRH includes 5 exons, with transcription of (the non-coding) exon 1 differing on a tissue-specific basis (55). The mature GHRH protein contains 44 amino acids, with an amidated carboxy-terminus (Figure 10). Despite this post-translational modification, much of the GH-secreting ability resides in the (original) amino half, allowing the synthesis of shorter peptides retaining efficacy (e.g. 1-29 GHRH). Despite being cloned in 1985 (56), there are no reports of (spontaneous) mutations in humans or in any animal model. Individuals with mutations in GHRH are predicted to have isolated GH deficiency.

Figure 10. Growth Hormone Releasing Hormone

Growth Hormone Releasing Hormone Receptor


GHRHR was cloned in 1992(57), described as the cause of isolated GH deficiency (IGHD) in the Little strain of dwarf mouse by 1993 (58,59), mapped in the human by 1994 (60), and demonstrated to be a cause of human GH deficiency in 1996 (39). GHRHR is located on 7p15 (60), comprises 13 exons and encodes a protein of 423 amino acids, belonging to the G-protein coupled, heptahelical transmembrane domain receptors (Figure 11). The initial reports of GHRHR mutations were in geographically isolated (and therefore endogamous) populations in South Asia (39,61,62)and later in Brazil (63). In fact, haplotype analysis of the GHRHR locus in three unrelated families from the Indian subcontinent, carrying the identical E72X nonsense mutation in GHRHR indicated that this represents a common ancient founder mutation (64). An independent analysis of patients with familial isolated GH deficiency from non-consanguineous families revealed that the majority of patients carried the identical E72X mutation, suggesting that E72X mutation can be a reasonable candidate for isolated GH deficiency (65). There are now numerous other reports, making GHRHR one of the most commonly mutated genes in IGHD. Roelfsema et al studied two members of a single family with an inactivating mutation of the GHRHR and noted that the 'normal' pattern of spontaneous GH production was preserved, although the absolute quantity of GH secreted was quite low and the approximate entropy significantly elevated (66); supporting the view that the amplitude of a GH pulse is the result of a GHRH burst, while the timing of GH pulses is the result of a somatostatin trough.

Figure 11. Growth Hormone Releasing Hormone Receptor

Ghrelin


In 1977 Bowers et al (67) reported on the ability of enkephalins to secrete GH and it was later demonstrated that this secretion was independent of GHRH. This sentinel finding gave rise to a new field of study, that of the growth hormone releasing peptides (GHRP's) or growth hormone secretagogues (GHS's). Twenty-two years later Kojima et al (68) reported the isolation of the endogenous ligand whose actions were mimicked by the enkephalins. They named the hormone Ghrelin, based on the Proto-Indian word for 'grow'. Ghrelin is located on 3p25-26(69) (Figure 12), is processed from a ‘preproGhrelin’ precursor, and is primarily produced by the oxyntic cells of the stomach and to a lesser extent in the arcuate ventro-medial and infundibular nuclei of the hypothalamus (70). Ghrelin also plays a role in regulating food intake. In addition to its GH secreting actions, direct intracerebroventricular injection of Ghrelin in mice has potent orexigenic “appetite stimulating” action, and this action is mediated by NPY, which antagonizes the actions of Leptin.


Several studies have shown that, on a molar basis, Ghrelin is significantly more potent at inducing GH secretion than GHRH (71). Additionally, many of these studies have shown that Ghrelin and GHRH are synergistic, inducing a substantial GH response when given in combination (72-75). Several studies comparing GHRH and Ghrelin demonstrate that 1 ug/kg GHRH results in a GH peak of approximately 25 ng/ml, 1 ug/kg Ghrelin results in a GH peak of approximately 80 ng/ml GH, but when given together, 1ug/kg of GHRH + 1 ug/kg Ghrelin results in a GH peak of approximately 120 ng/ml (75,76). When short normal children were compared to children with neurosecretory GH deficiency, Ghrelin secretion was similar in both groups during daytime but higher Ghrelin levels were detected during the night in short children with neurosecretory GH deficiency. The authors therefore suggest that Ghrelin is not involved in nighttime GH secretion (77), although these findings are also consistent with a relative Ghrelin insensitivity at night. In a group of boys with constitutional delay of puberty, testosterone administration caused the expected increase in GH concentrations but did not affect the 24-hour Ghrelin profile, suggesting that the testosterone-induced GH secretion was not mediated by ghrelin (78). Another study demonstrated a decrease in Ghrelin concentrations following glucagon administration in a group of non-GH-deficient short children, suggesting that Ghrelin does not mediate glucagon-induced GH secretion (79).


A second hormone, Obestatin is also known to be produced from preproGhrelin. Obestatin has anorexigenic effects, opposite those of Ghrelin (80). Several nucleotide changes have been identified in the preproGhrelin locus, and some are associated with body mass index, BMI (81). It is not clear, however, whether these are polymorphisms, or distinct mutations. It is also not clear whether these nucleotide variants exert their effects solely via an altered Ghrelin, a corrupted Obestatin, or a combination of the two. A knockout mouse lacking the preproghrelin locus had no statural or weight phenotype, but this may well be the result of the simultaneous loss of both ghrelin and obestatin. To this point, a transgenic mouse with abnormal ghrelin but normal obestatin did indeed have poor weight gain, explained by either ghrelin deficiency, unopposed obestatin, or both. There are no reports of (spontaneous) mutations in Ghrelin associated with short stature, either in humans or in any animal model, although polymorphisms have been associated with weight/metabolic syndrome. The theoretical phenotype of such an individual would presumably be that of isolated GH deficiency, most likely of post-natal onset and possibly with an abnormally low appetite.

Figure 12. Ghrelin

Ghrelin Receptor


The receptor for Ghrelin (GHSR) was identified in 1996 by Howard et al (70), prior to the identification of the ligand, and maps to 3q26-27 (Figure 13).  Mutations of the GHSR gene have been reported in individuals with isolated GH deficiency (82).


Combining data from numerous investigators, there appear to be differences in the specific roles of these parallel but independent pathways for GH secretion. Given that:

  1. Ghrelin induces a larger release of GH than GHRH,
  2. Both bolus and continuous GHRH infusion results in a chronic release of GH(83),
  3. A bolus of Ghrelin results in GH secretion, but continuous Ghrelin infusion does not; and
  4. Ghrelin administration (bolus or continuous) does not cause an increase in GH mRNA;


It is therefore likely that the GHRH/GHRHR arm of the somatotropin pathway serves primarily in the production of de novo GH, and secondarily in the release of (pre-made) GH while Ghrelin/GHSR may serve primarily in the release of stored GH, and only secondarily-if at all-in the production of de novo GH (76,84).

Figure 13. Ghrelin Receptor

Somatostatin


The somatostatin gene (SST) is located on 3q28, and contains two exons, encoding a 116 amino acid pre-prosomatostatin molecule that is refined down to a 14 amino acid cyclic peptide (as well as a 28 amino acid precursor/isoform)(85) (see figure 14). Pancreatic somatostatin inhibits the release of both insulin and glucagon, while in the CNS somatostatin inhibits the actions of several hypothalamic hormones, including GHRH. For this reason, somatostatin is also known as Growth Hormone Release Inhibiting Hormone. Somatostatin's widespread effects are mediated by five different receptors, all encoded by different genes (rather than through alternative splicing of a single gene). The anti-GHRH actions on the pituitary are primarily mediated by somatostatin receptors (SSTR) 2 and 5, which act by inhibiting cAMP as well as other pathways (86) (see figures 15 and 16). There is a single case report of a nucleotide variant in SSTR5, occurring in a subject with acromegaly. (This individual, however, was also reported as having a mutation in the GSP oncogene; placing the pathological nature of the SSTR5 variant in question). Whereas GHRH induces release of growth hormone stored in secretory vesicles by depolarization of the somatotrope, somatostatin inhibits GH release by hyperpolarizing the somatotrope, rendering it unresponsive to GHRH. There are no reports of mutations in the somatostatin gene, or in SSTR2.


All three of these hypothalamic modifiers of GH secretion act through cell-membrane receptors of the G-protein coupled receptor (GCPR) class. These receptors are characterized by seven membrane-spanning helical domains, an extracellular region that binds (but does not internalize) the ligand hormone, and an intracellular domain that interacts with a G-protein, which contains a catalytic subunit that generates a second messenger (e.g. cyclic AMP or inositol triphosphate).

Figure 14. Somatostatin

Figure 15. Somatostatin Receptor 2

Figure 16. Somatostatin Receptor 5

PITUITARY GH DEFICIENCY

Human Growth Hormone


GH is critical for growth through (most of) childhood as well as for optimal metabolic, neurocognitive, cardiac, musculoskeletal and adipose function throughout life. GH acts through GH receptors on cells of a variety of target tissues. Many, but not all, actions of GH are mediated by insulin-like growth factor 1 (IGF1), also known as Somatomedin-C. IGF1 is released in response to GH and acts as both a hormone and an autocrine/paracrine factor. GH, directly and indirectly through the actions of IGF1, stimulates tissue growth and proliferation, most notably in the epiphyseal growth plates of children, increases lean muscle mass, decreases fat mass, and increases bone mineral density.


Growth hormone is a single-chain polypeptide that contains 191 amino acids with two intramolecular disulfide bonds and the molecular weight of 22,128 Daltons. The GH protein (GHN) is encoded by the GH1 gene located on chromosome 17q22-q24 (Figure 17) in a complex of five genes: two for the growth hormone/growth hormone variant (GH1, GH2), two for chorionic somatomammotropin (CS1, CS2), and one for the somatomammotropin pseudogene (CSL). GH2 encodes the GHV protein that is secreted by the placenta into maternal circulation. GHV has greater lactogenic properties than does GHN and may function to maintain the maternal blood sugar in a desirable range, thus ensuring sufficient nutrition for the fetus.

Figure 17. Growth Hormone

PERIPHERAL GH RESISTANCE

Growth Hormone Receptor


Growth failure with normal serum GH levels is well known, both at the genetic and the clinical level. Although such cases may be due to defects of GH1 (e.g. bioinactive GH), many such subjects have been shown to have mutations in the GH Receptor (GHR), i.e. Growth Hormone Insensitivity, known as Laron Syndrome. Biochemical hallmarks of this syndrome are increased or normal GH levels with low IGF1 and with absent or decreased response to GH treatment (87).


The growth hormone receptor gene (GHR) is located on 5p13-12 and contains 10 exons which span a physical distance of almost 300 kb of genomic DNA (Figure 18). The GHR consists of a ligand-binding extracellular domain, an 'anchoring' transmembrane domain and an intracellular domain with intrinsic tyrosine kinase activity. A monomeric GHR binds a single GH molecule, which then dimerizes a second GHR, and activates the JAK/STAT and MAPK pathways and is internalized. The internalization leads to extinguishing of the GH signal, and the GHR is recycled for further rounds of activity. Two naturally occurring isoforms of the GHR arise from alternative splicing-one with an alternate exon 3, and the other with an alternate exon 9. The alternative exon 9 isoform yields a protein with only amino acids 1-279, and virtually none of the intracellular domain. This isoform cannot transduce the GH signal and yields higher molar quantities of GHBP (than wild-type GHR), and therefore acts as a GH "sink" (88). The GHR isoform lacking exon 3 has a high prevalence, and may be associated with altered GH signaling, although the direction of the alteration is not clear(89-92).

Figure 18. Growth Hormone Receptor

Defects in the GH signaling pathway have been demonstrated to be associated with postnatal growth failure. Mutations of Stat5b were reported in patients with severe growth failure. Several mutations of Stat5b gene have been reported. Although patients had a phenotype similar to that of congenital GH deficiency or GHR dysfunction, clinical and biochemical features (including normal serum GHBP concentrations) and immune deficiency(93) distinguish patients with STAT5b defects from patients with GHR defects.  It also appears that STAT5b mutations are associated with hyperprolactinemia.  It remains unclear whether the hyperprolactinemia is a direct or indirect effect of STAT5b mutations (94).


In humans, the extracellular portion of GHR is enzymatically cleaved and functions as the GH-Binding Protein (GHBP) (95). GHBP presumably serves to maintain GH in an inactive form in the circulation and to prolong the half-life of GH. Serum levels of GHBP are therefore used as a surrogate marker for the presence of GHR, and abnormal levels-both elevated and decreased-may indicate abnormality in the GHR (96,97). Of note is that mutations have also been described in individuals with 'normal' GHBP levels. GHI secondary to GHR mutations are mostly autosomal recessive mutations, but dominant negative mutations have also been described. Individuals with heterozygote mutations in GHR may present with significant short stature (98). Mutations in GHR have also been associated with idiopathic short stature (ISS) (99-101). The original reports of GHR mutation described limited elbow extension and blue sclera, but these findings are not universal.


Many genetic abnormalities have been described in GHR, including nonsense mutations, missense mutations, macrodeletions, microdeletions and splice site changes. Of the latter, one of the most interesting is the "E180E" mutation, wherein an exonic adenosine is converted to a guanine, converting GAA to GAG, which would be predicted to not change the amino acid structure of GHR (both GAA and GAG encode glutamic acid). On this basis, this "silent polymorphism" would be expected to have no phenotype, but in reality, causes GH resistance and extreme short stature by activation of a cryptic splice site. This mutation was noted in Loja and El Oro, Ecuador in two large cohorts. This identical mutation has also been identified in Jews of Moroccan descent, suggesting that this mutation dates back to at least the 1400’s and that the Ecuadorian cohorts, therefore, represent Sephardic Jews who left Spain around the time of the Inquisition at the end of the fifteenth century, CE (102). Another splice site mutation at position 785-3 (C>A in the intron 7) was recently described in a patient and mother with short stature and extremely elevated GHBP (103). The consequence of this novel mutation is a truncated GHR which lacks the transmembrane domain (encoded by exon 8) and the cytoplasmic domain. It was hypothesized by the authors that this GHR variant cannot attach to the cell membrane, and the continual secretion into the circulation results in the elevated levels of serum GHBP detected in the patient and his mother. The presence of the wild-type GHR allele presumably permits some level of normal GH-induced action.


Insulin-Like Growth Factor 1 (IGF1)


Many of growth hormone's physiologic actions are mediated through the insulin-like growth factor, IGF1 (formerly referred to as somatomedin C). Serum IGF1 levels are commonly measured as a surrogate marker of GH status, since IGF1 displays minimal circadian fluctuation in serum concentration. IGF1 plays a critical role in both prenatal and postnatal growth, signaling through the IGF1 as well as the insulin receptor. IGF1 circulates as a ternary complex consisting of IGF1, IGBP3 and ALS.  The IGF1 gene is located on 12q22-24.1, consists of six exons and spans over 45 kb of genomic DNA (Figure 19). Alternative splicing produces two distinct IGF1 transcripts, IGF1-A and IGF1-B. Woods et al described a male of a consanguineous union with prenatal (intrauterine) and postnatal growth retardation, sensorineural deafness and mental retardation (104). DNA analysis showed a homozygous partial deletion of the IGF1 gene (104) (131). Subsequently, additional cases have been described (105,106).

Figure 19. Insulin-Like Growth Factor 1

Mice engineered to completely lack Igf1 (Igf1 knockouts) are born 40% smaller than their normal littermates (107,108). Recent studies of a hepatic-only Igf1 knockout (KO) mouse, however, demonstrate that IGF1 functions primarily in a paracrine or autocrine role, rather than in an endocrine role (109). Liver specific Igf1 knock-out mice, were found to have a 75% reduction in serum Igf1 levels but were able to grow and develop (nearly) normally (109,110) with a mild phenotype developing only late in life (109). A further decrease in serum IGF1 levels of 85% was observed when double gene KO mice were generated lacking both the acid labile subunit (ALS) and hepatic IGF1. Unlike the single hepatic-only IGF1-KO's, these mice showed significant reduction in linear growth as well as 10% decrease in bone mineral density (111). Thus, as illustrated by the combination liver specific IGF1+ALS knock-out mouse model, there likely exists a threshold concentration of circulating IGF1 that is necessary for normal bone growth and suggests that IGF1, IGFBP3, and ALS may play an important role in bone physiology and the pathophysiology of osteoporosis.


In humans, homozygous mutations in ALS result in mild postnatal growth retardation, insulin resistance, pubertal delay, unresponsiveness to GH stimulation tests, elevated basal GH levels, low IGF1 and IGFBP3 levels and undetectable ALS (112-114). Although it is not clear why postnatal growth is mildly affected, it might be due to increased GH secretion due to loss of negative feedback regulation by the low circulating IGF1. Increased GH secretion could then up-regulate the functional GH receptor increasing local IGF1 production, thus protecting linear growth(93) (Figure 20). Over a dozen inactivating mutations of the IGFALS gene have been described in 21 patients with ALS deficiency (115). 

Figure 20. Savage MO Camacho-Hubner C, David A, et al. 2007” Idiopathic short stature: will genetics influence the choice between GH and IGF1 therapy?” Eu J of Endocrine 157:S33 Society of European Journal of Endocrinology (2007). Reproduced by permission. Reprinted with permission(116).

Elevated IGF1 levels has recently been associated with colon, prostate and breast cancer (117-119) and the association was strongest when an elevated IGF1 was combined with a decreased IGFBP3 level. This combination-expected to yield more bioactive IGF1-may merely reflect the tumorigenic process, rather than demonstrate causality. Importantly, GH treatment induces a rise in both IGF1 as well as IGFBP3 (120), and therefore would not be expected to increase cancer risk in normal individuals.


Table 5. Summary of IGF1 Function in Different Systems and its Effects (121)

IGF1 Function 

IGF1 Deficiency

Intrauterine Growth

IUGR

Postnatal Growth

Short Stature

CNS

Neurodegenerative disease

Insulin sensitization/improvement of glucose disposal/beta cell proliferation

Type 1 and Type 2 Diabetes


IGF1 Excess

Mitosis/Inhibition of apoptosis 

Malignancy

IGF1 Deficiency

IGF1 deficiency can be classified based on decreased IGF1 synthesis (primary) or decreased IGF1 secondary to decreased or inactive GH (secondary) (122) (see Table 6).


Table 6.  IGF1 Deficiency

Primary IGF1 Deficiency (normal or elevated GH levels) 

1.             Defects in IGF1 Production:

1.     Mutation in IGF1 gene or bioinactive IGF1

2.     GHR receptor signaling defects (JAK/STAT)

3.     Mutations in ALS gene

4.     Factors effecting IGF1 production (malnutrition, liver, inflammatory bowel disorders, celiac disease)

        Defects in IGF1 Action:

1.     IGF1 resistance due to receptor or post-receptor defects

2.     Factors inhibiting IGF1 binding to IGF1R (increased IGFBPs and presence of IGF1 antibodies)

        Defects in GH Action:

1.     Factors inhibiting (increased GHBPs and presence of GH antibodies)

2.     GH receptor defects (decreased GH receptors, GHR antibodies, GHR gene defects)

I.               Secondary IGF1 Deficiency (decreased GH levels)

        Decreased GH production

1.     Defects in GH gene

2.     Defects in GHRH or GHRH receptor

3.     Neocortical/psychological

        Defects in hypothalamus and pituitary

Recombinant Human IGF1 (rhIGF1)


rhIGF1 is useful in the treatment of primary IGF1 deficiency resulting from abnormalities of the GH molecule (resulting in a bioinactive GH), the GH receptor (known as Laron syndrome), or GH signaling cascade (123). Studies have shown that rhIGF1 significantly improves height in children unresponsive to rhGH (124,125), and clinical trials clearly demonstrated better response to IGF1 therapy when initiated at an early age (126).


FDA approved conditions for rhIGF1 treatment for children with (127):

  1. Severe primary IGF1 deficiency
  2. GH gene deletions who have developed neutralizing antibodies to GH


Severe primary IGF1 deficiency is defined by:

  1. Height SD score is less than -3SD
  2. Basal IGF1 level is below -3SD
  3. Normal or elevated GH


The recommended starting dose of rhIGF1 is 40-80 microgram/kg twice daily by subcutaneous injection.  If it is tolerated well for at least one week, the dose may be increased by 40 microgram/kg per dose, to the maximum dose of 120 microgram/kg per dose (128).


The most common side effects of IGF1 treatment are pain at injection site and headaches which mostly diminishes after first month of treatment (123). Other less common side effects are lipohypertrophy at the injection site, pseudotumor cerebri, facial nerve palsy and hypoglycemia (126). Another effect of IGF1 treatment is a significant increase in fat mass and BMI(129) —in contradistinction to the lipolytic effect of rhGH treatment. Coarsening of facial feature, increased hair growth, slipped capital femoral epiphysis, scoliosis, hypersensitivity, and allergic reactions including anaphylaxis are other prominent side effects and most commonly are seen during puberty. Growth of lymphoid tissue is a concern which may require tonsillectomy (123).  

Insulin-Like Growth Factor 1 Receptor (IGF1R)

The receptor for IGF1 is structurally related to the insulin receptor and similarly has tyrosine kinase activity (Figure 21). IGF1R is located on 15q25-26. The mature (human) IGF1 receptor contains 1337 amino acids and has potent anti-apoptotic activity (130). The IGF1 receptor transduces signals from IGF1, IGF2 and insulin. However, murine data suggest that initially (in the fetus) only the IGF2 signal is operational, while later on in development, both IGF1 and IGF2 (and probably insulin) signal through the IGF1R (131). Hemizygosity for IGF1R has been reported in a single patient (and appears likely in seven others) with IUGR, microcephaly, micrognathia, renal anomalies, lung hypoplasia and delayed growth and development (132). Murine and human studies have shown that mutations in IGF1R result in combined intrauterine and postnatal growth failure (100), confirming the critical role of the IGF system on embryonic, fetal and postnatal growth. A novel heterozygous mutation in the tyrosine kinase domain of the IGF1R gene was recently identified in a family with short stature. The mutation, a heterozygous 19-nucleotide duplication within exon 18 of the IGF1R gene, results in a haploinsuffiency of IGF1R protein due to nonsense mediated mRNA decay (133).

Figure 21. Insulin-Like Growth Factor 1 Receptor

In summary, IGF1 and IGF1R mutations should be considered if a child presents with the following:

  1. Intrauterine and postnatal growth retardation
  2. Microcephaly
  3. Mental retardation
  4. Developmental delay
  5. Sensorineural deafness
  6. Micrognathia
  7. Very low or very high levels of serum IGF1


Insulin-Like Growth Factor 2


IGF2 is thought to be a major prenatal growth hormone and less important in post-natal life.

The human gene, IGF2, is located on 11p15.5 (Figure 22). Chromosome 11p15.5 carries a group of maternally (IGF2) and paternally (H19) imprinted genes that crucial for the fetal growth. Genetic or epigenetic changes in the 11p15.5 region alter the growth (134). IGF2 is maternally imprinted, meaning that the maternal allele is unexpressed. The close proximity of the INS to IGF2-in addition to nearly 50% amino acid identity-suggest that these genes arose through gene duplication events from a common ancestor gene. IGF2 acts via the IGF1 receptor (as well as the insulin receptor). Over-expression of IGF2 results in overgrowth, similar to that seen in Beckwith-Wiedemann Syndrome (which can be due to loss of imprinting, effectively doubling IGF2 expression). A mouse model overexpressing Igf2 demonstrates increased body size, organomegaly, an omphalocele, cardiac, adrenal and skeletal abnormalities, suggestive of Beckwith-Wiedemann and Simpson-Golabi-Behmel syndromes (135). Interestingly, IGF2expression is normally extinguished by the Wilm's Tumor protein (WT1), providing an explanation for the overgrowth (e.g. hemi-hypertrophy) typically seen in subjects with Wilm's Tumor (136). In contrast, mice without a functional Igf2 (Igf2 knockouts) are born 40% smaller than their normal littermates (identical to Igf1 knockouts).

Figure 22. Insulin-Like Growth Factor 2

Recent reports on individuals with severe intrauterine growth retardation showed maternal duplication of 11p15 (137). Furthermore, individuals with Silver-Russell-syndrome (SRS, also known as Russell-Silver syndrome) have been found to have an epimutation (demethylation) associated with biallelic expression of H19 and down regulation of IGF2 (138,139). Russell-Silver syndrome is a congenital disorder characterized by intrauterine and postnatal growth retardation, typical facial features (triangular face, micrognathia, frontal bossing, downward slanting of corners of the mouth), asymmetry, and clinodactyly. Other chromosomal abnormalities such as maternal uniparental disomy on chromosome 7 also have been shown in 10% of individuals with SRS (140).


A paternally-derived balanced chromosomal translocation that disrupted the regulatory regions of the predominantly paternally expressed IGF2 gene was described in a woman with short stature, history of severe intrauterine growth retardation (-5.4 SDS), atypical diabetes and lactation failure (141).


Insulin-Like Growth Factor 2 Receptor


A receptor for IGF2, the IGF2R, has been identified, but does not appear to be the mediator of IGF2's growth promoting action. IGF2R is located on 6q26, and encodes a receptor unrelated to the IGF1 or insulin receptor (Figure 23). IGF2R is also the mannose-6-phosphate receptor and serves as a negative modulator of growth (for all IGF's and also insulin). Its main role in vivo is probably as a tumor suppressor gene. While IGF2 is maternally imprinted, mouse Igf2R is paternally imprinted. There is some evidence that (in a temporally-limited fashion) IGF2R is also paternally imprinted in humans. Somatic mutations have been found in hepatocellular carcinoma tissue (heterozygous mutations associated with loss of the other allele), but no germ-line mutations have been identified in individuals with growth abnormalities.

Figure 23. Insulin-Like Growth Factor 2 Receptor

Insulin


In addition to its glycemic and metabolic roles, insulin functions as a significant growth promoting/anabolic agent. The insulin gene (INS) is located on Chr 11p15.5 and comprises 3 exons (Figure 24). Insulin's role in fetal growth is quite significant, as demonstrated by hyperinsulinemic babies (e.g. infants of diabetic mothers (IDM)). Insulin's growth promoting activity is mediated through a combination of the insulin and the IGF1 receptors. Mutations in the INS gene have been described in subjects with hyperinsulinemia (and/or hyperproinsulinemia) and diabetes mellitus.

Figure 24. Insulin

Insulin Receptor


The insulin receptor is structurally related to the IGF1 receptor. The gene, INSR, is located on Chr 19p13.2 and contains 22 exons that span over 120 kilobases of genomic DNA (Figure 25). INSR encodes a transmembrane protein with tyrosine kinase activity which is capable of transducing the signals of insulin, IGF1 and IGF2.


Individuals with a mutation in the insulin receptor have been identified and may be the basis for the mythological 'Leprechauns'. They typically have intrauterine growth retardation; small elfin facies with protuberant ears; distended abdomen; relatively large hands, feet, and genitalia; and abnormal skin with hypertrichosis, acanthosis nigricans, and decreased subcutaneous fat. At autopsy, several subjects have been found to have cystic changes in the membranes of gonads and hyperplasia of pancreatic islet cells. Severe mutations generally lead to death within months, but more mild mutations have been found in individuals with insulin resistance, hypoglycemia, acanthosis nigricans, normal subcutaneous tissue and may even be associated with a normal growth pattern! Individuals with even 'mild mutations' have been shown to have a thickened myocardium, enlarged kidneys and ovarian enlargement.

Figure 25. Insulin Receptor

SHORT STATURE WITH AN ADVANCED BONE AGE

Aggrecan


Aggrecan has also been shown to be involved in human height and the growth process.  The aggrecan protein is a major constituent of the extracellular matrix of articular cartilage, where it forms large multimeric aggregates. The gene, ACAN, is located on Chr 15q26.1, comprising 19 exons spread over nearly 72 kilobases of genomic DNA.  Exon 1 is approximately 13 kilobases upstream of exons 2-19, which comprise the coding portion of ACAN (142)(Figure 26).  ACAN undergoes alternative splicing yielding several isoforms; the predominant isoform being 2132 amino acids long, with three globular domains (G1-3), an ‘interglobular’ (IG) domain, a keratan sulfate (KS) domain and a chondroitin sulfate (CS) domain, largely encoded in a modular fashion.


Domains G1, G2 contain tanden repeat units rich in cysteine, which are necessary for disulfide bridging, the binding of hyaluronic acid and structural integrity, and are separated by the IGD, which provides a level of rigidity. The KS domain contains 11 copies of a six amino acid motif, while the chondroitin sulfate (CS) domain contains over 100 (non-tandem repeated) copies of the dipeptide Serine-Glycine). The G3 domain appears to function in maintaining proper protein folding and subsequent aggrecan secretion. The attachment of hyaluronic acid, keratan and chondroitin sulfate lead to significant water retention, which is largely responsible for the shock-absorbing character of articular cartilage. Aggrecan is also necessary for proper “chondroskeletal morphogenesis” (143), ensuring the proper organization and sequential maturation of the epiphysis.


In 1999, Kawaguchi reported a mutation in ACAN in subjects with lumbar disc herniation(144), then in 2005, both an autosomal dominant form of spondyloephiphyseal dysplasia (SED-Kimberly type) (145) and an autosomal recessive form (SED-Aggrecan type) (146) were shown to arise from mutations in ACAN.


In 2010, cases of autosomal dominant short stature with an advanced bone age were found to have mutations in ACAN, either with or without osteochondritis dissecans and/or (early-onset) osteoarthritis (147-151). 


Dateki identified a family of four affected where three members had short stature with an advanced bone age, midface hypoplasia, joint problems and brachydactyly, while the fourth had lumbar disc herniation without other findings(152), attesting to phenotypic heterogeneity, even within a family.

Figure 26. ACAN

The Short Stature Homeobox-Containing Gene (SHOX) Haploinsufficiency


The Short Stature Homeobox-containing gene (SHOX) was identified in the pseudoautosomal region 1 on the distal end of the X and Y chromosomes at Xp22.3 and Yp11.3 (Figure 27) (153). Mutations in SHOX were observed in 60-100% of Léri-Weill dyschondrosteosis and Langer mesomelic dysplasia (154,155).  Turner syndrome is almost always associated with the loss of SHOX gene because of numerical or structural aberration of X chromosome (156). Today it is estimated that SHOX mutations occur with an incidence of roughly 1:1,000 newborns, making mutations of this gene one of the most common genetic defects leading to growth failure in humans.

Figure 27. SHOX. Reprinted with Permission. www.shox.uni.hd.de

Genes in pseudoautosomal region 1 do not undergo X inactivation, therefore, healthy individuals express two copies of the SHOX gene, one from each of the sex chromosomes in both 46,XX and 46,XY individuals. The SHOX gene plays an important role in linear growth and is involved in the following:

  1. Intrauterine linear skeletal growth
  2. Fetal and childhood growth plate in a developmentally specificpattern and responsible for chondrocytedifferentiation and proliferation (157).
  3. A dose effect: SHOX haploinsufficiency associated with short stature. In contrast, SHOX overdose as seen in sex chromosome polyploidy is associated with tall stature.


A large number of unique mutations (mostly deletions and point mutations) of SHOX have been described (154,156,158). SHOX abnormalities are associated with a broad phenotypic spectrum, ranging from short staturewithout dysmorphic signs as seen in idiopathic short stature (ISS) to profound Langer’s mesomelic skeletal dysplasia,a form of short stature characterized by disproportionate shortening of the middle segments of the upper arms (ulna) and lower legs (fibula) (159).  In contrast to many other growth disorders such as growth hormone deficiency, SHOXdeficiency is more common in girls.


Rappold et al developed a scoring system to determine the phenotypic spectrum of SHOX deficiency in children with short stature and identify patients for SHOX molecular testing (158).  The authors recommend a careful examination including measurement of body proportions and X-ray of the lower legs and forearm before making the diagnosis of ISS. The scoring system consists of three anthropometric variables (arm span/height ratio, sitting height/height ratio and BMI), and five clinical variables (cubitus valgus, short forearm, bowing of forearm, muscular hypertrophy and dislocation of the ulna at the elbow). Based on the scoring system, authors recommend testing for SHOX deficiency for the individuals with a score greater than four or seven out of a total score of 24 (Table 7).

The recent data show that GH treatment is effective in improving linear growth of patients with SHOX mutations (159).


Table 7.  Scoring system for identifying patients that qualify for short-stature homeobox containing gene (SHOX) testing based on clinical criteria. Reprinted with permission(159)

Score item  

Criterion

Score points

Arm span/height ratio

<96.5%

2

Sitting height/height ratio

>55.5%

2

Body–mass index

>50th percentile

4

Cubitus valgus

Yes

2

Short forearm

Yes

3

Bowing of forearm

Yes

3

Appearance of muscular hypertrophy

Yes

3

Dislocation of ulna (at elbow)

Yes

5

Total

24


Noonan Syndrome


Noonan syndrome (NS) is a relatively common genetic disorder with the incidence of between 1:1000 and 1:4000 (160). NS is inherited in an autosomal dominant manner, and sporadic cases are not uncommon (50-60%) (161). NS is characterized by short stature, cardiac defects (most commonly pulmonary stenosis and hypertrophic cardiomyopathy), facial dysmorphism (down-slanting, antimongoloid palpebral fissures, ptosis, and low-set posteriorly rotated ears), webbed neck, mild mental retardation, cryptorchidism, feeding difficulties in infancy. The phenotype is variable between affected members of the same family and becomes milder with age (162).


Nearly 50% of patients with NS have gain-of-function mutations in protein tyrosine phosphatase nonreceptor type 11 (PTPN11), the gene encoding the cytoplasmic tyrosine phosphatase SHP-2, which regulates GH signaling by dephosphorylating STAT5b, resulting in down-regulation of GH activity (163). Mutations in four other genes (KRAS, SOS1, NF1 and RAF1) involved in RAS/MAPK signaling systems have been identified in patients with the NS phenotype and related disorders including LEOPORD, Costello, and cardio-facial-cutaneous syndromes (Figure 28) (164).

Figure 28. Reprinted with permission(164)

Although identifying these mutations has contributed to better understanding of the pathogenesis of NS, it appears that the genotype does not completely correlate with the phenotype, e.g. short stature in patients with NS. Several studies have shown that the subjects carrying gain of function mutations of PTPN11 had lower IGF1 levels, poor growth response, and resistance to GH therapy compared to subjects without PTPN11 mutations (165,166).  However, data from one large study of individuals with NS did not demonstrate the same correlation between PTPN11 mutations and short stature(160). However, more recent studies showed significant improvement in final adult height in individuals with NS regardless of their mutation type (167,168).


DIAGNOSIS


Diagnosis of GH deficiency during childhood and adolescence is frequently challenging. Children whose height are below the 3rd percentile or -2 SD and have decreased growth velocity require clinical evaluation. Evaluation should begin with a detailed past medical history, family history, diet history, detailed review of prior growth data (including the initial post-natal period) and a thorough physical examination (169). Together, these should help the clinician identify the pattern and cause of growth failure, such as fetal growth restriction (e.g. SGA and IUGR), chronic illness, malnutrition/malabsorption, hypothyroidism, skeletal abnormalities or other identifiable syndromes, such as Turner syndrome. Once growth hormone deficiency is suspected, further testing of the hypothalamic-pituitary axes (including but not limited to the GH-IGF axis) along with radiological evaluation, should be performed (Table 8). It is important to note that the tests cannot be performed simultaneously, or in random order. Certain conditions (e.g. Hypothyroidism and Celiac disease) may mask the presence of others (e.g. GH deficiency), therefore requiring to a step-wise approach with screening tests preceding specific examinations. Since growth failure generally occurs outside of GHD, only those children with signs or symptoms undergo expensive, invasive and non-physiologic GH provocative testing.


Table 8. Guidelines for Initial Clinical Evaluation of a Child with Growth Failure

Evaluation 

Key elements

Birth history 

Gestational age, birth weight and length, delivery type, birth trauma, hypoglycemia, prolonged jaundice.

Past medical and surgical history 

Head trauma, surgery, cranial radiation, CNS infection.

Review of systems 

Appetite, eating habits, bowel movements.

Chronic illness 

Anemia, Inflammatory Bowel Disease, cardiovascular disease, renal insufficiency, etc.

Family history 

Consanguinity, parents and siblings’ heights, family history of short stature, delayed puberty.

Physical examination 

Body proportions (upper/lower segment ratios, arm span), head circumference, microphallus, dysmorphism, and midline craniofacial abnormalities.

Growth pattern 

Crossing of percentiles, failure to catch-up.

Screening Tests 

CBC, BCP, ESR, Celiac screening, TSH and Free T4, UA, IGF1, IGFBP3, Bone age (and a Karyotype for females)


Growth Charts


The growth pattern is a key element of growth assessment and is best studied by plotting growth data on an appropriate growth chart. US growth charts were developed from cross-sectional data provided by the National Center for Health Statistics and updated in 2000 (170), with body mass index included in this newest set. The supine length should be plotted for children from birth through age 3 years and standing height plotted when the child is old enough to stand, generally after 2 years of age. Ideally, growth data is determined by evaluating subjects at regular (optimally at 3 month) intervals, with the same stadiometer, and with the same individual obtaining the measurements, whenever possible. Three months is the minimal time interval needed between measurements to calculate a reliable growth velocity, and a six to twelve-month interval is optimal. Age and pubertal staging must be considered when evaluating the growth velocity, with the understanding that there is great individual variation in the onset and rate of puberty (171).


Deviations across height percentiles should be noted and evaluated further when confirmed, with the understanding that during the first two years of life, the crossing of length and/or weight percentiles may reflect catch-up or catch-down growth. Crossing percentiles during this period is not always physiological, and must be examined in the context of family, prenatal, birth and medical histories. Additionally, between two and three years of age, statural growth measurement changes from supine to erect, and may also introduce variation. Growth below the normal range (e.g.>-2SD) even without further deviation is consistent with (but not pathognomonic of) GH deficiency. Short stature with a low BMI suggests an abnormality of nutrition/GI tract (e.g. malnutrition, Celiac Disease, etc.), while short stature with an elevated BMI suggests hypothyroidism, Cushing’s syndrome, or a central eating disorder, such as Prader-Willi syndrome, etc.


Figures 29-31 represent growth charts of children studied by the authors who have genetic defects leading to isolated growth hormone deficiency.

Figure 29. Growth pattern in children with isolated GH deficiency (Type 1A)

Figure 30. Growth pattern in children with isolated GH deficiency (Type 1B)

Figure 31. Growth pattern in children with isolated GH deficiency (Type 2)

Most children with GH deficiency have normal birth weight and length. However, in most cases, postnatal growth becomes severely compromised. This can be seen even in the first months of life. Although such children may show a normal growth pattern during the first 6 months, growth failure will eventually occur, as GH takes on a more physiologically dominant role and a child’s growth falls below the normal range.


Radiologic Evaluation


The most commonly used system to assess skeletal maturity is to determine the ‘bone age’ of the left hand and wrist, using the method of Greulich and Pyle (172). Children younger than 2 years of age should have their bone age estimated from x-rays of the knee. Tanner and Whitehouse and their colleagues developed a scoring system for each of the hand bones as an alternative method to the method of Greulich and Pyle (173).


Adult height prediction methods estimate adult height by evaluating height at presentation relative to normative values for chronological or bone age. Such methods have been utilized for approximately 60 years (174) and are generally considered accurate in evaluating healthy children with a ‘normal’ growth potential (175,176). Several different methods have been produced and are currently in widespread use, including those of Bayley-Pinneau, the Tanner-Whitehouse-Marshall-Carter and Roche-Wainer-Thissen.


In 1946, Bayley initially described how final height could be estimated from the present height and the bone age, revising the method in 1952 to use the bone age assessment method of Greulich and Pyle (172). They developed what is commonly known as the predicted adult height (PAH) method of Bayley-Pinneau (BP). Tables have been developed for the BP method, listing the proportion of adult height attained at different bone ages, using longitudinal growth data on 192 healthy children in the US. Three tables – average, advanced and retarded – correct for possible differences between CA and BA of more than one year (177). The Bayley-Pinneau PAH method is applicable from age 8 years onwards.


Tanner, Whitehouse, Marshall and Carter developed an adult height prediction model based on current height, the mid-parental height, the age of menarche in girls and the ‘Tanner’ bone age (173). This PAH method (‘TW2’) was developed on the longitudinal data of 211 healthy, British children. TW2 differs from the BP method in that the TW2 lowers the minimal age of prediction to 4 years, and also allows for a quantitative effect of BA, while BP gives a semi-quantitative effect of bone age (i.e. delayed, normal or advanced).


The PAH method of Roche-Wainer-Thissen (RWT) was derived from longitudinal data on approximately 200 “normal” Caucasian American children in southwestern Ohio, at the Fels Research Institute (178). The RWT PAH method assesses the subject’s height, weight, BA and mid-parental height (MPH) and then applies regression techniques to determine the mathematical weighting to be applied to the four variables. The RWT method was designed to allow final height prediction from a single visit, but is only applicable when greater than half of the bones are not fully mature.


Since both the bone age assessments and height prediction methods are created from healthy children (and often children from a single ethnic group and region), their use in ‘other’ populations is potentially inappropriate. In fact, Tanner et al state that their method is applicable to both boys and girls with short stature, but caution that “In clearly pathological children, such as those with endocrinopathies, they do not apply”. Similarly, Roche et al suggest caution when applying the RWT PAH method in ‘non-white and pathological populations’ (178). Zachmann et al reported that the RWT and TW2 methods (which are more BA-reliant) are better when growth potential is normal relative to the BA, however, in conditions with “…abnormal and incorrigible growth patterns…” the BP method was more accurate, stating that with a “non-normal bone maturation to growth potential relationship, the ‘coefficient and regression equations’ (RWT and Tanner) cause an over-prediction of adult height” (179).


As stated above, these methods are based on healthy children and assume that the growth potential is directly proportional to the amount of time left prior to epiphyseal fusion as measured by the bone age. While this is correct for some of the children seen by the pediatric endocrinologist (e.g. healthy children, children with GH deficiency), it is not correct for many others with abnormal growth (e.g. children born SGA, children with idiopathic short stature, Turner syndrome and chronic renal failure). It is likely also inappropriate for children with an abnormal tempo of maturation (e.g. children with Russell-Silver syndrome, precocious puberty and congenital adrenal hyperplasia). In such children, standard growth prediction methods should be used only as ‘general guides’, if at all. Table 9 summarizes these 4 methods.


Table 9. Summary of Methods Used for PAH

Methods

Parameters

BP

Height, BA, CA

TW2

Height, BA, CA, MPH, the age of menarche in girls

RWT

Height, weight, BA, MPH

Khamis-Roche

Height, weight, MPH


Biochemical Evaluation of GH Deficiency

As growth hormone is secreted in a pulsatile manner (usually 6 pulses in 24 hours and mainly during the night) with little serum GH at any given time, several methods have been recommended to assess the adequacy of GH secretion:

  1. Stimulation testing: GH provocation utilizing arginine, clonidine, glucagon, L-Dopa, insulin, etc. This practice generally measures pituitary reserve-or GH secretory ability-rather than endogenous secretory status. Trained individuals should perform the GH stimulation test according to a standardized protocol, with special care taken with younger children/infants.
  2. GH-dependent biochemical markers: IGF1 and IGFBP3: Values below a cut-off less than -2 SD for IGF1 and/or IGFBP3 strongly suggest an abnormality in the GH axis if other causes of low IGF have been excluded. Age and gender appropriate reference ranges for IGF1 and IGFBP3 are mandatory.
  3. 24-hour or Overnight GH sampling: Blood sampling at frequent intervals designed to quantify physiologic bursts of GH secretion.
  4. IGF generation test: This test is used to assess GH action and for the confirmation of suspected GH insensitivity. GH is given for several days (3-5 days) with serum IGF1 and IGFBP-3 levels measured at the start and end of the test. A sufficient rise in IGF1 and IGFBP-3 levels would exclude severe forms of GH insensitivity (99,171).


Failure to raise the serum GH level to the threshold level in response to provocation suggests the diagnosis of GH deficiency, while a low IGF1 and/or IGFBP3 level is supportive evidence. Although pharmacological GH stimulation tests have known difficulties such as poor reproducibility, arbitrary cut-off limits, varying GH assays, they remain the most easily available and accepted tools to evaluate pituitary GH secretory capacity. GH stimulation test results should be interpreted carefully in conjunction with pubertal status and body weight. Puberty and administration of the sex steroids increase GH response to stimulation tests (180). To prevent false positive results, some centers use sex steroid priming in prepubertal children prior to GH stimulation testing (181). In obese children, the normal regulation of the GH/IGF1 axis is disturbed and GH secretion is decreased. IGF1 levels are very sensitive to the nutritional status, while IGFBP3 are less so. Additionally, the normative range for IGF1 and IGFBP3 values are extremely wide, often with poor discrimination between normal and pathological. Age/pubertal stage and gender-specific threshold values must be utilized for both IGF1 and IGFBP3.


Summary of Diagnosis of GH deficiency

Children with severe GH deficiency can usually be diagnosed easily on clinical grounds, and fail GH stimulation tests. Studies have shown that despite clinical evidence of GH deficiency, some children may pass GH stimulation tests (171). In the case of unexplained short stature, if the child meets most of the following criteria, a trial of GH treatment should be initiated (182):

  1. Height >2.25 SD below the mean for age or >2 SD below the mid-parental height percentile,
  2. Growth velocity <25th percentile for bone age,
  3. Bone age >2 SD below the mean for age,
  4. Height prediction is significantly below the mid-parental height,
  5. Low serum insulin-like growth factor 1 (IGF1) and/or insulin-like growth factor binding protein 3 (IGFBP3) for bone age and gender
  6. Other clinical features suggestive of GH deficiency.


Key elements that may indicate GH deficiency  

  1. Height more than 2 SD below the mean.
  2. Neonatal hypoglycemia, microphallus, prolonged jaundice, or traumatic delivery.
  3. Although not required, a peak GH concentration after provocative GH testing of less than 10 ng/ml.
  4. Consanguinity and/or a family member with GH deficiency.
  5. Midline CNS defects, pituitary hypo- or aplasia, pituitary stalk agenesis, empty sella, ectopic posterior pituitary (‘bright spot’) on MRI.
  6. Deficiency of other pituitary hormones: TSH, PRL, LH/FSH and/or ACTH deficiency.


Many practitioners consider GH stimulation tests to be optional in the case of clinical evidence of GH deficiency, in patients with a history of surgery or irradiation of the hypothalamus/pituitary region and growth failure accompanied by additional pituitary hormone deficiencies. Similarly children born SGA, with Turner syndrome, PWS and chronic renal insufficiency do not require GH stimulation testing before initiating GH treatment (182).


TREATMENT

The principal objective of GH treatment in children with GH deficiency is to improve final adult height. Human pituitary-derived GH was first used in children with hypopituitarism over 60 years ago, and abruptly ceased in 1985, after the first cases of Creutzfeld-Jacob disease were recognized. Since 1986, recombinant human GH (rhGH) has been the exclusive form of growth hormone used to treat GH deficiency in the United States and most of the world.


Short stature without overt growth hormone deficiency is very well described, and occurs in Turner Syndrome, renal failure, malnutrition, cardiovascular disease, Prader-Willi syndrome, small for gestational age, inflammatory bowel disease, and osteodystrophies- clearly represents the majority of short/poorly growing children in the world. Although not the focus of this discussion, it is important to realize that - in clinical terms - GH therapy is used to treat growth failure, rather than a biochemical GH deficiency. GH therapy in this setting, in combination with disease-specific treatments, generally improves statural growth and final adult height.


The primary goals of the treatment of a child with GH deficiency are to achieve normal height during childhood and to attain normal adult height. Children should be treated with an adequate dose of rhGH, with the dose tailored to that child’s specific condition. FDA guidelines for GH dose vary according to the indication and are given in Table 10 (182).


Administration of rhGH in the evening is designed to mimic physiologic hGH secretion. Treatment is continued until final height or epiphyseal closure (or both) has been recorded. GH therapy, however, should be continued throughout adulthood in the case of GHD, to optimize the metabolic effects of GH and to achieve normal peak bone mass-albeit at significantly lower “adult” doses. Adult GH replacement should only be started after retesting the individual and again demonstrating a failure to reach the new age-appropriate GH threshold, if appropriate.


Table 10. GH Dosage

Indication 

Dose (mg/kg/wk)

GH Deficiency

     Children Pre-pubertal

     Pubertal

     Adults


0.16 – 0.35

0.16 – 0.70

0.04 – 0.175

Turner Syndrome

0.375

Chronic renal insufficiency

0.35

Prader-Willi Syndrome

0.24

SGA

0.48

Idiopathic short stature (ISS)

0.3 – 0.37

SHOX Deficiency

0.35

Noonan Syndrome

0.23 – 0.46


The growth response to GH treatment is typically maximal in the first year of treatment and then gradually decreases over the subsequent years of treatment. First year growth response to rhGH is generally 200% of the pre-treatment velocity, and after several years, averages 150% of the baseline. Height improvements of 1 SD are typically achieved in children with GHD after two years of treatment, and between 2 and 2.5 SD after five or seven years.


GH doses are often increased if catch-up growth is inadequate and/or to compensate for the waning effect of rhGH with time. Cohen et al reported a significant improvement in HV when GH dose was adjusted based on IGF1 levels (183). However, GH dose was almost 3 times higher than mean conventional GH dose when IGF1 levels were titrated to the upper limit of normal. The lack of long-term safety data on high doses of GH and high circulating levels of IGF1 levels should be considered. Therefore, weight-based GH dosing is still recommended by many as the standard of care (184).


It is critically important to maximize height with GH therapy before the onset of puberty. Several investigators have advocated modifying puberty or the production of estrogens by the use of GnRH super-analogues (185,186) and aromatase inhibitors (187-190), respectively, in order to expand the therapeutic window for GH treatment, especially in older males.


The response to GH, however, may vary in children(191). Factors may affect the response to GH therapy including

  1. The etiology of short stature
  2. Age at the start of treatment
  3. Height deficit at the start of treatment
  4. GH dose and frequency
  5. Duration of treatment
  6. Genetic factors


Several studies have reported the association between response to GH therapy and a GHR gene polymorphism, the deletion of exon 3 (GHRd3).  Although some reports showed better response to GH therapy in GHRd3 carriers with different clinical conditions including GHD, Turner syndrome, SGA, and ISS (89,192-195), many others failed to confirm positive effects of GHRd3 on response to GH treatment (196-198).   


Monitoring GH Treatment

Children receiving GH therapy require periodic monitoring. Three-month intervals are commonly chosen to allow for sufficient growth for a meaningful measurement, while minimizing time between dose adjustments/intervention. During follow up visits, height, weight, pubertal status, inspection of injection sites, and a comprehensive clinical exam should be initiated. In clinical practice, there are several parameters to monitor the response to GH treatment; the determination of the growth response (i.e. change in height velocity, ∆HV) being the most important parameter.  These points are summarized in Table 11.


Table 11. Summary of Follow-Up Evaluation

Parameters 

Assessment

Bone age 

12-month intervals to assess the predicted height.

Thyroid Function Test 

6-month intervals, or immediately, if growth velocity decreases.

Serum IGF1 and IGFBP-3 

12-month intervals. Most useful in maintaining GH dose in ‘safe’ region. They do not necessarily correlate with growth velocity.

Metabolic panel, CBC, ESR, HbA1C 

12-month intervals.

Dose adjustment 

Should be based on weight-change, growth response, pubertal stage, comparison to predicted height at each visit, and IGF-I/IGFBP-3 annually.

Adverse Events 

Every visit.


The Safety of GH Treatment

To date, multiple studies have demonstrated the safety of GH therapy (7,169,170,185,199-202). While rhGH treatment is generally considered safe, patients, however, should be monitored closely during treatment. Some of the common side effects seen during GH therapy are scoliosis, slipped capital femoral epiphysis (SCFE), pancreatitis, and pseudotumor cerebri (intracranial hypertension).  An analysis of Genentech’s National Cooperative Growth Study (NCGS) identified eleven cases of adrenal insufficiency (AI) resulting in four deaths.  All eleven cases of AI occurred in patients with organic GH deficiency (n=8,351), yielding an incidence of 132 per 100,000 in this subgroup, and an overall incidence of AI in NCGS was 20 per 100,000 (203). 


Another concern is the use of GH in patients with Prader-Willi syndrome. Early recognition of the syndrome allows earlier intervention to prevent morbidity. Previous studies and data from KIGS showed that earlier initiation of GH treatment in children with PWS significantly improved body composition, muscle tone, growth, and cognition (204).


Fatalities have been reported in patients with Prader-Willi syndrome during or after rhGH therapy (205). Data for children aged 3 years and older showed no statistically significant differences between the GH-treated and untreated groups with respect to cause of death, including respiratory infection or insufficiency (205,206). Although there is no clear evidence that those deaths are related to GH therapy, it was postulated that GH/IGF1 may worsen sleep apnea or hypoventilation via increasing tonsillar/adenoid tissue or worsen pre-existing impaired respiration by increasing volume load (207). However, studies on respiratory function of subjects with Prader-Willi syndrome during rhGH therapy have only demonstrated improved respiratory drive and function (208). In fact, a recent study showed that all subjects tested had abnormal sleep studies/parameters prior to initiating GH treatment, and that GH treatment resulted in an improvement in sleep apnea in the majority of patients with PWS. Importantly, however, a subset had worsening of sleep disturbance shortly after (6 week) starting GH when also developing a respiratory infection (209). Because it is difficult to predict who will worsen with GH treatment, these authors recommend that patients with Prader-Willi syndrome have polysomnography before and 6 weeks after starting rhGH and should be monitored for sleep apnea during upper respiratory tract infections. IGF1 levels should also be monitored.


The data on efficacy and safety of GH treatment in 5220 Turner Syndrome (TS) children during the last 20 years has been reported by NCGS. The incidence of various side effects known to be associated with GH including pseudotumor cerebri, slipped capital femoral epiphysis, and scoliosis was increased in TS patients treated with GH compared with non-TS patients, however, children with TS are known to have a higher incidence of these side effects independent of rhGH treatment (210). Interestingly, type 1 diabetes was increased in GH treated group, most likely unrelated to GH treatment since the predisposition to autoimmune disorders is one of the characteristics of TS. In addition, NCGS data demonstrate a slightly increased incidence of a variety of malignancies in TS, however, this may again be related to the underlying condition, (i.e. not necessarily the rhGH treatment) as girls with TS have been shown to have an increased risk for cancer compared to general population (211). In summary, twenty years of experience in 5220 patients seems reassuring and does not indicate any new rhGH-related safety signals in the TS population (210).


There has been ongoing concern about tumorigenicity of chronically elevated IGF1 levels. It would therefore seem prudent to maintain IGF1 levels in the mid-normal range for age/pubertal stage and gender. Although the long-term consequences of elevated IGF1 levels during childhood are not known, some investigators recommend that dose reductions be considered after the first two years of therapy if IGF1 levels continue to be above the normal range (182).  The report from the Safety and Appropriateness of Growth Hormone Treatments in Europe (SAGhE) in 2012, raised many concerns about the long-term safety of rhGH therapy in children.  SAGhE is a large database established by eight European countries to evaluate the long-term safety of childhood GH treatment between 1980s and 1990s in 30,000 patients.  Preliminary analysis of the patients in France revealed that among patients treated with rhGH, there was a 33% increased relative risk of mortality compared with French general population.  They also noted an increased incidence of bone malignancies and cardiovascular disease (212). However, the data from the Belgian, Swedish the Dutch portions of SAGhE did not support or corroborate the findings that were reported from France (213).

Real and Theoretical adverse events of GH therapy are summarized in Table12.


Table 12.  Real and Theoretical Adverse Events of GH Treatment

Side effects 

Comment

Slipped capital femoral epiphysis (SCFE) 

Unclear whether GH causes SCFE or if it is a result of diathesis and rapid growth induced by the GH. In addition, obesity, trauma, and previous radiation exposure increase the risk for SCFE.  At each visit, patients should be evaluated for knee or hip pain/limp.

Pseudotumor cerebri 

The mechanism is unclear, but it may be a result of GH induced salt and water retention within the CNS. Mostly occurs within the first months of treatment.  It is more common in patients with organic GH deficiency, chronic renal insufficiency, and Turner Syndrome (203).  Complaints of headache, nausea, dizziness, ataxia, or visual changes should be evaluated immediately.

Leukemia 

Numerous large studies have not shown any association between rhGH and leukemia in children without predisposing conditions (200,203,214).

Recurrence risk of CNS tumors 

Extensive studies did not support this possible side effect without risk factors (185,203,215-218)

Risk of primary malignancy

Studies have not shown a higher risk of all-site primary malignancy without a history of previous malignancy (219,220)

Insulin resistance 

Insulin resistance is associated with GH therapy, though it is generally transient and/or reversible and rarely leads to overt diabetes.  Patients with a limited insulin reserve may develop glucose intolerance. HbA1C should be monitored.

Pancreatitis

It may occur in patients with Turner syndrome, and associated risk factors (203).

Hypothyroidism 

Almost 25 % of children may develop declines in serum T4 levels, generally reflecting enhanced conversion of T4 to T3, rather than outright hypothyroidism.

Transient gynecomastia 

These are attributed to anabolic and metabolic effects of GH.

Scoliosis 

It is more common in Turner syndrome and PWS.  Patients should be evaluated for scoliosis at each visit and referred as appropriate

Adrenal Insufficiency

GH decreases the conversion of corticosterone to cortisol by a modulating effect on hepatic 11-beta hydroxysteroid dehydrogenase 1. Thus, endogenous cortisol levels can decrease in GHD patients after initiation of GH treatment. Furthermore, GH therapy may unmask previously unsuspected central ACTH deficiency.  Whether the patients with hypopituitarism are on GH or not, they have a lifelong risk for adrenal insufficiency.  Therefore, they should be monitored closely for adrenal insufficiency and their cortisol dose should be adjusted when GH therapy is started (203).

Sleep apnea/sleep disturbance

GH treatment might worsen sleep apnea/sleep disturbance in patients with Prader-Willi Syndrome, especially during a concomitant respiratory infection.


Transitioning GH Treatment From Childhood to Adulthood


Growing data support the need for continuation of GH treatment in individuals with childhood GH deficiency.  GH treatment provides significant benefits in body composition, bone mineralization, lean body mass, lipid metabolism, and quality of life in adults with GH deficiency (221,222). However, identifying appropriate patients for transitioning from childhood to adult GH therapy remains challenging. The majority of children with a diagnosis of GHD and who are treated with GH do not have a permanent GHD and will not require treatment during adulthood.  Re-evaluation of GH secretory capacity is recommended after completion of linear growth in adolescents with history of childhood GHD (223). However, such re-evaluation requires cessation of GH treatment for at least one month.  Furthermore, there is no established optimal GH stimulation test identified and validated during this transition period. The stimulation test results vary by protocol, and only a few secretagogues (insulin, arginine, and glucagon) are available to confirm GHD.  The cut-off values are also more strict; the peak GH level to establish GHD is <6 mcg/L for the insulin tolerance test and ≤ 3 mcg/L for the glucagon test in young adults (224,225).  It is in agreement that if a patient has severe GHD secondary to organic defects (hypothalamic-pituitary abnormalities, tumors involving pituitary or hypothalamic area, infiltrative diseases, and cranial irradiation), genetic causes of GHD involving one or more additional pituitary hormone deficiencies and has serum IGF-1 level below the normal range at least one month off therapy, are more likely to have permanent GHD and retesting to confirm GHD is unnecessary (221,225). However, children with idiopathic GHD are less likely to have permanent GHD.  In a US study, only one third of patients with idiopathic GHD retested as GHD (226).  In that cohort, authors found age <4 at diagnosis and IGFBP-3 below -2.0 SDS were the strongest predictive factors (100% PPV) for permanent GHD.  In contrast to previous studies (223), low IGF-1 (< -2.0 SDS) did not have significant power to identify permanent GHD unless IGF-1 level was extremely low (-5.3 SDS) (226). 


In summary, current guidelines recommend the measurement of serum IGF-1 levels and a GH stimulation test after cessation of treatment at least one month to determine whether the adolescents with childhood-onset GHD will need ongoing treatment unless they have known  organic or genetic defects in the hypothalamic-pituitary region (221,222,225).


CONCLUSION


The genetic control of human growth is becoming increasingly clear. Many genes have been identified that contribute to the development and function of the pituitary gland including the somatotrope and the GH/IGF1 axis.  Genes encoding “downstream” factors, including the insulin and the insulin receptor, the Short Stature Homeobox and SHP2 affect growth unrelated to growth hormone status, while Aggrecan has been described in cases of short stature with an advanced bone age, as well as in multiple forms of spondyloepiphyseal dysplasia.


Defects in these genes have been shown to be responsible for abnormal growth in humans. Elucidation of these and new genetic factors will provide us with a better understanding of the physiology of growth, and should lead to the improved diagnosis and treatment of individuals with growth abnormalities.


REFERENCES


  1. Wilson TA, Rose SR, Cohen P, Rogol AD, Backeljauw P, Brown R, Hardin DS, Kemp SF, Lawson M, Radovick S, Rosenthal SM, Silverman L, Speiser P, Drug LWPES, Therapeutics C. Update of guidelines for the use of growth hormone in children: the Lawson Wilkins Pediatric Endocrinology Society Drug and Therapeutics Committee. The Journal of Pediatrics. 2003;143(4):415-421.
  2. Savage MO, Simon D, Czernichow PC. Growth hormone treatment in children on chronic glucorticoid therapy. Endocr Dev. 2011;20:194-201.
  3. Slonim AE, Bulone L, Damore MB, Goldberg T, Wingertzahn MA, McKinley MJ. A Preliminary Study of Growth Hormone Therapy for Crohn's Disease. New England Journal of Medicine. 2000;342(22):1633-1637.
  4. Mauras N, George D, Evans J, Milov D, Abrams S, Rini A, Welch S, Haymond MW. Growth hormone has anabolic effects in glucocorticosteroid-dependent children with inflammatory bowel disease: A pilot study. Metabolism. 2002;51(1):127-135.
  5. Touati G, Prieur AM, Ruiz JC, Noel M, Czernichow P. Beneficial effects of one-year growth hormone administration to children with juvenile chronic arthritis on chronic steroid therapy. I. Effects on growth velocity and body composition. The Journal of Clinical Endocrinology and Metabolism. 1998;83(2):403-409.
  6. Hardin DS, Stratton R, Kramer JC, de la Rocha SR, Govaerts K, Wilson DP. Growth Hormone Improves Weight Velocity and Height Velocity in Prepubertal Children with Cystic Fibrosis. Horm Metab Res. 1998;30(10):636-641.
  7. Hardin DS, Ellis KJ, Dyson M, Rice J, McConnell R, Seilheimer DK. Growth hormone improves clinical status in prepubertal children with cystic fibrosis: results of a randomized controlled trial. J Pediatr. 2001;139(5):636-642.
  8. Lin-Su K, Vogiatzi MG, Marshall I, Harbison MD, Macapagal MC, Betensky B, Tansil S, New MI. Treatment with Growth Hormone and LHRH Analogue Improves Final Adult Height in Children with Congenital Adrenal Hyperplasia. J Clin Endocrinol Metab. 2005:jc.2004-2128.
  9. Rosenbloom AL. Mecasermin (recombinant human insulin-like growth factor I). Advances in Therapy. 2009;26(1):40.
  10. Larsen WJ. Human Embryology. Second ed: Churchhill Livingstone, Inc.
  11. De Rienzo F, Mellone S, Bellone S, Babu D, Fusco I, Prodam F, Petri A, Muniswamy R, De Luca F, Salerno M, Momigliano-Richardi P, Bona G, Giordano M, CPHD ISGoGo. Frequency of genetic defects in combined pituitary hormone deficiency: a systematic review and analysis of a multicentre Italian cohort. Clin Endocrinol (Oxf). 2015;83(6):849-860.
  12. Phillips JA, Cogan JD. Genetic basis of endocrine disease. 6. Molecular basis of familial human growth hormone deficiency. J Clin Endocrinol Metab. 1994;78(1):11-16.
  13. Roessler E, Du Y-Z, Mullor JL, Casas E, Allen WP, Gillessen-Kaesbach G, Roeder ER, Ming JE, Ruiz i Altaba A, Muenke M. Loss-of-function mutations in the human GLI2 gene are associated with pituitary anomalies and holoprosencephaly-like features. Proceedings of the National Academy of Sciences of the United States of America. 2003;100(23):13424-13429.
  14. Roessler E, Ermilov AN, Grange DK, Wang A, Grachtchouk M, Dlugosz AA, Muenke M. A previously unidentified amino-terminal domain regulates transcriptional activity of wild-type and disease-associated human GLI2. Hum Mol Genet. 2005;14(15):2181-2188.
  15. França MM, Jorge AAL, Carvalho LRS, Costalonga EF, Vasques GA, Leite CC, Mendonca BB, Arnhold IJP. Novel Heterozygous Nonsense GLI2 Mutations in Patients with Hypopituitarism and Ectopic Posterior Pituitary Lobe without Holoprosencephaly. The Journal of Clinical Endocrinology & Metabolism. 2010;95(11):E384-E391.
  16. Demiral M, Demirbilek H, Unal E, Durmaz CD, Ceylaner S, Ozbek MN. Ectopic Posterior Pituitary, Polydactyly, Midfacial Hypoplasia and Multiple Pituitary Hormone Deficiency due to a Novel Heterozygous IVS11-2A>C(C.1957-2A>C) Mutation in GLI2 Gene. J Clin Res Pediatr Endocrinol. 2019.
  17. Netchine I, Sobrier ML, Krude H, Schnabel D, Maghnie M, Marcos E, Duriez B, Cacheux V, Moers AV, Goossens M, Gruters A, Amselem S. Mutations in LHX3 result in a new syndrome revealed by combined pituitary hormone deficiency. Nat Genet. 2000;25(2):182-186.
  18. Bhangoo APS, Hunter CS, Savage JJ, Anhalt H, Pavlakis S, Walvoord EC, Ten S, Rhodes SJ. Clinical case seminar: a novel LHX3 mutation presenting as combined pituitary hormonal deficiency. The Journal of Clinical Endocrinology and Metabolism. 2006;91(3):747-753.
  19. Raetzman LT, Ward R, Camper SA. Lhx4 and Prop1 are required for cell survival and expansion of the pituitary primordia. Development (Cambridge, England). 2002;129(18):4229-4239.
  20. Sobrier ML, Attié-Bitach T, Netchine I, Encha-Razavi F, Vekemans M, Amselem S. Pathophysiology of syndromic combined pituitary hormone deficiency due to a LHX3 defect in light of LHX3 and LHX4 expression during early human development. Gene expression patterns: GEP. 2004;5(2):279-284.
  21. Machinis K, Pantel J, Netchine I, Leger J, Camand OJ, Sobrier ML, Dastot-Le Moal F, Duquesnoy P, Abitbol M, Czernichow P, Amselem S. Syndromic short stature in patients with a germline mutation in the LIM homeobox LHX4. Am J Hum Genet. 2001;69(5):961-968.
  22. Dattani MT, Martinez-Barbera JP, Thomas PQ, Brickman JM, Gupta R, Martensson IL, Toresson H, Fox M, Wales JK, Hindmarsh PC, Krauss S, Beddington RS, Robinson IC. Mutations in the homeobox gene HESX1/Hesx1 associated with septo-optic dysplasia in human and mouse. Nature Genetics. 1998;19(2):125-133.
  23. Carvalho LR, Woods KS, Mendonca BB, Marcal N, Zamparini AL, Stifani S, Brickman JM, Arnhold IJP, Dattani MT. A homozygous mutation in HESX1 is associated with evolving hypopituitarism due to impaired repressor-corepressor interaction. The Journal of Clinical Investigation. 2003;112(8):1192-1201.
  24. Parks JS, Brown MR, Hurley DL, Phelps CJ, Wajnrajch MP. Heritable disorders of pituitary development. Journal of Clinical Endocrinology and Metabolism. 1999;84(12):4362-4370.
  25. Thomas PQ, Dattani MT, Brickman JM, McNay D, Warne G, Zacharin M, Cameron F, Hurst J, Woods K, Dunger D, Stanhope R, Forrest S, Robinson IC, Beddington RS. Heterozygous HESX1 mutations associated with isolated congenital pituitary hypoplasia and septo-optic dysplasia. Human Molecular Genetics. 2001;10(1):39-45.
  26. Rosenbloom Al, Almonte AS, Brown MR, Fisher DA, Baumbach L, Parks JS. Clinical and biochemical phenotype of familial anterior hypopituitarism from mutation of the PROP1 gene. J Clin Endocrinol Metab. 1999;84(1):50-57.
  27. Turton JPG, Mehta A, Raza J, Woods KS, Tiulpakov A, Cassar J, Chong K, Thomas PQ, Eunice M, Ammini AC, Bouloux PM, Starzyk J, Hindmarsh PC, Dattani MT. Mutations within the transcription factor PROP1 are rare in a cohort of patients with sporadic combined pituitary hormone deficiency (CPHD). Clinical Endocrinology. 2005;63(1):10-18.
  28. Pfäffle RW, DiMattia GE, Parks JS, Brown MR, Wit JM, Jansen M, Van der Nat H, Van den Brande JL, Rosenfeld MG, Ingraham HA. Mutation of the POU-specific domain of Pit-1 and hypopituitarism without pituitary hypoplasia. Science (New York, NY). 1992;257(5073):1118-1121.
  29. Turton JPG, Reynaud R, Mehta A, Torpiano J, Saveanu A, Woods KS, Tiulpakov A, Zdravkovic V, Hamilton J, Attard-Montalto S, Parascandalo R, Vella C, Clayton PE, Shalet S, Barton J, Brue T, Dattani MT. Novel Mutations within the POU1F1 Gene Associated with Variable Combined Pituitary Hormone Deficiency. The Journal of Clinical Endocrinology & Metabolism. 2005;90(8):4762-4770.
  30. Dattani MT. Growth hormone deficiency and combined pituitary hormone deficiency: does the genotype matter? Clinical Endocrinology. 2005;63(2):121-130.
  31. Rizzoti K, Brunelli S, Carmignac D, Thomas PQ, Robinson IC, Lovell-Badge R. SOX3 is required during the formation of the hypothalamo-pituitary axis. Nat Genet. 2004;36(3):247-255.
  32. Foster JW, Graves JA. An SRY-related sequence on the marsupial X chromosome: implications for the evolution of the mammalian testis-determining gene. Proceedings of the National Academy of Sciences of the United States of America. 1994;91(5):1927-1931.
  33. Stevanović M, Lovell-Badge R, Collignon J, Goodfellow PN. SOX3 is an X-linked gene related to SRY. Hum Mol Genet. 1993;2(12):2013-2018.
  34. Collignon J, Sockanathan S, Hacker A, Cohen-Tannoudji M, Norris D, Rastan S, Stevanovic M, Goodfellow PN, Lovell-Badge R. A comparison of the properties of Sox-3 with Sry and two related genes, Sox-1 and Sox-2. Development. 1996;122(2):509-520.
  35. Laumonnier F, Ronce N, Hamel BCJ, Thomas P, Lespinasse J, Raynaud M, Paringaux C, van Bokhoven H, Kalscheuer V, Fryns J-P, Chelly J, Moraine C, Briault S. Transcription Factor SOX3 Is Involved in X-Linked Mental Retardation with Growth Hormone Deficiency. The American Journal of Human Genetics. 2002;71(6):1450-1455.
  36. Woods KS, Cundall M, Turton J, Rizotti K, Mehta A, Palmer R, Wong J, Chong WK, Al-Zyoud M, El-Ali M, Otonkoski T, Martinez-Barbera J-P, Paul Thomas Q, Iain Robinson C, Lovell-Badge R, Karen Woodward J, Mehul Dattani T. Over- and Underdosage of SOX3 Is Associated with Infundibular Hypoplasia and Hypopituitarism. The American Journal of Human Genetics. 2005;76(5):833-849.
  37. Goosens M, Brauner R, Czernichow P, Duquesnoy P, Rapaport R. Isolated growth hormone (GH) deficiency type 1A associated with a double deletion in the human GH gene cluster. Journal of Clinical Endocrinology and Metabolism. 1986;62(4):712-716.
  38. Wagner JK, Eblé A, Hindmarsh PC, Mullis PE. Prevalence of human GH-1 gene alterations in patients with isolated growth hormone deficiency. Pediatric Research. 1998;43(1):105-110.
  39. Wajnrajch MP, Gertner JM, Harbison MD, Chua SC, Leibel RL. Nonsense mutation in the human growth hormone releasing hormone receptor causes growth failure analogous to the little (lit) mouse. Nature Genetics. 1996;12:88-90.
  40. Binder G, Nagel BH, Ranke MB, Mullis PE. Isolated GH deficiency (IGHD) type II: imaging of the pituitary gland by magnetic resonance reveals characteristic differences in comparison with severe IGHD of unknown origin. Eur J Endocrinol. 2002;147(6):755-760.
  41. Mullis PE, Robinson ICAF, Salemi S, Eble A, Besson A, Vuissoz J-M, Deladoey J, Simon D, Czernichow P, Binder G. Isolated Autosomal Dominant Growth Hormone Deficiency: An Evolving Pituitary Deficit? A Multicenter Follow-Up Study. J Clin Endocrinol Metab. 2005;90(4):2089-2096.
  42. Cogan JD, Ramel B, Lehto M, Phillips J, Prince M, Blizzard RM, de Ravel TJ, Brammert M, Groop L. A recurring dominant negative mutation causes autosomal dominant growth hormone deficiency--a clinical research center study. The Journal of Clinical Endocrinology and Metabolism. 1995;80(12):3591-3595.
  43. Takahashi Y, Shirono H, Arisaka O, Takahashi K, Yagi T, Koga J, Kaji H, Okimura Y, Abe H, Tanaka T, Chihara K. Biologically inactive growth hormone caused by an amino acid substitution. Journal of Clinical Investigation. 1997;100(5):1159-1165.
  44. McCarthy EM, Phillips JA. Characterization of an intron splice enhancer that regulates alternative splicing of human GH pre-mRNA. Human Molecular Genetics. 1998;7(9):1491-1496.
  45. Cogan JD, Prince MA, Lekhakula S, Bundey S, Futrakul A, McCarthy EM, Phillips JA. A novel mechanism of aberrant pre-mRNA splicing in humans. Human Molecular Genetics. 1997;6(6):909-912.
  46. Hayashi Y, Yamamoto M, Ohmori S, Kamijo T, Ogawa M, Seo H. Inhibition of growth hormone (GH) secretion by a mutant GH-I gene product in neuroendocrine cells containing secretory granules:An implication for isolated GH deficiency inherited in an autosomal dominant manner. Journal of Clinical Endocrinology and Metabolism. 1999;84(6):2134-2139.
  47. Kamijo T, Hayashi Y, Seo H, Ogawa M. Hereditary isolated growth hormone deficiency caused by GH1 gene mutations in Japanese patients. Growth Horm IGF Res. 1999;9(Suppl B):31-34.
  48. Lee MS, Wajnrajch MP, Kim SS, Plotnick LP, Wang J, Gertner JM, Leibel RL, Dannies PS. Autosomal dominant growth hormone (GH) deficiency type II: the Del32-71-GH deletion mutant suppresses secretion of wild-type GH. Endocrinology. 2000;141(3):883-890.
  49. Vivenza D, Guazzarotti L, Godi M, Frasca D, di Natale B, Momigliano-Richiardi P, Bona G, Giordano M. A Novel Deletion in the GH1 Gene Including the IVS3 Branch Site Responsible for Autosomal Dominant Isolated Growth Hormone Deficiency. The Journal of Clinical Endocrinology & Metabolism. 2006;91(3):980-986.
  50. Fintini D, Salvatori R, Salemi S, Otten B, Ubertini G, Cambiaso P, Mullis PE. Autosomal-dominant isolated growth hormone deficiency (IGHD type II) with normal GH-1 gene. Hormone Research. 2006;65(2):76-82.
  51. Veldhuis JD, Roemmich JN, Rogol AD. Gender and sexual maturation-dependent contrasts in the neuroregulation of growth hormone secretion in prepubertal and late adolescent males and females--a general clinical research center-based study. The Journal of Clinical Endocrinology and Metabolism. 2000;85(7):2385-2394.
  52. van den Berg G, Veldhuis JD, Frölich M, Roelfsema F. An amplitude-specific divergence in the pulsatile mode of growth hormone (GH) secretion underlies, the gender difference in mean GH concentrations in men and premenapausal women. Journal of Clinical Endocrinology and Metabolism. 1996;81(7):2460-2467.
  53. Roemmich JN, Clark PA, Weltman A, Veldhuis JD, Rogol AD. Pubertal alterations in growth and body composition: IX. Altered spontaneous secretion and metabolic clearance of growth hormone in overweight youth. Metabolism: Clinical and Experimental. 2005;54(10):1374-1383.
  54. Rivier J, Spiess J, Thorner M, Vale W. Characterization of a growth hormone-releasing factor from a human pancreatic islet tumour. Nature. 1982;300(5889):276-278.
  55. Gonzalez-Crespo S, Boronat A. Expression of the rat growth hormone-releasing hormone gene in placenta is directed by an alternative promoter. Proc Natl Acad Sci U S A. 1991;88(19):8749-8753.
  56. Rogol AD, Blizzard RM, Foley TPJ, Furlanetto R, Selden R, Mayo K, Thorner MO. Growth hormone releasing hormone and growth hormone:genetic studies in familial growth hormone deficiency. Pediatric Research. 1985;19:489-492.
  57. Mayo KE. Molecular cloning and expression of a pituitary-specific receptor for growth hormone-releasing hormone. Molecular Endocrinology. 1992;6:1734-1744.
  58. Godfrey P, Rahal JO, Beamer WG, Copeland NG, Jenkins NA, Mayo KE. GHRH receptor of little mice contains a missense mutation in the extracellular domain that disrupts receptor function. Nat Genet. 1993;4(3):227-232.
  59. Lin SC, Lin CR, Gukovsky I, Lusis AJ, Sawchenko PE, Rosenfeld MG. Molecular basis of the little mouse phenotype and implications for cell type-specific growth. Nature. 1993;364(6434):208-213.
  60. Wajnrajch MP, Chua SC, Green ED, Leibel RL. Human growth hormone-releasing hormone receptor (GHRHR) maps to a YAC at Chromosome 7p15. Mammalian Genome. 1994;5(9):595.
  61. Baumann G, Maheshwari H. The dwarfs of Sindh:severe growth hormone (GH) deficiency caused by a mutation in the GH-releasing hormone receptor gene. Acta Pediatr Suppl. 1997;423:33-38.
  62. Netchine I, Talon P, Dastot F, Vitaux F, Goosens M, Amselem S. Extensive phenotypic analysis of a family with growth hormone (GH) deficiency caused by a mutation in the GH-releasing hormone receptor gene. Journal of Clinical Endocrinology and Metabolism. 1998;83(2):432-436.
  63. Salvatori R, Hayashida CY, Aguiar-Oliveira MH, Phillips JA, Souza AH, Gondo RG, Toledo SP, Conceicão MM, Prince M, Maheshwari HG, Baumann G, Levine MA. Familial dwarfism due to a novel mutation of the growth hormone-releasing hormone receptor gene. The Journal of Clinical Endocrinology and Metabolism. 1999;84(3):917-923.
  64. Wajnrajch MP, Gertner JM, Harbison MD, Netchine I, Maheshwari HG, Baumann G, Amselem S, Goldstein DB, Leibel RL. Haplotype analysis of the growth hormone releasing hormone receptor locus in three apparently unrelated kindreds from the Indian subcontinent with the identical mutation in the GHRH receptor. American Journal of Medical Genetics. 2003;120A:77-83.
  65. Desai MP, Upadhye PS, Kamijo T, Yamamoto M, Ogawa M, Hayashi Y, Seo H, Nair SR. Growth hormone releasing hormone receptor (GHRH-r) gene mutation in Indian children with familial isolated growth hormone deficiency: a study from western India. J Pediatr Endocrinol Metab. 2005;18(10):955-973.
  66. Roelfsema F, Biermasz NR, Veldman RG, Veldhuis JD, Frolich M, Stovkis-Brantsma WH, Wit J-M. Growth hormone (GH) secretion in patients with an inactivating defect of the GH-releasing hormone (GHRH) receptor is pulsatile: evidence for a role for non-GHRH inputs into the generation of GH pulses. J Clin Endocrinol Metab. 2001;86(6):2459-2464.
  67. MacIntyre I, Szelke M, Royal Postgraduate Medical S, Bowers CY, Chang J, Momany FA, Folkers K. Effects of the enkephalins and enkephalin-analog on release of pituitary hormones in vitro. Molecular endocrinology: proceedings of Endocrinology '77 held at the Royal College of Physicians, London, England on 11-15 July, 1977. New York: Elsevier/North-Holland Biomedical Press %@ 9780444800350 %L QP187.A1 M65; 1977.
  68. Kojima M, Hosoda H, Date Y, Nakazato M, Matsuo H, Kangawa K. Ghrelin is a growth-hormone-releasing acylated peptide from stomach. Nature. 1999;402(6762):656-660.
  69. Wajnrajch MP, Gertner JM, Mullis PE, Cogan JD, Dannies PS, Kim S, Saenger P, Moshang T, Phillips III JA, Leibel RL. Arg183His, a New Mutational Hot-Spot in the Growth Hormone Gene Causing Isolated GH Deficiency Type II. Journal of Endocrine Genetics. 2000;1(3):124-134.
  70. Howard AD, Feighner SD, Cully DF, Arena JP, Liberator PA, Rosenblum CI, Hamelin M, Hreniuk DL, Palyha OC, Anderson J, Paress PS, Diaz C, Chou M, Liu KK, McKee KK, Pong SS, Chaung LY, Elbrecht A, Dashkevicz M, Heavens R, Rigby M, Sirinathsinghji DJS, Dean DC, Melillo D, Patchett AA, Nargund R, Griffin PR, DeMartino JA, Gupta SK, Schaeffer JM, Smith RG, Van der Ploeg LHT. A receptor in pituitary and hypothalamus that functions in growth hormone release. Science. 1996;273:974-977.
  71. Takaya K, Ariyasu H, Kanamoto N, Iwakura H, Yoshimoto A, Harada M, Mori K, Komatsu Y, Usui T, Shimatsu A, Ogawa Y, Hosoda K, Akamizu T, Kojima M, Kangawa K, Nakao K. Ghrelin Strongly Stimulates Growth Hormone Release in Humans. J Clin Endocrinol Metab. 2000;85(12):4908-4911.
  72. Bercu B, Walker RF. Novel Growth Hormone Secretagogues: Clinical Applications. Endocrinologist. 1997;7(1):51-64.
  73. Giustina A, Bonfanti C, Licini M, Ragni G, Stefana B. Hexarelin, a novel GHRP-6 analog, stimulates growth hormone (GH) release in a GH-secreting rat cell line (GH1) insensitive to GH-releasing hormone. Rugul Pept. 1997;70(1):49-54.
  74. Tolis G, Karydis I, Markousis V, Karagiorga M, Mesimeris T, Lenaerts V, Deghenghi R. Growth hormone release by the novel GH releasing peptide Hexarelin in patients with homozygous b-Thalassemia. Journal of Pediatric Endocrinology and Metabolism. 1997;10(1):35-40.
  75. Hataya Y, Akamizu T, Takaya K, Kanamoto N, Ariyasu H, Saijo M, Moriyama K, Shimatsu A, Kojima M, Kangawa K, Nakao K. A low dose of ghrelin stimulates growth hormone (gh) release synergistically with gh-releasing hormone in humans. J Clin Endocrinol Metab. 2001;86(9):45524555.
  76. Arvat E, Di Vito L, Broglio F, Papotti M, Muccioli G, Dieguez C, Casanueva F, Deghenghi R, Camanni F, Ghigo E. Preliminary evidence that Ghrelin, the natural GH secretagogue (GHS)-receptor ligand, strongly stimulates GH secretion in humans. J Endocrinol Invest. 2000;23(8):493-495.
  77. Ghizzoni L, Mastorakos G, Vottero A, Ziveri M, Ilias I, Bernasconi S. Spontaneous growth hormone (GH) secretion is not directly affected by ghrelin in either short normal prepubertal children or children with GH neurosecretory dysfunction. The Journal of Clinical Endocrinology and Metabolism. 2004;89(11):5488-5495.
  78. Racine MS, Symons KV, Foster CM, Barkan AL. Augmentation of growth hormone secretion after testosterone treatment in boys with constitutional delay of growth and adolescence: evidence against an increase in hypothalamic secretion of growth hormone-releasing hormone. The Journal of Clinical Endocrinology and Metabolism. 2004;89(7):3326-3331.
  79. Hirsh D, Heinrichs C, Leenders B, Wong ACK, Cummings DE, Chanoine J-P. Ghrelin is suppressed by glucagon and does not mediate glucagon-related growth hormone release. Hormone Research. 2005;63(3):111-118.
  80. Zhang JV, Ren P-G, Avsian-Kretchmer O, Luo C-W, Rauch R, Klein C, Hsueh AJW. Obestatin, a Peptide Encoded by the Ghrelin Gene, Opposes Ghrelin's Effects on Food Intake. Science. 2005;310(5750):996-999.
  81. Ukkola O, Ravussin E, Jacobson P, Snyder EE, Chagnon M, Sjöström L, Bouchard C. Mutations in the Preproghrelin/Ghrelin Gene Associated with Obesity in Humans. J Clin Endocrinol Metab. 2001;86(8):3996-3999.
  82. Pantel J, Legendre M, Cabrol S, Hilal L, Hajaji Y, Morisset S, Nivot S, Vie-Luton M-P, Grouselle D, de Kerdanet M, Kadiri A, Epelbaum J, Le Bouc Y, Amselem S. Loss of constitutive activity of the growth hormone secretagogue receptor in familial short stature. J Clin Invest. 2006;116:760-768.
  83. Grossman A, Savage MO, Lytras N, Preece MA, Sueiras-Diaz J, Coy DH, Rees LH, Besser GM. Responses to analogues of growth hormone-releasing hormone in normal subjects, and in growth-hormone deficient children and young adults. Clin Endocrinol (Oxf). 1984;21(3):321-330.
  84. Date Y, Murakami N, Kojima M, T. K, Matsukura S, Kangawa K, Nakazato M. Central effects of a novel acylated peptide, ghrelin, on growth hormone release in rats. Biochem Biophys Res Commun. 2000;275(2):477-480.
  85. Shen LP, Pictet RL, Rutter WJ. Human somatostatin I: sequence of the cDNA. Proc Natl Acad Sci USA. 1982;79(15):4575-4579.
  86. Rosskopf D, Schurks M, Manthey I, Joisten M, Busch S, Siffert W. Signal transduction of somatostatin in human B lymphoblasts. Am J Physiol Cell Physiol. 2003;284(1):C179-190.
  87. Laron Z. Prismatic cases: Laron syndrome (primary growth hormone resistance) from patient to laboratory to patient. The Journal of Clinical Endocrinology and Metabolism. 1995;80(5):1526-1531.
  88. Dastot F, Sobrier ML, Duquesnoy P, Duriez B, Goossens M, Amselem S. Alternatively spliced forms in the cytoplasmic domain of the human growth hormone (GH) receptor regulate its ability to generate a soluble GH-binding protein. Proceedings of the National Academy of Sciences of the United States of America. 1996;93(20):10723-10728.
  89. Dos Santos C, Essioux L, Teinturier C, Tauber M, Goffin V, Bougneres P. A common polymorphism of the growth hormone receptor is associated with increased responsiveness to growth hormone. Nat Genet. 2004;36(7):720-724.
  90. Binder G, Baur F, Schweizer R, Ranke MB. The d3-Growth Hormone (GH) Receptor Polymorphism Is Associated with Increased Responsiveness to GH in Turner Syndrome and Short Small-for-Gestational-Age Children. J Clin Endocrinol Metab. 2006;91(2):659-664.
  91. Jorge AAL, Marchisotti FG, Montenegro LR, Carvalho LR, Mendonca BB, Arnhold IJP. Growth hormone (GH) pharmacogenetics: influence of GH receptor exon 3 retention or deletion on first-year growth response and final height in patients with severe GH deficiency. The Journal of Clinical Endocrinology and Metabolism. 2006;91(3):1076-1080.
  92. Pilotta A, Mella P, Filisetti M, Felappi B, Prandi E, Parrinello G, Notarangelo LD, Buzi F. Common polymorphisms of the Growth Hormone (GH) Receptor do not correlate with the growth response to exogenous recombinant human GH in GH deficient children. J Clin Endocrinol Metab. 2006:jc.2005-1308.
  93. Rosenfeld RG, Belgorosky A, Camacho-Hubner C, Savage MO, Wit JM, Hwa V. Defects in growth hormone receptor signaling. Trends in endocrinology and metabolism: TEM. 2007;18(4):134-141.
  94. Savage MO, Hwa V, David A, Rosenfeld RG, Metherell LA. Genetic Defects in the Growth Hormone-IGF-I Axis Causing Growth Hormone Insensitivity and Impaired Linear Growth. Frontiers in Endocrinology. 2011;2:95.
  95. Ayling RM, Ross R, Towner P, von Laue S, Finidori J, Moutoussamy S, Buchanan CR, Clayton PE, Norman MR. A dominant-negative mutation of the growth hormone receptor causes familial short stature. Nature Genetics. 1997;16:13-14.
  96. Amselem S, Duquesnoy P, Attree O, Novelli G, Bousnina S, Postel-Vinay MC, Goossens M. Laron dwarfism and mutations of the growth hormone-receptor gene. N Engl J Med. 1989;321(15):989-995.
  97. Woods KA, Fraser NC, Postel-Vinay MC, Savage MO, Clark AJ. A homozygous splice site mutation affecting the intracellular domain of the growth hormone (GH) receptor resulting in Laron syndrome with elevated GH-binding protein. The Journal of Clinical Endocrinology and Metabolism. 1996;81(5):1686-1690.
  98. Woods KA, Dastot F, Preece MA, Clark AJ, Postel-Vinay MC, Chatelain PG, Ranke MB, Rosenfeld RG, Amselem S, Savage MO. Phenotype: genotype relationships in growth hormone insensitivity syndrome. The Journal of Clinical Endocrinology and Metabolism. 1997;82(11):3529-3535.
  99. Salerno M, Balestrieri B, Matrecano E, Officioso A, Rosenfeld RG, Di Maio S, Fimiani G, Ursini MV, Pignata C. Abnormal GH receptor signaling in children with idiopathic short stature. J Clin Endocrinol Metab. 2001;86(8):3882-3888.
  100. Abuzzahab MJ, Schneider A, Goddard A, Grigorescu F, Lautier C, Keller E, Kiess W, Klammt Jr, Kratzsch Jr, Osgood D, Pfהffle R, Raile K, Seidel B, Smith RJ, Chernausek SD, Group IGRIS. IGF-I Receptor Mutations Resulting in Intrauterine and Postnatal Growth Retardation. New England Journal of Medicine. 2003;349(23):2211-2222.
  101. Bonioli E, Tarò M, Rosa CL, Citana A, Bertorelli R, Morcaldi G, Gastaldi R, Coviello DA. Heterozygous mutations of growth hormone receptor gene in children with idiopathic short stature. Growth hormone & IGF research: official journal of the Growth Hormone Research Society and the International IGF Research Society. 2005;15(6):405-410.
  102. Rosenbloom AL, Guevara Aguirre J, Rosenfeld RG. The little women of Loja--growth hormone-receptor deficiency in an inbred population of southern Ecuador. N Engl J Med. 1990;323(20):1367-1374.
  103. Aalbers AM, Chin D, Pratt KL, Little BM, Frank SJ, Hwa V, Rosenfeld RG. Extreme Elevation of Serum Growth Hormone-Binding Protein Concentrations Resulting from a Novel Heterozygous Splice Site Mutation of the Growth Hormone Receptor Gene. Hormone Research in Paediatrics. 2009;71(5):276-284.
  104. Woods KA, Camacho-Hübner C, Savage MO, Clark AJ. Intrauterine growth retardation and postnatal growth failure associated with deletion of the insulin-like growth factor I gene. The New England Journal of Medicine. 1996;335(18):1363-1367.
  105. Bonapace G, Concolino D, Formicola S, Strisciuglio P. A novel mutation in a patient with insulin-like growth factor 1 (IGF1) deficiency. Journal of Medical Genetics. 2003;40(12):913-917.
  106. Walenkamp MJE, Karperien M, Pereira AM, Hilhorst-Hofstee Y, van Doorn J, Chen JW, Mohan S, Denley A, Forbes B, van Duyvenvoorde HA, van Thiel SW, Sluimers CA, Bax JJ, de Laat JaPM, Breuning MB, Romijn JA, Wit JM. Homozygous and heterozygous expression of a novel insulin-like growth factor-I mutation. The Journal of Clinical Endocrinology and Metabolism. 2005;90(5):2855-2864.
  107. Liu JP, Baker J, Perkins AS, Robertson EJ, Efstratiadis A. Mice carrying null mutations of the genes encoding insulin-like growth factor I (Igf-1) and type 1 IGF receptor (Igf1r). Cell. 1993;75(1):59-72.
  108. Morison IM, Reeve AE. Insulin-like growth factor 2 and overgrowth: molecular biology and clinical implications. Mol Med Today. 1998;4(3):110-115.
  109. Yakar S, Liu JL, Stannard B, Butler A, Accili D, Sauer B, LeRoith D. Normal growth and development in the absence of hepatic insulin-like growth factor I. Proceedings of the National Academy of Sciences of the United States of America. 1999;96(13):7324-7329.
  110. Sjögren K, Liu JL, Blad K, Skrtic S, Vidal O, Wallenius V, LeRoith D, Törnell J, Isaksson OG, Jansson JO, Ohlsson C. Liver-derived insulin-like growth factor I (IGF-I) is the principal source of IGF-I in blood but is not required for postnatal body growth in mice. Proceedings of the National Academy of Sciences of the United States of America. 1999;96(12):7088-7092.
  111. Yakar S, Rosen CJ, Beamer WG, Ackert-Bicknell CL, Wu Y, Liu JL, Ooi GT, Setser J, Frystyk J, Boisclair YR, LeRoith D. Circulating levels of IGF-1 directly regulate bone growth and density. J Clin Invest. 2002;110(6):771-781.
  112. Domené HM, Bengolea SV, Martínez AS, Ropelato MG, Pennisi P, Scaglia P, Heinrich JJ, Jasper HG. Deficiency of the circulating insulin-like growth factor system associated with inactivation of the acid-labile subunit gene. The New England Journal of Medicine. 2004;350(6):570-577.
  113. Hwa V, Haeusler G, Pratt KL, Little BM, Frisch H, Koller D, Rosenfeld RG. Total Absence of Functional Acid Labile Subunit, Resulting in Severe Insulin-Like Growth Factor Deficiency and Moderate Growth Failure. J Clin Endocrinol Metab. 2006;91(5):1826-1831.
  114. Domené HM, Scaglia PA, Lteif A, Mahmud FH, Kirmani S, Frystyk J, Bedecarrás P, Gutiérrez M, Jasper HG. Phenotypic effects of null and haploinsufficiency of acid-labile subunit in a family with two novel IGFALS gene mutations. The Journal of Clinical Endocrinology and Metabolism. 2007;92(11):4444-4450.
  115. Domené HM, Hwa V, Jasper HG, Rosenfeld RG. Acid-labile subunit (ALS) deficiency. Best Practice & Research Clinical Endocrinology & Metabolism. 2011;25(1):101-113.
  116. Savage MO, Camacho-Hübner C, David A, Metherell LA, Hwa V, Rosenfeld RG, Clark AJL. Idiopathic short stature: will genetics influence the choice between GH and IGF-I therapy? European Journal of Endocrinology. 2007;157 Suppl 1:S33-37.
  117. Chan JM, Stampfer MJ, Giovannucci E, Gann PH, Ma J, Wilkinson P, Hennekens CH, Pollak M. Plasma insulin-like growth factor-I and prostate cancer risk: a prospective study. Science. 1998;279(5350):563-566.
  118. Pollak M. Insulin-like growth factor physiology and cancer risk. Eur J Cancer. 2000;36(10):1224-1228.
  119. Jernstrom H, Chu W, Vesprini D, Tao Y, Majeed N, Deal C, Pollak M, Narod SA. Genetic factors related to racial variation in plasma levels of insulin-like growth factor-1: implications for premenopausal breast cancer risk. Mol Genet Metab. 2001;72(2):144-154.
  120. Cohen P, Clemmons DR, Rosenfeld RG. Does the GH-IGF axis play a role in cancer pathogenesis? Growth Horm IGF Res. 2000;10(6):297-305.
  121. Cohen P. Overview of the IGF-I system. Hormone Research. 2006;65 Suppl 1:3-8.
  122. Ranke MB. Defining insulin-like growth factor-I deficiency. Hormone Research. 2006;65 Suppl 1:9-14.
  123. Savage MO, Camacho-Hübner C, Dunger DB. Therapeutic applications of the insulin-like growth factors. Growth hormone & IGF research: official journal of the Growth Hormone Research Society and the International IGF Research Society. 2004;14(4):301-308.
  124. Laron Z, Anin S, Klipper-Aurbach Y, Klinger B. Effects of insulin-like growth factor on linear growth, head circumference, and body fat in patients with Laron-type dwarfism. Lancet (London, England). 1992;339(8804):1258-1261.
  125. Ranke MB, Savage MO, Chatelain PG, Preece MA, Rosenfeld RG, Blum WF, Wilton P. Insulin-like growth factor I improves height in growth hormone insensitivity: two years' results. Hormone Research. 1995;44(6):253-264.
  126. Ranke MB, Savage MO, Chatelain PG, Preece MA, Rosenfeld RG, Wilton P. Long-term treatment of growth hormone insensitivity syndrome with IGF-I. Results of the European Multicentre Study. The Working Group on Growth Hormone Insensitivity Syndromes. Hormone Research. 1999;51(3):128-134.
  127. Collett-Solberg PF, Misra M, Drug, Therapeutics Committee of the Lawson Wilkins Pediatric Endocrine S. The role of recombinant human insulin-like growth factor-I in treating children with short stature. The Journal of Clinical Endocrinology and Metabolism. 2008;93(1):10-18.
  128. Laron Z. Insulin-like growth factor-I (lGF-l): safety and efficacy. Pediatric endocrinology reviews: PER. 2004;2 Suppl 1:78-85.
  129. Backeljauw PF, Underwood LE, syndrome GCGGhi. Therapy for 6.5-7.5 years with recombinant insulin-like growth factor I in children with growth hormone insensitivity syndrome: a clinical research center study. The Journal of Clinical Endocrinology and Metabolism. 2001;86(4):1504-1510.
  130. Ullrich A, Gray A, Tam AW, Yang-Feng T, Tsubokawa M, Collins C, Henzel W, Le Bon T, Kathuria S, Chen E. Insulin-like growth factor I receptor primary structure: comparison with insulin receptor suggests structural determinants that define functional specificity. Embo J. 1986;5(10):2503-2512.
  131. Baker J, Liu JP, Robertson EJ, Efstratiadis A. Role of insulin-like growth factors in embryonic and postnatal growth. Cell. 1993;75(1):73-82.
  132. Roback EW, Barakat AJ, Dev VG, Mbikay M, Chretien M, Butler MG. An infant with deletion of the distal long arm of chromosome 15 (q26.1----qter) and loss of insulin-like growth factor 1 receptor gene. Am J Med Genet. 1991;38(1):74-79.
  133. Fang P, Schwartz ID, Johnson BD, Derr MA, Roberts CT, Hwa V, Rosenfeld RG. Familial short stature caused by haploinsufficiency of the insulin-like growth factor i receptor due to nonsense-mediated messenger ribonucleic acid decay. The Journal of Clinical Endocrinology and Metabolism. 2009;94(5):1740-1747.
  134. Fitzpatrick GV, Soloway PD, Higgins MJ. Regional loss of imprinting and growth deficiency in mice with a targeted deletion of KvDMR1. Nature Genetics. 2002;32(3):426-431.
  135. Eggenschwiler J, Ludwig T, Fisher P, Leighton PA, Tilghman SM, Efstratiadis A. Mouse mutant embryos overexpressing IGF-II exhibit phenotypic features of the Beckwith-Wiedemann and Simpson-Golabi-Behmel syndromes. Genes Dev. 1997;11(23):3128-3142.
  136. McElreavey K, Fellous M. Sex-determining genes. Trends in Endocrinology and Metabolism. 1997;8(9):342-345.
  137. Fisher AM, Thomas NS, Cockwell A, Stecko O, Kerr B, Temple IK, Clayton P. Duplications of chromosome 11p15 of maternal origin result in a phenotype that includes growth retardation. Human Genetics. 2002;111(3):290-296.
  138. Gicquel C, Rossignol S, Cabrol S, Houang M, Steunou V, Barbu V, Danton F, Thibaud N, Le Merrer M, Burglen L, Bertrand AM, Netchine I, Le Bouc Y. Epimutation of the telomeric imprinting center region on chromosome 11p15 in Silver-Russell syndrome. Nat Genet. 2005;37(9):1003-1007.
  139. Schönherr N, Meyer E, Eggermann K, Ranke MB, Wollmann HA, Eggermann T. (Epi)mutations in 11p15 significantly contribute to Silver-Russell syndrome: but are they generally involved in growth retardation? European Journal of Medical Genetics. 2006;49(5):414-418.
  140. Hannula K, Lipsanen-Nyman M, Kontiokari T, Kere J. A narrow segment of maternal uniparental disomy of chromosome 7q31-qter in Silver-Russell syndrome delimits a candidate gene region. American Journal of Human Genetics. 2001;68(1):247-253.
  141. Murphy R, Baptista J, Holly J, Umpleby AM, Ellard S, Harries LW, Crolla J, Cundy T, Hattersley AT. Severe intrauterine growth retardation and atypical diabetes associated with a translocation breakpoint disrupting regulation of the insulin-like growth factor 2 gene. The Journal of Clinical Endocrinology and Metabolism. 2008;93(11):4373-4380.
  142. Valhmu WB, Palmer GD, Rivers PA, Ebara S, Cheng JF, Fischer S, Ratcliffe A. Structure of the human aggrecan gene: exon-intron organization and association with the protein domains. Biochemical Journal. 1995;309(2):535-542.
  143. Kiani C, Chen L, Wu YJ, Yee AJ, Yang BB. Structure and function of aggrecan. Cell Research. 2002;12:19.
  144. Kawaguchi Y, Osada R, Kanamori M, Ishihara H, Ohmori K, Matsui H, Kimura T. Association between an aggrecan gene polymorphism and lumbar disc degeneration. Spine. 1999;24:2456-2460.
  145. Gleghorn L, Ramesar R, Beighton P, Wallis G. A mutation in the variable repeat region of the aggrecan gene (AGC1) causes a form of spondyloepiphyseal dysplasia associated with severe, premature osteoarthritis. Am J Hum Genet. 2005;77:484-490.
  146. Tompson SW, Merriman B, Funari VA, Fresquet M, Lachman RS, Rimoin DL, Nelson SF, Briggs MD, Cohn DH, Krakow D. A recessive skeletal dysplasia, SEMD aggrecan type, results from a missense mutation affecting the C-type lectin domain of aggrecan. Am J Hum Genet. 2009;84:72-79.
  147. Stattin E-L, Wiklund F, Lindblom K, Önnerfjord P, Jonsson B-A, Tegner Y, Sasaki T, Struglics A, Lohmander S, Dahl N, Heinegård D, Aspberg A. A Missense Mutation in the Aggrecan C-type Lectin Domain Disrupts Extracellular Matrix Interactions and Causes Dominant Familial Osteochondritis Dissecans. American Journal of Human Genetics. 2010;86(2):126-137.
  148. Nilsson O, Guo MH, Dunbar N, Popovic J, Flynn D, Jacobsen C, Lui JC, Hirschhorn JN, Baron J, Dauber A. Short Stature, Accelerated Bone Maturation, and Early Growth Cessation Due to Heterozygous Aggrecan Mutations. The Journal of Clinical Endocrinology and Metabolism. 2014;99(8):E1510-E1518.
  149. Quintos JB, Guo. MH, Dauber A. Idiopathic short stature due to novel heterozygous mutation of the aggrecan gene. J Pediatr Endocrinol Metab. 2015;Preprint.
  150. Gkourogianni A, Andrew M, Tyzinski L, Crocker M, Douglas J, Dunbar N, Fairchild J, Funari MFA, Heath KE, Jorge AAL, Kurtzman T, LaFranchi S, Lalani S, Lebl J, Lin Y, Los E, Newbern D, Nowak C, Olson M, Popovic J, Průhová Š, Elblova L, Quintos JB, Segerlund E, Sentchordi L, Shinawi M, Stattin E-L, Swartz J, Angel AGd, Cuéllar SD, Hosono H, Sanchez-Lara PA, Hwa V, Baron J, Nilsson O, Dauber A. Clinical Characterization of Patients With Autosomal Dominant Short Stature due to Aggrecan Mutations. The Journal of Clinical Endocrinology & Metabolism. 2017;102(2):460-469.
  151. van der Steen M, Pfundt R, Maas SJWH, Bakker-van Waarde WM, Odink RJ, Hokken-Koelega ACS. ACAN gene mutations in short children born SGA and response to growth hormone treatment. J Clin Endo Metab. 2017;102:1458-1467.
  152. Dateki S, Nakatomi A, Watanabe S, Shimizu H, Inoue Y, Baba H, Yoshiura K, Moriuchi H. Identification of a novel heterozygous mutation of the aggrecan gene in a family with idiopathic short stature and multiple intervertebral disc herniation. J Hum Genet. 2017;62:717-721.
  153. Rao E, Weiss B, Fukami M, Rump A, Niesler B, Mertz A, Muroya K, Binder G, Kirsch S, Winkelmann M, Nordsiek G, Heinrich U, Breuning MH, Ranke MB, Rosenthal A, Ogata T, Rappold GA. Pseudoautosomal deletions encompassing a novel homeobox gene causes growth failure in idiopathic short stature and Turner syndrome. Nature Genetics. 1997;16:54-62.
  154. Huber C, Rosilio M, Munnich A, Cormier-Daire V. High incidence of SHOX anomalies in individuals with short stature. Journal of Medical Genetics. 2006;43(9):735-739.
  155. Jorge AAL, Nishi MY, Funari MFA, Souza SC, Arnhold IJP, Mendonça BB. [Short stature caused by SHOX gene haploinsufficiency: from diagnosis to treatment]. Arquivos Brasileiros De Endocrinologia E Metabologia. 2008;52(5):765-773.
  156. Binder G. Short stature due to SHOX deficiency: genotype, phenotype, and therapy. Hormone Research in Paediatrics. 2011;75(2):81-89.
  157. Munns CJF, Haase HR, Crowther LM, Hayes MT, Blaschke R, Rappold G, Glass IA, Batch JA. Expression of SHOX in human fetal and childhood growth plate. The Journal of Clinical Endocrinology and Metabolism. 2004;89(8):4130-4135.
  158. Rappold G, Blum WF, Shavrikova EP, Crowe BJ, Roeth R, Quigley CA, Ross JL, Niesler B. Genotypes and phenotypes in children with short stature: clinical indicators of SHOX haploinsufficiency. Journal of Medical Genetics. 2007;44(5):306-313.
  159. Blum WF, Crowe BJ, Quigley CA, Jung H, Cao D, Ross JL, Braun L, Rappold G. Growth Hormone Is Effective in Treatment of Short Stature Associated with Short Stature Homeobox-Containing Gene Deficiency: Two-Year Results of a Randomized, Controlled, Multicenter Trial. The Journal of Clinical Endocrinology & Metabolism. 2007;92(1):219-228.
  160. Shaw AC, Kalidas K, Crosby AH, Jeffery S, Patton MA. The natural history of Noonan syndrome: a long-term follow-up study. Archives of Disease in Childhood. 2007;92(2):128-132.
  161. Allanson JE. Noonan syndrome. Journal of Medical Genetics. 1987;24(1):9-13.
  162. Allanson JE, Hall JG, Hughes HE, Preus M, Witt RD. Noonan syndrome: the changing phenotype. American Journal of Medical Genetics. 1985;21(3):507-514.
  163. Tartaglia M, Mehler EL, Goldberg R, Zampino G, Brunner HG, Kremer H, van der Burgt I, Crosby AH, Ion A, Jeffery S, Kalidas K, Patton MA, Kucherlapati RS, Gelb BD. Mutations in PTPN11, encoding the protein tyrosine phosphatase SHP-2, cause Noonan syndrome. Nature Genetics. 2001;29(4):465-468.
  164. Gelb BD, Tartaglia M. Noonan syndrome and related disorders: dysregulated RAS-mitogen activated protein kinase signal transduction. Human Molecular Genetics. 2006;15 Spec No 2:R220-226.
  165. Ferreira LV, Souza SAL, Arnhold IJP, Mendonca BB, Jorge AAL. PTPN11 (protein tyrosine phosphatase, nonreceptor type 11) mutations and response to growth hormone therapy in children with Noonan syndrome. The Journal of Clinical Endocrinology and Metabolism. 2005;90(9):5156-5160.
  166. Limal J-M, Parfait B, Cabrol S, Bonnet D, Leheup B, Lyonnet S, Vidaud M, Le Bouc Y. Noonan syndrome: relationships between genotype, growth, and growth factors. The Journal of Clinical Endocrinology and Metabolism. 2006;91(1):300-306.
  167. Raaijmakers R, Noordam C, Karagiannis G, Gregory JW, Hertel NT, Sipilä I, Otten BJ. Response to growth hormone treatment and final height in Noonan syndrome in a large cohort of patients in the KIGS database. Journal of pediatric endocrinology & metabolism: JPEM. 2008;21(3):267-273.
  168. Noordam C, Peer PGM, Francois I, De Schepper J, van den Burgt I, Otten BJ. Long-term GH treatment improves adult height in children with Noonan syndrome with and without mutations in protein tyrosine phosphatase, non-receptor-type 11. European Journal of Endocrinology. 2008;159(3):203-208.
  169. Growth Hormone Research S. Consensus guidelines for the diagnosis and treatment of growth hormone (GH) deficiency in childhood and adolescence: summary statement of the GH Research Society. GH Research Society. The Journal of Clinical Endocrinology and Metabolism. 2000;85(11):3990-3993.
  170. Kuczmarski RJ, Ogden C, Grummer-Strawn LM, Guo SS, Wei R, Mei Z, Curtin LR, Roche AF, Johnson CL. CDC Growth Charts: United States. Hyattsville: U.S. Department of Health and Human Services, Centers for Disease Control and Prevention, National Center for Health Statistics; 2000:1-28.
  171. Sizonenko PC, Clayton PE, Cohen P, Hintz RL, Tanaka T, Laron Z. Diagnosis and management of growth hormone deficiency in childhood and adolescence. Part 1: diagnosis of growth hormone deficiency. Growth hormone & IGF research: official journal of the Growth Hormone Research Society and the International IGF Research Society. 2001;11(3):137-165.
  172. Gruelich WW, Pyle SI. Radiographic Atlas of Skeletal Development of the Hand and Wrist. Stanford University Press.
  173. Tanner JM. Assessment of skeletal maturity and prediction of adult height (TW2 method). London ; New York: Academic Press
  174. Bayley N. Tables for predicting adult height from present height and skeletal age. J Pediat. 1946;28:49.
  175. Rosenfield R, Cutler L, Jameson JL, DeGroot L, Burger H. Somatic Growth and Maturation. Endocrinology. Philadelphia: W.B. Saunders Co.; 2001:477-502 %@ 0721678408.
  176. Underwood LE, Van Wyk JJ. Normal and aberrant growth. Williams textbook of endocrinology. Philadelphia: W.B. Saunders Co.; 2003:1079-1138.
  177. Bayley N, Pinneau SR. Tables for predicting adult height from skeletal age: revised for use with the Greulich-Pyle hand standards. J Pediatr. 1952;40(4):423-441.
  178. Roche AF, Wainer H, Thissen D. The RWT method for the prediction of adult stature. Pediatrics. 1975;56(6):1026-1033.
  179. Zachmann M, Sobradillo B, Frank M, Frisch H, Prader A. Bayley-Pinneau, Roche-Wainer-Thissen, and Tanner height predictions in normal children and in patients with various pathologic conditions. The Journal of Pediatrics. 1978;93(5):749-755.
  180. Marin G, Domené HM, Barnes KM, Blackwell BJ, Cassorla FG, Cutler GB. The effects of estrogen priming and puberty on the growth hormone response to standardized treadmill exercise and arginine-insulin in normal girls and boys. The Journal of Clinical Endocrinology and Metabolism. 1994;79(2):537-541.
  181. Molina S, Paoli M, Camacho N, Arata-Bellabarba G, Lanes R. Is testosterone and estrogen priming prior to clonidine useful in the evaluation of the growth hormone status of short peripubertal children? Journal of pediatric endocrinology & metabolism: JPEM. 2008;21(3):257-266.
  182. Wilson TA, Rose SR, Cohen P, Rogol AD, Backeljauw P, Brown R, Hardin DS, Kemp SF, Lawson M, Radovick S, Rosenthal SM, Silverman L, Speiser P. Update of guidelines for the use of growth hormone in children: The lawson wilkins pediatric endocrinology society drug and therapeutics committee. Journal of Pediatrics. 2003;143(4):415-421.
  183. Cohen P, Rogol AD, Howard CP, Bright GM, Kappelgaard A-M, Rosenfeld RG, on behalf of the American Norditropin Study G. Insulin Growth Factor-Based Dosing of Growth Hormone Therapy in Children: A Randomized, Controlled Study. J Clin Endocrinol Metab. 2007;92(7):2480-2486.
  184. Baron J. Growth Hormone Therapy in Childhood: Titration Versus Weight-Based Dosing? J Clin Endocrinol Metab. 2007;92(7):2436-2438.
  185. Blethen SL, Allen DB, Graves D, August G, Moshang T, Rosenfeld R. Safety of recombinant deoxyribonucleic acid-derived growth hormone:The National Cooperative Growth Study Experience. Journal of Clinical Endocrinology and Metabolism. 1996;81(5):1704-1710.
  186. Root AW, Kemp SF, Rundle AC, Dana K, Attie KM. Effect of long-term recombinant growth hormone therapy in children-The National Cooperative Growth Study, USA 1985-1994. Journal of Pediatric Endocrinology and Metabolism. 1998;11(3):403-412.
  187. Faglia G, Arosio M, Porretti S. Delayed closure of epiphyseal cartilages induced by the aromatase inhibitor anastrozole. Would it help short children grow up? J Endocrinol Invest. 2000;23(11):721-723.
  188. Dunkel L, Wickman S. Novel treatment of delayed male puberty with aromatase inhibitors. Horm Res. 2002;57(Suppl 2):44-52.
  189. Zung A, Zadik Z. New approaches in the treatment of short stature. Harefuah. 2002;141(12):1059-1065.
  190. Hero M, Norjavaara E, Dunkel L. Inhibition of Estrogen Biosynthesis with a Potent Aromatase Inhibitor Increases Predicted Adult Height in Boys with Idiopathic Short Stature: A Randomized Controlled Trial. J Clin Endocrinol Metab. 2005;90(12):6396-6402.
  191. Wassenaar MJ, Dekkers OM, Pereira AM, Wit JM, Smit JW, Biermasz NR, Romijn JA. Impact of the exon 3-deleted growth hormone (GH) receptor polymorphism on baseline height and the growth response to recombinant human GH therapy in GH-deficient (GHD) and non-GHD children with short stature: a systematic review and meta-analysis. J Clin Endocrinol Metab. 2009;94(10):3721-3730.
  192. Jorge AA, Marchisotti FG, Montenegro LR, Carvalho LR, Mendonca BB, Arnhold IJ. Growth hormone (GH) pharmacogenetics: influence of GH receptor exon 3 retention or deletion on first-year growth response and final height in patients with severe GH deficiency. J Clin Endocrinol Metab. 2006;91(3):1076-1080.
  193. Binder G, Baur F, Schweizer R, Ranke MB. The d3-growth hormone (GH) receptor polymorphism is associated with increased responsiveness to GH in Turner syndrome and short small-for-gestational-age children. J Clin Endocrinol Metab. 2006;91(2):659-664.
  194. Tauber M, Ester W, Auriol F, Molinas C, Fauvel J, Caliebe J, Nugent T, Fryklund L, Ranke MB, Savage MO, Clark AJ, Johnston LB, Hokken-Koelega AC. GH responsiveness in a large multinational cohort of SGA children with short stature (NESTEGG) is related to the exon 3 GHR polymorphism. Clin Endocrinol (Oxf). 2007;67(3):457-461.
  195. Braz AF, Costalonga EF, Montenegro LR, Trarbach EB, Antonini SR, Malaquias AC, Ramos ES, Mendonca BB, Arnhold IJ, Jorge AA. The interactive effect of GHR-exon 3 and -202 A/C IGFBP3 polymorphisms on rhGH responsiveness and treatment outcomes in patients with Turner syndrome. J Clin Endocrinol Metab. 2012;97(4):E671-677.
  196. Blum WF, Machinis K, Shavrikova EP, Keller A, Stobbe H, Pfaeffle RW, Amselem S. The growth response to growth hormone (GH) treatment in children with isolated GH deficiency is independent of the presence of the exon 3-minus isoform of the GH receptor. J Clin Endocrinol Metab. 2006;91(10):4171-4174.
  197. Pilotta A, Mella P, Filisetti M, Felappi B, Prandi E, Parrinello G, Notarangelo LD, Buzi F. Common polymorphisms of the growth hormone (GH) receptor do not correlate with the growth response to exogenous recombinant human GH in GH-deficient children. J Clin Endocrinol Metab. 2006;91(3):1178-1180.
  198. Carrascosa A, Esteban C, Espadero R, Fernández-Cancio M, Andaluz P, Clemente M, Audí L, Wollmann H, Fryklund L, Parodi L. The d3/fl-growth hormone (GH) receptor polymorphism does not influence the effect of GH treatment (66 microg/kg per day) or the spontaneous growth in short non-GH-deficient small-for-gestational-age children: results from a two-year controlled prospective study in 170 Spanish patients. J Clin Endocrinol Metab. 2006;91(9):3281-3286.
  199. Lin SC, Lin CR, Gukovsky I, Lusis AJ, Sawchenko PE, Rosenfeld M. Molecular basis of the little mouse phenotype and implications for cell type-specific growth. Nature. 1993;364(6434):208-213.
  200. Tuffli GA, Johanson A, Rundle AC, Allen DB. Lack of increased risk for extracranial, nonleukemic neoplasms in recipients of recombinant deoxyribonucleic acid growth hormone. Journal of Clinical Endocrinology & Metabolism. 1995;80(4):1416-1422.
  201. Cowell CT, Dietsch S. Adverse events during growth hormone therapy. J Pediatr Endocrinol Metab. 1995;8:243-252.
  202. Clayton PE, Cowell CT. Safety issues in children and adolescents during growth hormone therapy-a review. Growth Hormone &IGF Research. 2000;10:306-310.
  203. Bell J, Parker KL, Swinford RD, Hoffman AR, Maneatis T, Lippe B. Long-Term Safety of Recombinant Human Growth Hormone in Children. J Clin Endocrinol Metab. 2010;95(1):167-177.
  204. Craig ME, Cowell CT, Larsson P, Zipf WB, Reiter EO, Albertsson Wikland K, Ranke MB, Price DA, Board KI. Growth hormone treatment and adverse events in Prader-Willi syndrome: data from KIGS (the Pfizer International Growth Database). Clinical Endocrinology. 2006;65(2):178-185.
  205. Tauber M, Diene G, Molinas C, Hébert M. Review of 64 cases of death in children with Prader–Willi syndrome (PWS). American Journal of Medical Genetics Part A. 2008;146A(7):881-887.
  206. Eiholzer U. Deaths in children with Prader-Willi syndrome. A contribution to the debate about the safety of growth hormone treatment in children with PWS. Hormone Research. 2005;63(1):33-39.
  207. Gerard JM, Garibaldi L, Myers SE, Aceto TJ, Kotagal S, Gibbons VP, Stith J, Weber C. Sleep apnea in patients receiving growth hormone. Clin Pediatr (Phila). 1997;36(6):321-326.
  208. Lindgren AC, Hellstrom LG, Ritzen EM, Milerad J. Growth hormone treatment increases CO(2) response, ventilation and central inspiratory drive in children with Prader-Willi syndrome. Eur J Pediatr. 1999;158(11):936-940.
  209. Miller J, Silverstein J, Shuster J, Driscoll DJ, Wagner M. Short-term effects of growth hormone on sleep abnormalities in Prader-Willi syndrome. The Journal of Clinical Endocrinology and Metabolism. 2006;91(2):413-417.
  210. Bolar K, Hoffman AR, Maneatis T, Lippe B. Long-Term Safety of Recombinant Human Growth Hormone in Turner Syndrome. J Clin Endocrinol Metab. 2008;93(2):344-351.
  211. Schoemaker MJ, Swerdlow AJ, Higgins CD, Wright AF, Jacobs PA, Group UKCC. Cancer incidence in women with Turner syndrome in Great Britain: a national cohort study. The Lancet Oncology. 2008;9(3):239-246.
  212. Carel J-C, Ecosse E, Landier F, Meguellati-Hakkas D, Kaguelidou F, Rey G, Coste J. Long-term mortality after recombinant growth hormone treatment for isolated growth hormone deficiency or childhood short stature: preliminary report of the French SAGhE study. The Journal of Clinical Endocrinology and Metabolism. 2012;97(2):416-425.
  213. Sävendahl L, Maes M, Albertsson-Wikland K, Borgström B, Carel JC, Henrard S, Speybroeck N, Thomas M, Zandwijken G, Hokken-Koelega A. Long-term mortality and causes of death in isolated GHD, ISS, and SGA patients treated with recombinant growth hormone during childhood in Belgium, The Netherlands, and Sweden: preliminary report of 3 countries participating in the EU SAGhE study. J Clin Endo Metab. 2012;97(2):213-217.
  214. Maneatis T, Baptista J, Connelly K, Blethen S. Growth hormone safety update from the National Cooperative Growth Study. J Pediatr Endocrinol Metab. 2000;13(Suppl 2):1035-1044.
  215. Ergun-Longmire B, Mertens AC, Mitby P, Qin J, Heller G, Shi W, Yasui Y, Robison LL, Sklar CA. Growth Hormone Treatment and Risk of Second Neoplasms in the Childhood Cancer Survivor. J Clin Endocrinol Metab. 2006;91(9):3494-3498.
  216. Sklar CA, Mertens AC, Mitby P, Occhiogrosso G, Qin J, Heller G, Yasui Y, Robison LL. Risk of disease recurrence and second neoplasms in survivors of childhood cancer treated with growth hormone: a report from the Childhood Cancer Survivor Study. J Clin Endocrinol Metab. 2002;87(7):3136-3141.
  217. Patterson BC, Chen Y, Sklar CA, Neglia J, Yasui Y, Mertens A, Armstrong GT, Meadows A, Stovall M, Robison LL, Meacham LR. Growth Hormone Exposure as a Risk Factor for the Development of Subsequent Neoplasms of the Central Nervous System: A Report From the Childhood Cancer Survivor Study. The Journal of Clinical Endocrinology & Metabolism. 2014;99(6):2030-2037.
  218. Sklar CA, Antal Z, Chemaitilly W, Cohen LE, Follin C, Meacham LR, Murad MH. Hypothalamic–Pituitary and Growth Disorders in Survivors of Childhood Cancer: An Endocrine Society Clinical Practice Guideline. The Journal of Clinical Endocrinology & Metabolism. 2018.
  219. Child CJ, Zimmermann AG, Jia N, Robison LL, Brämswig JH, Blum WF. Assessment of Primary Cancer Incidence in Growth Hormone-Treated Children: Comparison of a Multinational Prospective Observational Study with Population Databases. Hormone Research in Paediatrics. 2016;85(3):198-206.
  220. Raman S, Grimberg A, Waguespack SG, Miller BS, Sklar CA, Meacham LR, Patterson BC. Risk of Neoplasia in Pediatric Patients Receiving Growth Hormone Therapy--A Report From the Pediatric Endocrine Society Drug and Therapeutics Committee. The Journal of Clinical Endocrinology and Metabolism. 2015;100(6):2192-2203.
  221. Clayton PE, Cuneo RC, Juul A, Monson JP, Shalet SM, Tauber M. Consensus statement on the management of the GH-treated adolescent in the transition to adult care. Eur J Endocrinol. 2005;152(2):165-170.
  222. Molitch ME, Clemmons DR, Malozowski S, Merriam GR, Vance ML. Evaluation and Treatment of Adult Growth Hormone Deficiency: An Endocrine Society Clinical Practice Guideline. The Journal of Clinical Endocrinology & Metabolism. 2011;96(6):1587-1609.
  223. Tauber M, Moulin P, Pienkowski C, Jouret B, Rochiccioli P. Growth hormone (GH) retesting and auxological data in 131 GH-deficient patients after completion of treatment. The Journal of Clinical Endocrinology and Metabolism. 1997;82(2):352-356.
  224. Colao A, Di Somma C, Savastano S, Rota F, Savanelli MC, Aimaretti G, Lombardi G. A reappraisal of diagnosing GH deficiency in adults: role of gender, age, waist circumference, and body mass index. The Journal of Clinical Endocrinology and Metabolism. 2009;94(11):4414-4422.
  225. Cook DM, Rose SR. A review of guidelines for use of growth hormone in pediatric and transition patients. Pituitary. 2012;15(3):301-310.

226.     Quigley CA, Zagar AJ, Liu CC, Brown DM, Huseman C, Levitsky L, Repaske DR, Tsalikian E, Chipman JJ. United States multicenter study of factors predicting the persistence of GH deficiency during the transition period between childhood and adulthood. International Journal of Pediatric Endocrinology. 2013;2013(1):6.

Diagnosis and Clinical Management of Monogenic Diabetes

ABSTRACT


Monogenic forms of diabetes are responsible for 1-3% of all young-onset diabetes. The multiple genes involved can cause one or both of the main phenotypes- congenital (neonatal) diabetes or MODY (maturity-onset diabetes of the young). The timely and accurate genetic diagnosis of monogenic diabetes provides an opportunity to target therapy to the underlying gene cause, refine management, and identify affected and at-risk relatives. As there is clinical overlap of monogenic diabetes with type 1 and type 2 diabetes, presenting clinical and laboratory features warrant careful attention to aid in diabetes classification and to identify those individuals who warrant genetic testing. These include those negative for islet cell autoantibodies with persistent c-peptide, suggesting a diagnosis other than type 1 diabetes. While obesity does not preclude monogenic diabetes, certainly individuals lacking obesity and other features of metabolic disease should be referred for diagnostic genetic testing. Understanding who and how to refer for genetic testing and how to interpret test results is key to precision medicine in diabetes. The most common forms of monogenic diabetes have specific therapies and management strategies that can optimize glycemic control and minimize complications resulting in improved health outcomes for affected individuals.


INTRODUCTION


The most common forms of diabetes- type one (T1DM) and type two (T2DM)- are polygenic disorders. There are many identified genes, wherein certain variants cause a genetic predisposition to the development of diabetes. However, they are insufficient to cause disease without additional contributing environmental factors. In contrast, monogenic forms of diabetes are due to highly penetrant variants in single genes or chromosomal abnormalities that are sufficient by themselves to cause diabetes. Phenotypic overlap between monogenic diabetes and polygenic forms means that clinicians must thoughtfully consider diabetes classification in each patient, at diagnosis and thereafter, and order genetic testing to confirm clinically suspected monogenic diabetes.

This chapter will focus on understanding the following important clinical factors for pediatric and adult patients:

  • Why test?
  • How to test and interpret results.
  • Who to test?
  • How to treat and manage specific subtypes of monogenic diabetes.

WHY SHOULD YOU DO GENETIC TESTING FOR MONOGENIC DIABETES?

There are two main clinical phenotypes of monogenic diabetes- neonatal diabetes (also called congenital diabetes) and MODY (Maturity-Onset Diabetes of the Young). Neonatal diabetes has a prevalence of 1:90,000 – 1:250,000 and MODY accounts for 1-3% of diabetes diagnosed under 30 years of age (~0.4% of all diabetes) (1-3).  Both of these broad phenotypes include syndromic diabetes and there is overlap of causative genes- with MODY, by definition representing autosomal dominant diabetes and neonatal diabetes being caused by a number of overlapping ‘MODY genes’ as well as having several genetic causes unique to congenital forms. There are over 20 known genetic causes of neonatal diabetes mellitus and 14 genes that have been implicated as causes of MODY (Table 1). While monogenic diabetes is uncommon, accurately diagnosing monogenic diabetes through genetic testing has important clinical and economic considerations for the patient, and often for first-degree relatives as well. For the most common subtypes of monogenic diabetes, gene-directed management improves outcomes, alerts the physician of non-pancreatic features that may accompany diabetes, and identifies affected and at-risk family members who may benefit from diagnostic or predictive genetic testing, respectively.

Table 1. Genetic Causes of Monogenic Diabetes

Common Causes of Neonatal Diabetes                             Common Causes of MODY

KCNJ11, ABCC8, INS, 6q24                                                  GCK, HNF1A, HNF4A, HNF1B

chromosome abnormalities


Rare Causes of Neonatal Diabetes                                     Rare Causes of MODY

GATA6, EIF2AK3, PTF1A, GLIS3, FOXP3,                          PDX1, NEUROD1, KLF11*, CEL,

GCK, PDX1, HNF1B, GATA4, SLC2A2, SLC19A2,              PAX4*, INS, BLK*, ABCC8,

NEUROD1, NEUROG3, NKX2.2, RFX6, IER3IP1,               KCNJ11, APPL1

MNX1, ZFP57, STAT3

*Evidence for these as MODY genes is limited

There have now been several economic evaluations of genetic testing for monogenic diabetes. In children, testing for monogenic diabetes has been found to be cost-saving, a rare feat in medicine (4-6). The addition of cascade testing in MODY- that is testing of first-degree relatives of affected individuals- further enhances this cost-effectiveness (6). In adults, routine screening for monogenic diabetes has not yet proven to be cost-effective, which is due to both the absolute number of affected adults and the high percentage of T2DM, where costs of gene-targeted therapy compared to some T2DM regimens, particularly metformin alone, are not substantially different (7,8). However, results strongly suggest that testing only those patients with a high pre-test probability of monogenic diabetes would be cost-effective (7).  Thus, genetic testing for adults should still be carried out when careful consideration of the clinical picture is inconsistent with a diagnosis of T1DM or T2DM and is suggestive of MODY or another form of monogenic diabetes. 

HOW SHOULD GENETIC TESTING FOR MONOGENIC DIABETES BE CARRIED OUT?

Medical insurance coverage for genetic testing varies not only by insurance company but also by disease. Thus, a prior authorization should be sought before ordering diabetes genetic testing and patients should be instructed to contact their insurance companies to clearly understand any co-pays for which they will be responsible. Some commercial testing companies offer patient protection programs to limit out-of-pockets expenses but typically patients must enroll in such programs prior to ordering genetic testing.

In the past, genetic testing was accomplished through Sanger sequencing, typically of one gene at a time until a causative mutation was determined or all relevant genes were tested without detected abnormality. This process was labor and time intensive and costly. Now, monogenic diabetes panel are frequently used in place of Sanger sequencing of a single gene (5,9,10).  There are a number of CLIA-certified commercial labs offering monogenic diabetes panels, including Ambry, Athena Diagnostics, Blueprint Genetics, Prevention Genetics, Invitae, and GeneDx (this list is non-exhaustive and will change over time). Laboratories at some academic institutions also have the capability to provide CLIA-certified genetic testing for monogenic diabetes. The genes carried on panels vary by laboratory and are often divided into a neonatal diabetes panel and a MODY panel. In general, gene panels will be the appropriate test to order because of the overlapping clinical features between various types of monogenic diabetes, but there are cases where the clinical features clearly fit with a distinct gene. Research-based genetic testing for monogenic diabetes is available through a number of different studies. The methodology does not differ from that used in clinical laboratories, but results are not CLIA certified.  While it is at a provider’s discretion to act on research findings based on clinical judgment, CLIA confirmation of the finding is advised. In such cases, clinicians must specify that they are confirming a previous research finding so that labs will only sequence the affected gene and look for the specific variant identified. This testing is also appropriate for cascade genetic testing of first-degree relatives. Confirmation of a known genetic finding is relatively inexpensive and typically approved by insurance (authors’ practice experience).

HOW SHOULD GENETIC TESTING RESULTS BE INTERPRETED?

Content of genetic testing reports can vary widely based on the laboratory (11).  There is a growing recognition by experts in monogenic diabetes and laboratories themselves that hard-to-interpret genetic testing reports are a disservice to clinicians and patients. It is likely that in the relatively near future, testing reports will be easier to interpret. Until then, recommendations for interpretation include:

  • Look at the classification of any variants found as well as any provided references of the published literature relevant to the genetic finding. Terminology used includes pathogenic, likely pathogenic, variant of uncertain significance (VUS), likely benign, and benign.
  • Determine if testing includes gene dosage analysis. Sanger sequencing and some panels will not detect partial or whole gene deletions. However, many laboratories will employ additional methods to detects deletions, such as Multiplex Ligation-dependent Probe Amplification (MLPA) or exon-level array comparative genomic hybridization (CGH). If this has not been included, and genetic testing returns negative in a highly suspicious case, additional testing for copy number variation is warranted.
  • It is important to understand that due to the redundancy in our genetic code, many gene variants are tolerated with no effect on gene production, transcription, or expression. Thus, a variant in a known monogenic gene in a patient with suspected monogenic diabetes does not mean that the variant is causing their diabetes (12). Additionally, some genes and some variants reported in the published literature that were once thought to cause monogenic diabetes have subsequently proven to be non- causal or have come into question, but they persist in the literature. ClinGen is a NIH-funded resource that defines the clinical relevance of genes and variants (https://www.clinicalgenome.org). There are gene curation expert panels and variant curation expert panels for monogenic diabetes. Currently the work of the gene curation panel is focused on the 14 genes designated as MODY, a number of which have questionable data to support them as legitimate monogenic diabetes genes (BLK, KLF11, PAX4).
  • Seek advice from an expert in monogenic diabetes for any level of uncertainty in interpretation of test results before discussing results with the patient and particularly before making changes to diabetes management (monogenicdiabetes@uchicago.edu).

WHO SHOULD YOU TEST FOR MONOGENIC DIABETES? 

There are many examples of systemic screening for monogenic diabetes in various populations and the result is always the same: if you conduct genetic testing among those diagnosed as T1DM or T2DM, you will find monogenic diabetes cases (2,13-16).  While the clinical overlap between different forms of diabetes can make accurate classification challenging, there are several clinical and laboratory features that should prompt consideration of genetic testing for monogenic diabetes (Table 2) (17,18).

All children with diabetes onset before 6 months of age should receive immediate genetic testing for monogenic diabetes as a genetic cause is very likely. Beyond 6 months, T1DM becomes the predominant diagnosis; however, a percentage of infants will still have a monogenic etiology, and many advocate for genetic testing in all cases diagnosed under 12 months of age (19). Another approach is to test these children for pancreatic autoantibodies, which, if positive, would be consistent with autoimmune type 1 diabetes. Those with negative autoantibodies should undergo testing for monogenic diabetes (18). Importantly, there are monogenic causes of early-onset autoimmune diabetes with additional features that suggest a single gene defect (20).  A type 1 diabetes genetic risk score along with age can be helpful in discriminating these monogenic autoimmunity cases from polygenic type 1 diabetes (21). While treatment of monogenic autoimmune diabetes will continue to be replacement doses of insulin, accurate genetic diagnosis will help with prognostication and clinical management decisions.

Table 2. Clinical Features That May Indicate Monogenic Diabetes

Age

·       Diagnosis of diabetes <6 months of age is strongly suggestive of congenital/neonatal monogenic diabetes

·       MODY onset typically occurs in pubertal children or young adults (diagnosis is typically but not always <35 years)

Body habitus

·       Obesity does not preclude a monogenic cause of diabetes, but rates of obesity in monogenic diabetes are the same as population frequency

Family history

·       Multiple generations of diabetes in an autosomal dominant pattern in MODY

Acanthosis nigricans, other metabolic features

·       Typically absent

Laboratory values

·       Negative pancreatic autoantibodies,

·       Continued presence of c-peptide years after diagnosis for MODY and for some forms of neonatal diabetes

Presence of extra- pancreatic features outside of those associated with T1DM or T2DM

·       Several forms of monogenic diabetes have associated features that can raise suspicion not only for monogenic diabetes but for specific gene causes, e.g.,

o   Renal developmental disease, genitourinary abnormalities in HNF1B-MODY

o   Neurocognitive difficulties, seizures in KATP-related neonatal diabetes

o   Exocrine pancreatic insufficiency, cardiac defects in GATA6- and GATA4-related neonatal diabetes

In older children, cost-effectiveness analyses suggest that a reasonable approach to diabetes classification would be to test for pancreatic autoantibodies and endogenous insulin production (as measured by c-peptide) in all pediatric patients, and to test those with negative antibodies and positive c-peptide for monogenic diabetes (5,6). Using this biomarker approach reveals a monogenic diabetes prevalence of 2.5%-6.5%, including a monogenic diabetes prevalence of 4.5% in overweight and obese children, who would fall under the radar of many clinicians for monogenic diabetes consideration (2,3,22). If there are barriers to universal biomarker testing, age at diagnosis in older children may be helpful in considering monogenic diabetes versus T1DM and T2DM. The predominant diagnosis between 1 year of age and puberty will be T1DM.  In the peripubertal period both T2DM and monogenic diabetes become higher considerations and T1DM remains a consideration.  Additional clinical features of normal weight, lack of acanthosis nigricans or features of metabolic syndrome can identify patients who should undergo genetic testing. Family history is expected to be positive in both monogenic diabetes and type 2 diabetes so asking specific details for each affected family member, including age at diabetes diagnosis, body habitus at the time of diagnosis, and treatment are necessary to make family history useful.

In adults, the substantial burden of type 2 diabetes precludes universal biomarker screening to identify individuals who may have monogenic diabetes (8).  However, the same clinical features of body habitus, features of insulin resistance or metabolic syndrome, paired with personal and detailed family history are useful to screen in people for additional evaluation.  Age at diabetes onset is also an important consideration, as MODY onset is rarely beyond 35 years of age. There is a prediction model for MODY, known as the MODY calculator, which is available by website and as an app (https://www.diabetesgenes.org/exeter-diabetes-app/). The calculator was developed in an European white population and so must be used with caution for other groups, but on-going work will help to clarify its use in non-white populations (23) (24). 

Importantly, until universal genetic testing is available for diabetes classification, some cases will be missed by applying these ‘clinical filters’ for selecting patients for testing, particularly those who have both monogenic diabetes and obesity. Because of the selection bias that results from excluding obese patients from testing, the impact of obesity on management and outcomes of specific subtypes of monogenic diabetes is not well understood.

HOW SHOULD YOU MANAGE SPECIFIC SUBTYPES OF MONOGENIC DIABETES? 

Several of the common forms of monogenic diabetes have specific management as discussed below and in Table 3.

Mutations in the KCNJ11 and ABCC8 genes, encoding the subunits of the KATP channel, most commonly manifest as neonatal diabetes, and can cause permanent or transient forms (mutations in KCNJ11 and ABCC8 are also rare causes of MODY) (25,26). Transient forms have a median onset of 4 weeks and remit at a median age of 35 weeks, but may relapse later in life. Neurodevelopmental difficulties are a common feature of mutations in these genes. KATP-related neonatal diabetes can usually be treated with high doses of sulfonylureas, which also helps with the neurodevelopmental phenotype (26). Frequently people can achieve excellent diabetes control on sulfonylureas (27).  More severe mutations and longer duration of misdiagnosis are associated with decreased success in transitioning from insulin therapy to sulfonylureas (28).

6q24-related transient neonatal diabetes is an imprinted disorder diagnosed through methylation analysis of the 6q24 differentially methylated region of chromosome 6.  It has a more severe phenotype than KATP-related transient neonatal diabetes with severe intra-uterine growth restriction and earlier diabetes onset, but earlier remission. Diabetes onset occurs in the first 6 weeks of life, and often within the first week of life.  Affected individuals may have macroglossia and/or umbilical hernia. Typically, insulin is used for treatment during the infancy period. Insulin needs then decline and diabetes remits at an average of 4 months but can persist beyond a year (29,30). Relapse frequently occurs- usually in adolescence, pregnancy or adulthood. The best treatment for relapsed diabetes is not clearly defined, but many patients will respond to sulfonylureas and/or other oral medications such as dipeptidyl peptidase-4 (DPP-4) inhibitors, without need for insulin therapy (31).

Table 3. Features and Treatment of the Common Forms of Monogenic Diabetes

Name

Gene & Protein

Clinical Characteristics

Laboratory Findings

Treatment

Neonatal Diabetes

KCNJ11-related neonatal diabetes

KCNJ11,

Kir6.2

Can cause transient & permanent neonatal diabetes


Low birth weight


Developmental delay, seizures


High doses of sulfonylureas


Insulin if there is no response to sulfonylureas

ABCC8- related neonatal diabetes

ABCC8,

SUR1

Can cause transient & permanent neonatal diabetes


Low birth weight


High doses of sulfonylureas


Insulin if there is no response to sulfonylureas

INS- related neonatal diabetes

INS,

Insulin

Can cause transient & permanent neonatal diabetes


Low birth weight


Insulin

6q24- related neonatal diabetes


Causes transient neonatal diabetes that may relapse in adolescence or adulthood


IUGR, Low birth weight


Earlier presentation compared to KATP-related neonatal diabetes


Macroglossia, umbilical hernia


Typically insulin, use of sulfonylureas has been reported


Sulfonylureas have successfully been used in relapsed cases

MODY

HNF1A-MODY (previously referred to as MODY3)

HNF1A, Hepatocyte nuclear factor 1-alpha

Macrosomia and congenital hyperinsulinemic hypoglycemia (commonly seen in HNF4A-MODY) has been described in a small number of cases.


Diabetes onset is typically in adolescence or young adulthood


Progressive insulin secretory defect.


Increased risk for cardiovascular disease


Liver adenomas may occur

Glucosuria without significant hyperglycemia


Elevated HDL


Low hsCRP


Sulfonylureas are first line therapy


GLP1 agonists and DPP4 inhibitors have also been shown to be effective in HNF1A-MODY

HNF4A-MODY (previously referred to as MODY1)

HNF4A,

Hepatocyte nuclear factor 4-alpha

Macrosomia and congenital hyperinsulinemic hypoglycemia may occur in affected infants


Diabetes onset is typically in adolescence or young adulthood

Low apolipoproteins and triglycerides

Sulfonylureas are first line therapy


DPP4 inhibitors have also been shown to be effective in HNF4A-MODY

HNF1B-MODY (previously referred to as MODY5)

HNF1B, Hepatocyte nuclear factor 1-beta

Developmental renal disease, especially cysts, genitourinary malformations, gout, pancreatic insufficiency

Elevated liver enzymes


Elevated uric acid


Low magnesium


Most patients will require insulin therapy


Oral hypoglycemic agents may be successful

GCK-MODY (previously referred to as MODY2)

GCK, Glucokinase

Mild, non-progressive hyperglycemia is present at birth


Diagnosis is often incidental (routine screening or investigation for an unrelated symptom)

FBG typically ranges from 99-144 mg/dL


HbA1c ranges from 5.6-7.6%


HNF1A-MODY

HNF1A-MODY is the most common form of MODY worldwide.  It is characterized by a progressive insulin secretory defect with diabetes onset often in adolescence or young adulthood (32,33). Laboratory features include a low renal glucose threshold resulting in glucosuria at lower-than-expected blood glucose levels (34). There is often a large incremental increase between fasting and 2-hour glucose on oral glucose tolerance tests.  Additionally, hsCRP levels are lower than in other diabetes types (35).

Cardiovascular disease is higher in individuals with HNF1A-MODY compared to their unaffected relatives. Thus, despite a typically high HDL level, related to the activity of the transcriptional factor, statins should be considered in individuals with HNF1A-MODY (36).

Hepatic adenomas can also be a feature of HNF1A-MODY, and liver adenomatosis has been reported in 6.5% of those with HNF1A-MODY in one study. While routine screening for liver adenomatosis in HNF1A-MODY hasn’t been a universal recommendation, it can present with intra-abdominal or intratumoral bleeding in 25% of cases, making asymptomatic screening clinically reasonable (37).

First line diabetes treatment for HNF1A-MODY is low-dose sulfonylureas, which partly bypass the defective insulin secretory response (38). Individuals with HNF1A-MODY can be very sensitive to sulfonylureas and experience hypoglycemia even on very small doses. Guidelines for transitioning patients can be found here. Studies of HNF1A-MODY have shown good maintenance on sulfonylurea therapy and lower rates of diabetes-related complications. Predictors of treatment success include shorter duration of diabetes, lower HbA1c, and lower BMI at the time of genetic diagnosis and less weight gain over time (39,40).

Meglitinides can be used in place of sulfonylureas, as they have a similar mechanism of action but bind less strongly to the receptor (41). GLP-1 agonists and DPP-IV inhibitors have also been studied in HNF1A-MODY, and have been shown to be efficacious and may be useful adjunctive therapy (42,43). These can be used for adjunctive therapy in cases where glycemic control is inadequate with sulfonylurea monotherapy or when hypoglycemia precludes use of sulfonylureas and meglitinides (typically early in diabetes).

HNF4A-MODY

HNF4A-MODY is similar in phenotype to HNF1A-MODY, but much less common (5-10% of MODY) (33). One distinct feature is a family history of macrosomia in about half of affected individuals and diazoxide-responsive hypoglycemia in neonates due to hyperinsulinism, which can last for days to years. This hyperinsulinemic hypoglycemia occurs in ~15% of HNF4A-MODY but has only rarely been reported to occur in HNF1A-MODY (44).

Again, first line treatment for HNF4A-MODY is a sulfonylurea (45).  DPP-4 inhibitors and GLP-1 agonists have also been studied to a limited extent in HNF4A-MODY (46,47).

HNF1B-MODY

Heterozygous mutations in the HNF1B gene present with variable phenotypes which include isolated developmental cystic kidney disease, isolated diabetes, the combination of both (known as RCAD- renal cysts and diabetes), and may additionally have a number of other features.  These include asymptomatic elevation of liver enzymes, genital tract malformations, hypomagnesemia wasting, hyperuricemia and gout. Typically, there is hypoplasia of the pancreas which is frequently accompanied by pancreatic exocrine dysfunction, which can be subclinical or overt (48,49).

Importantly, the same gene variant can lead to any of the above presentations.  It is not uncommon to have families with a mixture of phenotypes. Thus, a family history of cystic renal disease in a patient presenting with young-onset diabetes atypical for either type 1 or type 2 diabetes should prompt consideration of this gene.

Unlike the other hepatic nuclear transcription factor-MODY subtypes, HNF1B-MODY is not typically sensitive to sulfonylureas (50). There have not been rigorous studies of other non-insulin therapies in HNF1B-MODY. The majority of affected individuals require insulin therapy (51).

The HNF1B gene resides on the long arm of chromosome 17. Deletions of 17q12 lead to neurologic features, including cognitive impairment and autism spectrum disorder and may also include HNF1B-MODY (52,53). There is a 17q12 foundation that such patients can be directed to for additional support as their neurologic features are often challenging.

GCK-MODY

GCK-MODY is the second most common subtype of MODY and is distinctive from other MODY types and polygenic forms of diabetes. It is characterized by stable, mild hyperglycemia owing to an increased set-point for glucose stimulated insulin release. HbA1c ranges from 5.6-7.6%(54). The microvascular and macrovascular complications typical of other polygenic and monogenic forms of diabetes are exceedingly rare in GCK-MODY (55). Pharmacologic treatment is not effective or needed for GCK-MODY, with the exception of pregnancy in a woman with GCK-MODY (56). In pregnancy, appropriate management is predicated on the genotype of the fetus.  If the fetus inherits the GCK mutation, mildly elevated maternal blood glucose levels are sensed as normal by the fetus and treatment is not needed. If the fetus does not carry the mutation, the mildly elevated maternal blood glucose levels will prompt increased insulin secretion by the fetus which can lead to macrosomia. Unfortunately, fetal genotype is usually unknown, although this should change with advancing fetal cDNA applications. Current practice is to infer fetal genotype based on abdominal circumference (FAC) on second trimester ultrasound, with a FAC >75% suggestive of unaffected status. In these cases, insulin therapy should be considered. However, blood glucose targets should be adjusted to higher levels than typical for pregnancy to account for the counterregulatory response that is altered in GCK-MODY (57). It is important to note that best management of GCK-MODY in pregnancy is debated, with some favoring universal early insulin administration. However, given the risks of maternal hypoglycemia, risk of impaired fetal growth in affected babies, and lack of demonstrated efficacy, these authors endorse the former management, guided by known or inferred fetal genotype (58).

ADDITIONAL BENEFITS OF ACCURATE MONOGENIC DIABETES DIAGNOSIS

There are several monogenic diabetes subtypes where insulin is the best or only treatment available. Additionally, for those subtypes with genetically-targeted therapy discussed above, not all affected individuals will respond or be maintained on these therapies and insulin may be necessary. However, genetic testing for accurate diagnosis is still beneficial for multiple reasons. Establishing a molecular diagnosis can often provide a unifying diagnosis for multiple, seemingly unrelated medical conditions, such as in the case of HNF1B-MODY. It also allows for earlier and proactive medical surveillance of extra-pancreatic manifestations, such as early referral to developmental specialists for children with KATP-related neonatal diabetes and

neurodevelopmental challenges.  Additionally, at-risk and affected family members can be identified and conception counseling can be provided.

CONCLUSIONS

The substantial worldwide burden of diabetes, in terms of sheer numbers and also cost, make it imperative that outcomes are optimized. Early accurate classification to direct management is a crucial step. Since the conception of the Precision Medicine Initiative in 2015, more attention and excitement has been garnered toward tailoring treatment to the individual characteristics of patients.  Monogenic diabetes represents an opportunity to use a precision medicine approach to improve therapy selection and management of diabetes to improve glycemic outcomes for affected individuals, often while lowering burden and cost of care (59).  The lessons that we learn from the continued investigation into the single gene causes of diabetes will inform our understanding of polygenic diabetes, including how to best subclassify the heterogeneous presentations of type 2 diabetes to guide first-line therapy selection and add-on therapies, expanding the scope of precision medicine in diabetes.

REFERENCES 

  1. Kanakatti Shankar R, Pihoker C, Dolan LM, Standiford D, Badaru A, Dabelea D, Rodriguez B, Black MH, Imperatore G, Hattersley A, Ellard S, Gilliam LK, SEARCH for Diabetes in Youth Study Group. Permanent neonatal diabetes mellitus: prevalence and genetic diagnosis in the SEARCH for Diabetes in Youth Study. Pediatr Diabetes 2013;14(3):174–180. doi:10.1111/pedi.12003.
  2. Shepherd M, Shields B, Hammersley S, Hudson M, McDonald TJ, Colclough K, Oram RA, Knight B, Hyde C, Cox J, Mallam K, Moudiotis C, Smith R, Fraser B, Robertson S, Greene S, Ellard S, Pearson ER, Hattersley AT, UNITED Team. Systematic Population Screening, Using Biomarkers and Genetic Testing, Identifies 2.5% of the U.K. Pediatric Diabetes Population With Monogenic Diabetes. Diabetes Care 2016;39(11):1879–1888. doi:10.2337/dc16-0645.
  3. Shields BM, Shepherd M, Hudson M, McDonald TJ, Colclough K, Peters J, Knight B, Hyde C, Ellard S, Pearson ER, Hattersley AT, team OBOTUS. Population-Based Assessment of a Biomarker-Based Screening Pathway to Aid Diagnosis of Monogenic Diabetes in Young-Onset Patients. Diabetes Care 2017;40(8):dc170224–1025. doi:10.2337/dc17-0224.
  4. Greeley SAW, John PM, Winn AN, Ornelas J, Lipton RB, Philipson LH, Bell GI, Huang ES. The Cost-Effectiveness of Personalized Genetic Medicine: The case of genetic testing in neonatal diabetes. Diabetes Care 2011;34(3):622–627. doi:10.2337/dc10-1616.
  5. Johnson SR, Carter HE, Leo P, Hollingworth SA, Davis EA, Jones TW, Conwell LS, Harris M, Brown MA, Graves N, Duncan EL. Cost-effectiveness Analysis of Routine Screening Using Massively Parallel Sequencing for Maturity-Onset Diabetes of the Young in a Pediatric Diabetes Cohort: Reduced Health System Costs and Improved Patient Quality of Life. Diabetes Care 2018:dc180261. doi:10.2337/dc18-0261.
  6. GoodSmith MS, Skandari MR, Huang ES, Naylor RN. The Impact of Biomarker Screening and Cascade Genetic Testing on the Cost-Effectiveness of MODY Genetic Testing. Diabetes Care 2019;42(12):2247–2255. doi:10.2337/dc19-0486.
  7. Naylor RN, John PM, Winn AN, Carmody D, Greeley SAW, Philipson LH, Bell GI, Huang ES. Cost-effectiveness of MODY genetic testing: translating genomic advances into practical health applications. Diabetes Care 2014;37(1):202–209. doi:10.2337/dc13-0410.
  8. Nguyen HV, Finkelstein EA, Mital S, Gardner DS-L. Incremental cost-effectiveness of algorithm-driven genetic testing versus no testing for Maturity Onset Diabetes of the Young (MODY) in Singapore. J Med Genet 2017;54(11):747–753. doi:10.1136/jmedgenet-2017-104670.
  9. Alkorta-Aranburu G, Carmody D, Cheng YW, Nelakuditi V, Ma L, Dickens JT, Das S, Greeley SAW, del Gaudio D. Phenotypic heterogeneity in monogenic diabetes: The clinical and diagnostic utility of a gene panel-based next-generation sequencing approach. Molecular Genetics and Metabolism 2014;113(4):315–320. doi:10.1016/j.ymgme.2014.09.007.
  10. Ellard S, Allen HL, De Franco E, Flanagan SE, Hysenaj G, Colclough K, Houghton JAL, Shepherd M, Hattersley AT, Weedon MN, Caswell R. Improved genetic testing for monogenic diabetes using targeted next-generation sequencing. Diabetologia 2013;56(9):1958–1963. doi:10.1007/s00125-013-2962-5.
  11. Amendola LM, Jarvik GP, Leo MC, McLaughlin HM, Akkari Y, Amaral MD, Berg JS, Biswas S, Bowling KM, Conlin LK, Cooper GM, Dorschner MO, Dulik MC, Ghazani AA, Ghosh R, Green RC, Hart R, Horton C, Johnston JJ, Lebo MS, Milosavljevic A, Ou J, Pak CM, Patel RY, Punj S, Richards CS, Salama J, Strande NT, Yang Y, Plon SE, Biesecker LG, Rehm HL. Performance of ACMG-AMP Variant-Interpretation Guidelines among Nine Laboratories in the Clinical Sequencing Exploratory Research Consortium. The American Journal of Human Genetics 2016;98(6):1067–1076. doi:10.1016/j.ajhg.2016.03.024.
  12. Richards S, Aziz N, Bale S, Bick D, Das S, Gastier-Foster J, Grody WW, Hegde M, Lyon E, Spector E, Voelkerding K, Rehm HL. Standards and guidelines for the interpretation of sequence variants: a joint consensus recommendation of the American College of Medical Genetics and Genomics and the Association for Molecular Pathology. Genet Med 2015;17(5):405–423. doi:10.1038/gim.2015.30.
  13. Shields BM, Hicks S, Shepherd MH, Colclough K, Hattersley AT, Ellard S. Maturity-onset diabetes of the young (MODY): how many cases are we missing? Diabetologia 2010;53(12):2504–2508. doi:10.1007/s00125-010-1799-4.
  14. Thanabalasingham G, Pal A, Selwood MP, Dudley C, Fisher K, Bingley PJ, Ellard S, Farmer AJ, McCarthy MI, Owen KR. Systematic assessment of etiology in adults with a clinical diagnosis of young-onset type 2 diabetes is a successful strategy for identifying maturity-onset diabetes of the young. Diabetes Care 2012;35(6):1206–1212. doi:10.2337/dc11-1243.
  15. Pihoker C, Gilliam LK, Ellard S, Dabelea D, Davis C, Dolan LM, Greenbaum CJ, Imperatore G, Lawrence JM, Marcovina SM, Mayer-Davis E, Rodriguez BL, Steck AK, Williams DE, Hattersley AT, SEARCH for Diabetes in Youth Study Group. Prevalence, characteristics and clinical diagnosis of maturity onset diabetes of the young due to mutations in HNF1A, HNF4A, and glucokinase: results from the SEARCH for Diabetes in Youth. J. Clin. Endocrinol. Metab. 2013;98(10):4055–4062. doi:10.1210/jc.2013-1279.
  16. TODD J, KLEINBERGER JW, SRINIVASAN S, TOLLEFSEN SE, LEVITSKY LL, KATZ LEL, TRYGGESTAD JB, BACHA F, Imperatore G, Lawrence JM, Pihoker C, DIVERS J, FLANNICK J, Dabelea D, FLOREZ JC, Pollin TI. Monogenic Diabetes in the Progress for Diabetes Genetics in Youth (ProDiGY) Collaboration. Diabetes 2018;67(Supplement 1):268–OR. doi:10.2337/db18-268-OR.
  17. Naylor R, Philipson LH. Who should have genetic testing for maturity‐onset diabetes of the young? Clinical Endocrinology 2011;75(4):422–426. doi:10.1111/j.1365-2265.2011.04049.x.
  18. Hattersley AT, Greeley S, Polak M. ISPAD Clinical Practice Consensus Guidelines 2018: The diagnosis and management of monogenic diabetes in children and adolescents. 2018.
  19. Letourneau LR, Greeley SAW. Congenital forms of diabetes: the beta-cell and beyond. Current Opinion in Genetics & Development 2018;50:25–34. doi:10.1016/j.gde.2018.01.005.
  20. Strakova V, Elblova L, Johnson MB, Dusatkova P, Obermannova B, Petruzelkova L, Kolouskova S, Snajderova M, Fronkova E, Svaton M, Lebl J, Hattersley AT, Sumnik Z, Pruhova S. Screening of monogenic autoimmune diabetes among children with type 1 diabetes and multiple autoimmune diseases: is it worth doing? Journal of Pediatric Endocrinology and Metabolism 2019;32(10):1147–1153. doi:10.1515/jpem-2019-0261.
  21. Johnson MB, Patel KA, De Franco E, Houghton JAL, McDonald TJ, Ellard S, Flanagan SE, Hattersley AT. A type 1 diabetes genetic risk score can discriminate monogenic autoimmunity with diabetes from early-onset clustering of polygenic autoimmunity with diabetes. Diabetologia 2018;61(4):862–869. doi:10.1007/s00125-018-4551-0.
  22. KLEINBERGER JW, Copeland KC, Gandica RG, Haymond MW, LEVITSKY LL, Linder B, Shuldiner AR, Tollefsen S, White NH, Pollin TI. Monogenic diabetes in overweight and obese youth diagnosed with type 2 diabetes: the TODAY clinical trial. Genet Med 2018;20(6):583–590. doi:10.1038/gim.2017.150.
  23. Shields BM, McDonald TJ, Ellard S, Campbell MJ, Hyde C, Hattersley AT. The development and validation of a clinical prediction model to determine the probability of MODY in patients with young-onset diabetes. Diabetologia 2012;55(5):1265–1272. doi:10.1007/s00125-011-2418-8.
  24. Misra S, Shields B, Colclough K, Johnston DG, Oliver NS, Ellard S, Hattersley AT. South Asian individuals with diabetes who are referred for MODY testing in the UK have a lower mutation pick-up rate than white European people. Diabetologia 2016;59(10):2262–2265. doi:10.1007/s00125-016-4056-7.
  25. Lemelman MB, Letourneau L, Greeley SAW. Neonatal Diabetes Mellitus: An Update on Diagnosis and Management. Clinics in Perinatology 2018;45(1):41–59. doi:10.1016/j.clp.2017.10.006.
  26. Ashcroft FM, Puljung MC, Vedovato N. Neonatal Diabetes and the KATP Channel: From Mutation to Therapy. Trends in Endocrinology & Metabolism 2017;28(5):377–387. doi:10.1016/j.tem.2017.02.003.
  27. Lanning MS, Carmody D, Szczerbiński Ł, Letourneau LR, Naylor RN, Greeley SAW. Hypoglycemia in sulfonylurea‐treated KCNJ11‐neonatal diabetes: Mild‐moderate symptomatic episodes occur infrequently but none involving unconsciousness or seizures. Pediatr Diabetes 2018;19(3):393–397. doi:10.1111/pedi.12599.
  28. Thurber BW, Carmody D, Tadie EC, Pastore AN, Dickens JT, Wroblewski KE, Naylor RN, Philipson LH, Greeley SAW, Group TUSNDW. Age at the time of sulfonylurea initiation influences treatment outcomes in <Emphasis Type=“Italic”>KCNJ11</Emphasis>-related neonatal diabetes. Diabetologia 2015;58(7):1430–1435. doi:10.1007/s00125-015-3593-9.
  29. Mackay DJG, Temple IK. Transient neonatal diabetes mellitus type 1. Weksberg R, Temple K, eds. American Journal of Medical Genetics Part C: Seminars in Medical Genetics 2010;154C(3):335–342. doi:10.1002/ajmg.c.30272.
  30. Docherty LE, Kabwama S, Lehmann A, Hawke E, Harrison L, Flanagan SE, Ellard S, Hattersley AT, Shield JPH, Ennis S, Mackay DJG, Temple IK. Clinical presentation of 6q24 transient neonatal diabetes mellitus (6q24 TNDM) and genotype–phenotype correlation in an international cohort of patients. Diabetologia 2013;56(4):758–762. doi:10.1007/s00125-013-2832-1.
  31. Garcin L, Kariyawasam D, Busiah K, Amsellem ALF, Le Bourgeois F, Douret LV, Cavé H, Polak M, Beltrand J. Successful off‐label sulfonylurea treatment of neonatal diabetes mellitus due to chromosome 6 abnormalities. Pediatr Diabetes 2018;19(4):663–669. doi:10.1111/pedi.12635.
  32. Bellanné-Chantelot C, Lévy DJ. Clinical characteristics and diagnostic criteria of maturity-onset diabetes of the young (MODY) due to molecular anomalies of the HNF1A gene. The Journal of … 2011.
  33. Colclough K, Bellanné-Chantelot C, Saint-Martin C, Flanagan SE, Ellard S. Mutations in the genes encoding the transcription factors hepatocyte nuclear factor 1 alpha and 4 alpha in maturity-onset diabetes of the young and hyperinsulinemic hypoglycemia. Hum. Mutat. 2013;34(5):669–685. doi:10.1002/humu.22279.
  34. Pontoglio M, Prié D, Cheret C, Doyen A, Leroy C, Froguel P, Velho G, Yaniv M, Friedlander G. HNF1α controls renal glucose reabsorption in mouse and man. EMBO reports 2000;1(4):359–365. doi:10.1093/embo-reports/kvd071.
  35. McDonald TJ, Shields BM, Lawry J, Owen KR, Gloyn AL, Ellard S, Hattersley AT. High-sensitivity CRP discriminates HNF1A-MODY from other subtypes of diabetes. Diabetes Care 2011;34(8):1860–1862. doi:10.2337/dc11-0323.
  36. Steele AM, Shields BM, Shepherd M, Ellard S, Hattersley AT, Pearson ER. Increased all-cause and cardiovascular mortality in monogenic diabetes as a result of mutations in the HNF1A gene. Diabet. Med. 2010;27(2):157–161. doi:10.1111/j.1464-5491.2009.02913.x.
  37. Haddouche A, Chantelot CB, Rod A, Fournier L, Chiche L, Gautier JF, Timsit J, Laboureau S, Chaillous L, Valero R, Larger E, Jeandidier N, Wilhelm JM, Popelier M, Guillausseau PJ, Thivolet C, Lecomte P, Benhamou PY, Reznik Y. Liver adenomatosis in patients with hepatocyte nuclear factor‐1 alpha maturity onset diabetes of the young (HNF1A‐MODY): Clinical, radiological and pathological characteristics in a French series. Journal of Diabetes 2020;12(1):48–57. doi:10.1111/1753-0407.12959.
  38. Shepherd M, Shields B, Ellard S, Cabezas OR, Hattersley AT. A genetic diagnosis of HNF1A diabetes alters treatment and improves glycaemic control in the majority of insulin‐treated patients. Diabet. Med. 2009;26(4):437–441. doi:10.1111/j.1464-5491.2009.02690.x.
  39. Bacon S, Kyithar MP, Rizvi SR, Donnelly E, McCarthy A, Burke M, Colclough K, Ellard S, Byrne MM. Successful maintenance on sulphonylurea therapy and low diabetes complication rates in a HNF1A-MODY cohort. Diabet. Med. 2016;33(7):976–984. doi:10.1111/dme.12992.
  40. Shepherd MH, Shields BM, Hudson M, Pearson ER, Hyde C, Ellard S, Hattersley AT, Patel KA, study FTU. A UK nationwide prospective study of treatment change in MODY: genetic subtype and clinical characteristics predict optimal glycaemic control after discontinuing insulin and metformin. Diabetologia 2018;61(12):2520–2527. doi:10.1007/s00125-018-4728-6.
  41. Tuomi T, Honkanen EH, Isomaa B, Sarelin L, Groop LC. Improved prandial glucose control with lower risk of hypoglycemia with nateglinide than with glibenclamide in patients with maturity-onset diabetes of the young type 3. Diabetes Care 2006;29(2):189–194.
  42. Østoft SH, Bagger JI, Hansen T, Pedersen O, Faber J, Holst JJ, Knop FK, Vilsbøll T. Glucose-lowering effects and low risk of hypoglycemia in patients with maturity-onset diabetes of the young when treated with a GLP-1 receptor agonist: a double-blind, randomized, crossover trial. Diabetes Care 2014;37(7):1797–1805. doi:10.2337/dc13-3007.
  43. Christensen AS, Hædersdal S, Støy J, Storgaard H, Kampmann U, Forman JL, Seghieri M, Holst JJ, Hansen T, Knop FK, Vilsbøll T. Efficacy and Safety of Glimepiride With or Without Linagliptin Treatment in Patients With HNF1A Diabetes (Maturity-Onset Diabetes of the Young Type 3): A Randomized, Double-Blinded, Placebo-Controlled, Crossover Trial (GLIMLINA). Diabetes Care 2020;43(9):2025–2033. doi:10.2337/dc20-0408.
  44. Pearson ER, Boj SF, Steele AM, Barrett T, Stals K, Shield JP, Ellard S, Ferrer J, Hattersley AT. Macrosomia and Hyperinsulinaemic Hypoglycaemia in Patients with Heterozygous Mutations in the HNF4A Gene. Groop LC, ed. PLOS Medicine 2007;4(4):e118. doi:10.1371/journal.pmed.0040118.
  45. Pearson ER, Pruhova S, Tack CJ, Johansen A, Castleden HAJ, Lumb PJ, Wierzbicki AS, Clark PM, Lebl J, Pedersen O, Ellard S, Hansen T, Hattersley AT. Molecular genetics and phenotypic characteristics of MODY caused by hepatocyte nuclear factor 4α mutations in a large European collection. Diabetologia 2005;48(5):878–885. doi:10.1007/s00125-005-1738-y.
  46. Broome DT, Tekin Z, Pantalone KM, Mehta AE. Novel Use of GLP-1 Receptor Agonist Therapy in HNF4A-MODY. Diabetes Care 2020;43(6):e65–e65. doi:10.2337/dc20-0012.
  47. Tonouchi R, Mine Y, Aoki M, Okuno M, Suzuki J, Urakami T. Efficacy and safety of alogliptin in a pediatric patient with maturity-onset diabetes of the young type 1. Clinical Pediatric Endocrinology 2017;26(3):183–188. doi:10.1297/cpe.26.183.
  48. Clissold RL, Hamilton AJ, Hattersley AT, Ellard S, Bingham C. HNF1B-associated renal and extra-renal disease-an expanding clinical spectrum. Nat Rev Nephrol 2015;11(2):102–112. doi:10.1038/nrneph.2014.232.
  49. Clissold R, Shields B, Ellard S, Hattersley A, Bingham C. Assessment of the HNF1B Score as a Tool to Select Patients for HNF1B Genetic Testing. Nephron 2015;130(2):134–140. doi:10.1159/000398819.
  50. Pearson ER, Badman MK, Lockwood CR, Clark PM, Ellard S, Bingham C, Hattersley AT. Contrasting Diabetes Phenotypes Associated With Hepatocyte Nuclear Factor-1  and -1  Mutations. Diabetes Care 2004;27(5):1102–1107. doi:10.2337/diacare.27.5.1102.
  51. Dubois-Laforgue D, Cornu E, Saint-Martin C, Coste J, Bellanné-Chantelot C, Timsit J, Monogenic Diabetes Study Group of the Société Francophone du Diabète. Diabetes, Associated Clinical Spectrum, Long-term Prognosis and Genotype/Phenotype Correlations in 201 Adult Patients With Hepatocyte Nuclear Factor 1 B (HNF1B) Molecular Defects. Diabetes Care 2017:dc162462. doi:10.2337/dc16-2462.
  52. Dixit A, Patel C, Harrison R, Jarvis J, Hulton S, Smith N, Yates K, Silcock L, McMullan DJ, Suri M. 17q12 microdeletion syndrome: Three patients illustrating the phenotypic spectrum. American Journal of Medical Genetics Part A 2012;158A(9):2317–2321. doi:10.1002/ajmg.a.35520.
  53. Bockenhauer D, Jaureguiberry G. HNF1B-associated clinical phenotypes: the kidney and beyond. Pediatr Nephrol 2016;31(5):707–714. doi:10.1007/s00467-015-3142-2.
  54. Steele AM, Wensley KJ, Ellard S, Murphy R, Shepherd M, Colclough K, Hattersley AT, Shields BM. Use of HbA1c in the identification of patients with hyperglycaemia caused by a glucokinase mutation: observational case control studies. Lin XE, ed. PLoS ONE 2013;8(6):e65326. doi:10.1371/journal.pone.0065326.
  55. Steele AM, Shields BM, Wensley KJ, Colclough K, Ellard S, Hattersley AT. Prevalence of Vascular Complications Among Patients With Glucokinase Mutations and Prolonged, Mild Hyperglycemia. JAMA 2014;311(3):279–286. doi:10.1001/jama.2013.283980.
  56. Stride A, Shields B, Gill-Carey O, Chakera AJ, Colclough K, Ellard S, Hattersley AT. Cross-sectional and longitudinal studies suggest pharmacological treatment used in patients with glucokinase mutations does not alter glycaemia. Diabetologia 2014;57(1):54–56. doi:10.1007/s00125-013-3075-x.
  57. Chakera AJ, Steele AM, Gloyn AL, Shepherd MH, Shields B, Ellard S, Hattersley AT. Recognition and Management of Individuals With Hyperglycemia Because of a Heterozygous Glucokinase Mutation. Diabetes Care 2015;38(7):1383–1392. doi:10.2337/dc14-2769.
  58. Dickens LT, Letourneau LR, Sanyoura M, Greeley SAW, Philipson LH, Naylor RN. Management and pregnancy outcomes of women with GCK-MODY enrolled in the US Monogenic Diabetes Registry. Acta Diabetol 2019;56(4):405–411. doi:10.1007/s00592-018-1267-z.
  59. Chung WK, Erion K, FLOREZ JC, Hattersley AT, Hivert M-F, Lee CG, McCarthy MI, Nolan JJ, Norris JM, Pearson ER, Philipson L, McElvaine AT, Cefalu WT, Rich SS, Franks PW. Precision medicine in diabetes : a Consensus Report from the American Diabetes Association (ADA) and the European Association for the Study of Diabetes (EASD). Diabetologia 2020;63(9):1671–1693. doi:10.1007/s00125-020-05181-w.