ABSTRACT
Fungi are ubiquitous microbes and form a fraction of the symbiotic human microbiome. Transition from normal commensals to opportunistic mycoses can occur in immunocompromised hosts. Endemic mycoses are caused by fungi that are acquired from environmental sources. Fungal infections can be classified based on the depth of tissue invasion. Superficial diseases are limited to skin, nails, and mucous membrane while systemic dissemination can affect multiple organs including endocrine glands. Fungal involvement of the adrenals, pituitary, thyroid, pancreas, and gonads is well recognized. On the other hand, individual with diabetes mellitus and Cushing’s syndrome are susceptible to fungal disease as a result of immune dysfunction. Mucormycosis, candidiasis, and dermatophytosis occur more commonly in diabetes. Exogenous as well as endogenous Cushing’s syndrome is another endocrine disorder that predisposes to systemic fungal diseases. High index of suspicion is necessary to recognise these infections as clinical manifestations can be masked due to the anti-inflammatory properties of glucocorticoids. Autoimmune polyendocrine syndrome type I (APS-1) is a unique genetic disease where autoimmune damage predisposes to chronic mucocutaneous candidiasis (CMC) and a multitude of endocrine anomalies. Antifungal agents like azoles and polyenes can adversely affect the normal functioning of various endocrine pathways. Errors in diagnosis and treatment of the fungal infections of the endocrine glands can be critical. Equally important is to identify the various fungal diseases occurring in diabetes and other endocrine disorders. Conditions that predispose to fungal diseases such as diabetes and immunosuppressed states in organ-transplant recipients are becoming increasingly prevalent. Understanding of the critical interplay between the endocrine system and fungal pathogens are imperative for optimal patient outcomes in modern medicine.
INTRODUCTION
Fungi are classified as a separate kingdom that consists of single-celled or complex multicellular organisms. They are heterotrophs and unlike autotrophic plants, fungi lack chlorophyll and cannot synthesize their own food. They acquire nutrients from the surrounding media by osmosis.
Fungi are ubiquitous, transient, or persistent human colonizers which form the fungal microbiota or mycobiome. The human microbiota consists of a diverse array of microorganisms such as viruses, bacteria, fungi, protozoa, and parasites that reside in and around the human body. Fungi comprise ≤0.1% of the total human microbiota, but it still plays a crucial role in human health and disease (1).
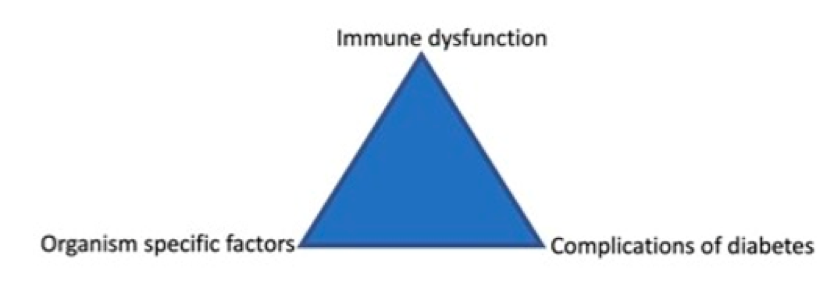
Fungal species have complex interactions with the human host, which can be viewed as a spectrum of symbiotic relationships. The association can be mutualistic where it is advantageous to both, or commensal where only one profits but the other is unharmed. On the other hand, the connection can be parasitic where the fungi are benefitted with a damaging effect on the human host, or amensalistic where one organism is harmed but the other remains unaffected. These human fungal symbionts can transition from commensalism to parasitism within the body. Immune dysfunction is one of the common factors that influence this conversion. Endocrine diseases like diabetes mellitus, Cushing’s syndrome, and autoimmune polyglandular syndrome type 1 (APS1) are prone to fungal infections due to immune dysfunction.
The prevalence of superficial fungal infection is 20-25% (2). On the other hand, fungal infections tend to spread in individuals with low immunity such as patients with cancer or acquired immunodeficiency syndrome (AIDS) and recipients of immunosuppressive drugs. The reported incidence of invasive fungal disease is 5.9 cases per thousand per year (3). The dissemination may affect various endocrine glands leading to their dysfunction, the adrenal gland being the one most commonly involved. Endocrine system involvement in fungal infections would extend to the adverse effect of various antifungal therapy too. Azoles are the most frequently described class affecting the endocrine system and, adrenal glands and gonads are their primary targets.
The diverse aspects of this complex relationship between fungi and the endocrine system are described in this chapter.
TYPES OF FUNGAL INFECTION
Fungal infections have been classified based on both anatomic location and epidemiology. They can also be classified on the basis of morphological structure of the fungus.
Anatomical Categories
MUCOCUTANEOUS INFECTIONS
Mucocutaneous infections is a heterogeneous group characterized by infections of the skin, mucous membranes, and the nails. These infections are confined to the cutaneous surface, with little propensity for systemic dissemination. The effect can vary from mild to severe depending on the extent of involvement but are rarely fatal.
DEEP ORGAN INFECTIONS
Fungal infections can sometimes cause deep tissue involvement and have the potential for hematogenous and systemic spread. Dissemination of fungal infections is usually observed in immunocompromised conditions. If untreated, deep organ or systemic fungal affection can be fatal.
Epidemiological Categories
ENDEMIC MYCOSES
Endemic mycoses include infections caused by fungi that do not belong to the normal human microbiota but rather are acquired from environmental sources. In endemic mycosis, deep organ infection is almost exclusively caused by inhalation, whereas cutaneous disease is most often caused by direct contact with soil but can also occasionally result from hematogenous dissemination. Dermatophytid fungi are mainly acquired by environmental contact however, human-to-human transmission has been reported. Examples of endemic mycoses include coccidioidomycosis, paracoccidioidomycosis, histoplasmosis, blastomycosis, penicilliosis, phaeohyphomycosis, sporotrichosis, and adiaspiromycosis.
OPPORTUNISTIC MYCOSES
Opportunistic fungi can be normal human microbiota components, but in the immunocompromised state, these organism transition from harmless commensals to invasive pathogens. These fungi invade the host from the usual sites of colonization, typically the mucous membranes or the gastrointestinal tract. Typical examples are candidiasis, aspergillosis, mucormycosis (zygomycosis), cryptococcosis, scedosporiosis, trichosporonosis, fusariosis, and pneumocystosis. Fungi that are reported to affect the various endocrine glands are shown in table 1.
|
Table 1. Fungi Affecting Specific Endocrine Glands
|
|
Type of fungus
|
Organs affected
|
|
Aspergillosis
|
Pituitary, Thyroid, Pancreas, Adrenal
|
|
Zygomycosis
|
Thyroid
|
|
Candidiasis
|
Pituitary, Thyroid, Pancreas, Testis
|
|
Cryptococcosis
|
Thyroid, Pancreas, Adrenal, Testis
|
|
Histoplasmosis
|
Thyroid, Adrenal, Ovaries,
|
|
Blastomycosis
|
Testis, Ovaries
|
|
Coccidioidomycosis
|
Thyroid, Adrenal,
|
|
Paracoccidioidomycosis
|
Thyroid, Adrenal
|
|
Pneumocystis jirovecii
|
Pituitary, Thyroid, Parathyroid, Pancreas, Adrenal
|
Based on Morphology
YEASTS
Yeast are found as single rounded cells or as budding organisms. Examples are Saccharomyces cerevisiae, Candida albicans, and Leucosporidium frigidum.
MOLDS
Molds grow in filamentous forms called hyphae both at room temperature and in invaded tissue. The common molds are aspergillus (A. fumigatus, A flavus, and A brasiliensis), penicillium and rhizopus.
DIMORPHIC
Dimorphic fungi grow as yeasts or large spherical structures in the tissue but as filamentous forms at room temperature in the environment. These include histoplasma (H. capsulatum), blastomyces (B. dermatitidis), paracoccidioides (P. brasiliensis), coccidioides (C. immitis), penicillium (P. marneffei), and sporothrix (S schenckii).

Figure 1. Classification of Fungal Infections
FUNGAL DISEASES OF MAJOR ENDOCRINE GLANDS
Fungal infections are more prevalent in the immunocompromised state (table 2). There is a tendency for fungal infections to disseminate in such cases and affect endocrine organs like the pituitary, thyroid, parathyroid, pancreas, adrenal glands, and gonads. The involvement of these endocrine glands may lead to deficient hormone secretion. The clinical manifestations, diagnosis, and management of fungal infection of the major endocrine glands are discussed below.
|
Table 2. Conditions Predisposing to Systemic Fungal Infections
|
|
A. Endocrine diseases
1. Diabetes mellitus
2. Cushing’s syndrome
3. Autoimmune polyendocrine syndrome-1
4. STAT5b deficiency (Congenital Insulin-like Growth Factor-1 Deficiency)
B. Immunosuppressed states
1. Cancer
2. Acquired immunodeficiency syndrome
3. Acute leukemia
4. Hematopoietic stem cell transplant recipients
5. Solid-organ transplant recipients
6. Recipients of immunosuppressive drugs in conditions like connective tissue diseases
|
Pituitary Fungal Infections
ETIOLOGY
Pituitary infections or abscesses are rare and account for less than 1% of pituitary lesions (4). Even among them, fungal infections are extremely unusual and occur predominantly in immunocompromised states. The mode of spread could be hematogenous, extension from adjacent structures like meninges, sphenoid sinus, cavernous sinus, and skull base, or iatrogenic during transsphenoidal procedures. Fungal infection of the pituitary can occur in the presence of underlying lesions like pituitary adenoma, Rathke’s cleft cyst, etc. Cushing’s syndrome, resulting from an adrenocorticotrophic hormone (ACTH) secreting pituitary adenoma, itself causes immunosuppression and further predisposes to fungal disease (5). Aspergillus is the most frequently reported fungal infection of the pituitary (6–8). Other fungi described to infect the pituitary include candida (9,10), Pneumocystis jirovecii (in HIV/AIDS) (11,12), and coccidia (13). In a review of 13 cases of pituitary aspergillus infection, five were immunosuppressed (14).
CLINICAL FEATURES
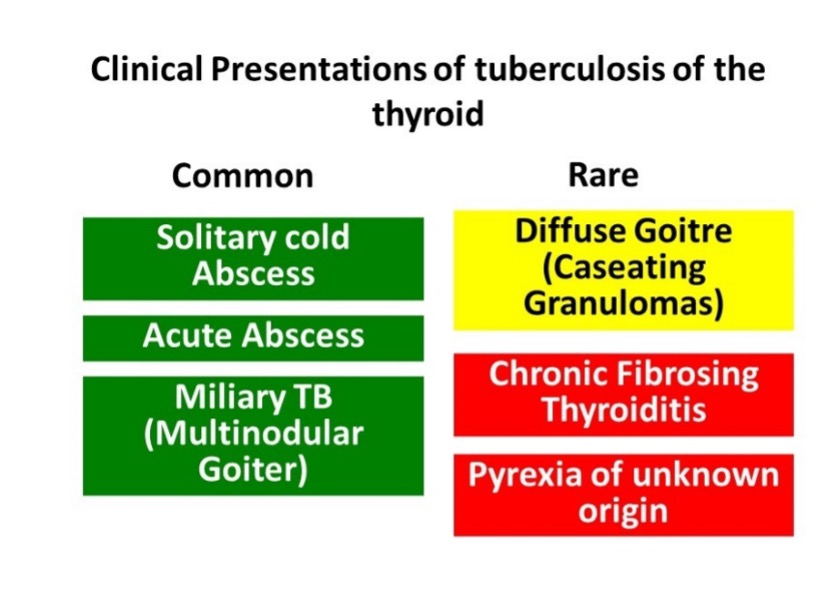
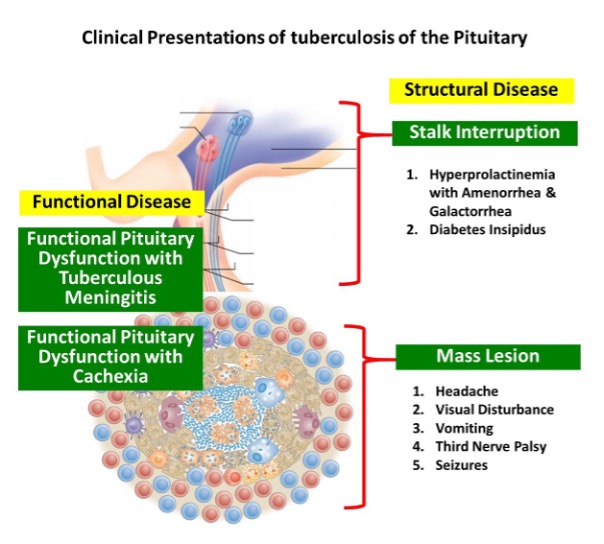
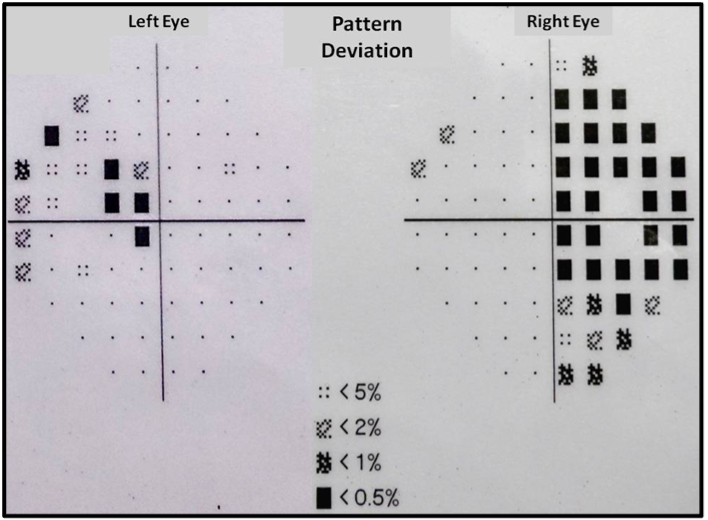
The clinical presentation of fungal infection of the pituitary can be variable (table 3). Symptoms from mass effects such as headache, visual disturbances (due to optic chiasma compression), and ophthalmoplegia are the usual presenting features. Features suggestive of infection, such as fever, leukocytosis, and meningismus were absent in most of the reported cases (8,15,16). Aspergillus is known to cause angioinvasion and vasculitis, and thus can be additionally associated with features arising from cerebrovascular infarcts (8,14). Pituitary insufficiency can acutely manifest as hypotension and shock primarily from secondary hypoadrenalism (9). Gonadotrophin and other hormone secretion can be affected as a delayed sequalae, but such reports are very rare (17). Pituitary stalk compression can induce hyperprolactinemia (18). Diabetes insipidus (DI) occur more frequently than seen with pituitary adenomas (10).
|
Table 3. Clinical Profile of Recently Reported Cases of Pituitary Aspergillus Infection
|
|
Author, year
|
Clinical setting
|
Symptoms
|
Diagnosis
|
Management/
outcome
|
|
Moore, 2016 (8)
|
74-year old male,
CAD, CKD, AHA hypertension
|
Right eye pain, headaches, 10 months of worsening left hemiparesis
|
Imaging - right ICA occlusion, acute right pontine stroke, smaller infarcts in the right MCA territory
|
Fatal outcome, autopsy findings revealed fungal hyphae in pituitary
|
|
Choi, 2021(15)
|
75-year old male, DM, hypertension, lung aspergillosis
|
Headache, visual disturbance, hyponatremia
|
MRI - bilateral sphenoid sinusitis and pituitary involvement, transsphenoidal biopsy demonstrated invasive aspergillus
|
Endoscopic debridement of sinuses. Oral voriconazole given, gradual improvement
|
|
Saffarian,2018 (16)
|
60-year old male
DM, hypertension, sphenoid aspergilloma
|
Headache, progressive visual loss, 4thcranial nerve palsy
|
MRI findings, endoscopy by nasal approach demonstrated aspergillus in biopsy
|
Endoscopic drainage, intravenous amphotericin, responded to treatment
|
|
Ouyang, 2015 (18)
|
55-year old female,
no comorbidities
|
Headache, dizziness, and decreased visual acuity
|
MRI - sellar and sphenoid sinus
mass
Prolactin - 815 ng/mL
|
Transnasal, transsphenoidal removal of the mass and oral voriconazole – resolution of symptoms
|
|
Vijay-vargiya, 2013 (14)
|
68-year old female,
kidney transplant recipient
|
Headache, left temporal hemianopsia, ptosis.
|
MRI – sellar mass
Intraoperative frozen
section showed organisms consistent with aspergillus
|
Transsphenoidal resection, voriconazole, Developed ACA ischemic stroke, died.
|
CAD – coronary artery disease, AHA – autoimmune hemolytic anemia, ICA – internal carotid artery, MCA – middle cerebral artery, ACA – anterior cerebral artery, DM – diabetes mellitus, MRI – magnetic resonance imaging
DIAGNOSIS
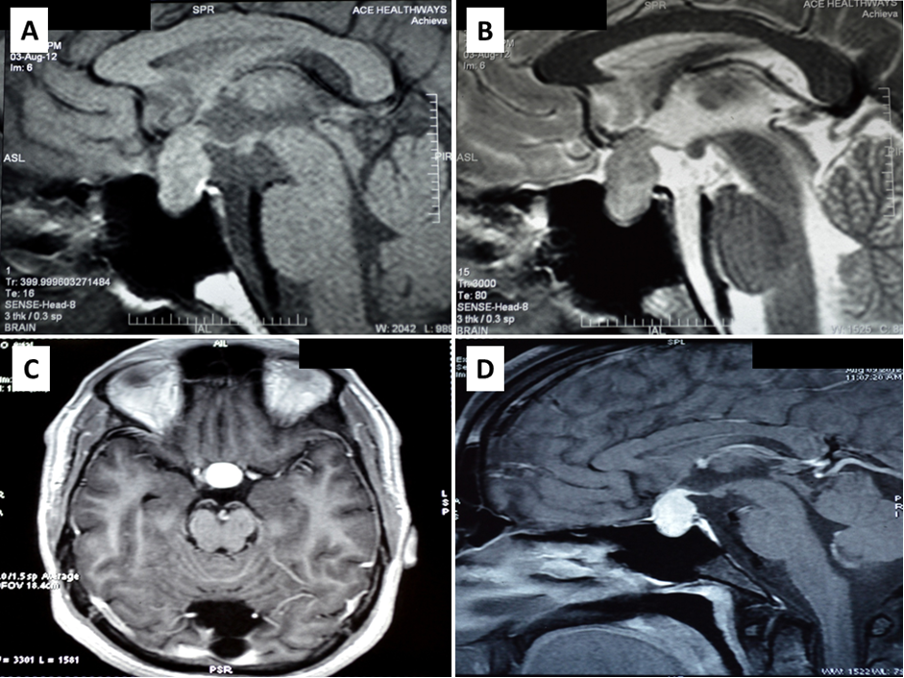
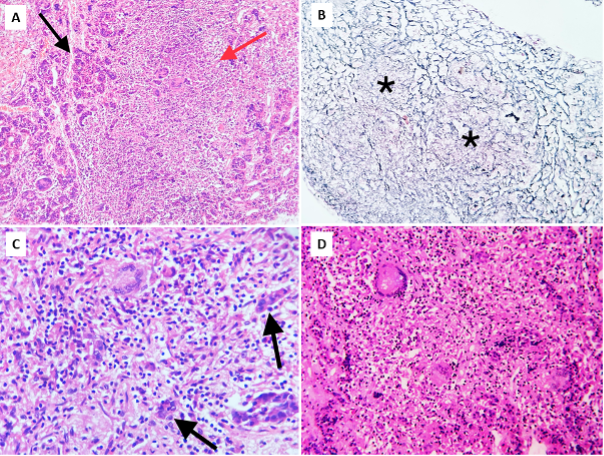
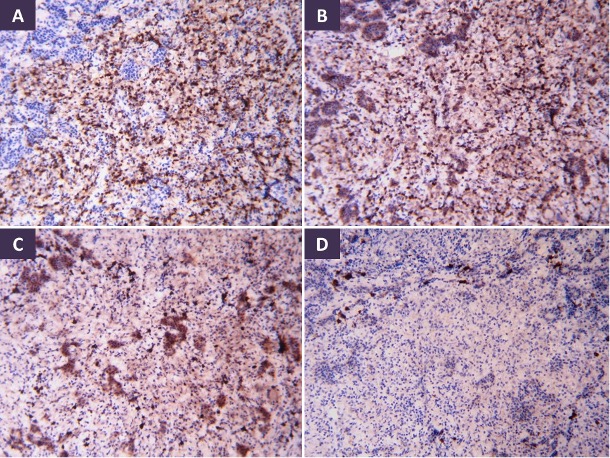
Fungal pituitary infections usually present with symptoms of headache, visual disturbance, and ophthalmoplegia and are often misdiagnosed as tumors (14). Identification of a mass in the sellar region in an immunocompromised state should raise suspicion of fungal etiology. T1-weighted magnetic resonance imaging (MRI) of fungal abscess of pituitary shows nonspecific isointensity or hypointensity (4). Pituitary abscess of any etiology including fungal may demonstrate peripheral rim enhancement and calcifications on T2-weighted images. Low signals due to iron deposition are however indicative of fungal involvement (19). Involvement of the adjacent sinuses is another pointer for fungal disease (15,16). It is difficult to distinguish fungal pituitary infections from intrasellar bacterial infections and tumors, and the diagnosis is often confirmed during surgery or autopsy. Histopathological examination can reveal hyphae and fungal spores. Silver impregnation stains such as Grocott or Gomori methenamine silver, fungal culture, or fungal polymerase chain reaction (PCR) can confirm the diagnosis (4). Serum 1,3-β-D-glucan is positive in a broad range of invasive fungal infections, including candida (19). Serum galactomannan is however, a specific marker for invasive aspergillosis (20).
TREATMENT
Treatment includes antifungal therapy and drainage of the abscess by transsphenoidal endoscopic approach (14). Craniotomy is discouraged due to fear of intracranial dissemination. Deficiency of pituitary hormones may necessitate replacement (9). Voriconazole is the preferred therapeutic agent for aspergillus infection. Other medical options are liposomal amphotericin B, posaconazole, isavuconazole, and echinocandins (21). The recommended dose of voriconazole for central nervous system (CNS) aspergillosis is intravenous loading with 6 mg/kg every 12 hour for two doses followed by 4 mg /kg every 12 hour. The oral loading dose is 400 mg every 12 hour for two doses, followed by 200 mg twice daily (22). Oral treatment may be required for months. The exact duration of therapy is not established and depends on the clinical parameters. Antifungal therapy for other varieties of fungus should be administered as per standard practice. Mortality rates are high in disseminated disease with vascular invasion, immunosuppressed state, and in cases of a delayed diagnosis (14).
Thyroid Disorders
ETIOLOGY
Infections of the thyroid are rare as its rich blood supply, iodine content, and capsule are protective against microbial invasion (23). Fungi form a small subset among the microbial pathogens infecting the thyroid. A. fumigatus is the predominant fungi in general, whereas P. jirovecii is the most common cause of fungal thyroiditis in patients with AIDS (24,25). Table 4 enumerates the fungal infections reported to infect the thyroid. These infections are primarily seen in immunocompromised patients and usually is a part of disseminated infection. Both hematogenous and lymphatic spread can occur. Direct invasion of the thyroid by fungal infection is also reported. Mycotoxin secreted by the fungus may affect thyroid function, however the evidence in humans is not definitive (26).
|
Table 4. Predisposing Conditions Where Fungus Affects the Thyroid Gland
|
|
Type of fungus
|
Predisposing condition
|
|
Aspergillus
|
Organ transplant (27,28), AML (29), ALL (30), MDS (31), NHL (32), SLE (24,33), cryoglobulinemic vasculitis (34), AIDS, normal immune status with MNG (35)
|
|
Pneumocystis
|
AIDS (25), Thymic alymphoplasia (36)
|
|
Candida
|
ALL (37), AML (38)
|
|
Coccidiodes
|
SLE on corticosteroids (39), sarcoidosis on corticosteroids, PAN on corticosteroids (40)
|
|
Histoplasmosis
|
NHL (41)
|
AML – acute myeloid leukemia, ALL – acute lymphoblastic leukemia, MDS – myelodysplastic syndrome, NHL- Non-Hodgkin’s Lymphoma, SLE- systemic lupus erythematosus, AIDS – acquired immunodeficiency syndrome, MNG – multinodular goiter, PAN – polyarteritis nodosa
CLINICAL FEATURES
Fungal infection of the thyroid usually occurs in presence of underlying critical illness. The symptoms of thyroid infection can get masked by the primary disease. Thyroid involvement can be often detected post-mortem in cases of disseminated fungal disease (42). Common clinical presentations include pain, swelling of the thyroid gland, and fever, often mimicking subacute thyroiditis. In severe cases, thyroid enlargement may cause dysphagia and respiratory distress due to esophageal and tracheal obstruction, respectively (25,42,43). Fungal thyroiditis typically follows the course of a brief phase of thyrotoxicosis followed by hypothyroidism. Recovery of thyroid function generally takes place in weeks to months. Sick euthyroid syndrome, which sometimes occurs in disseminated fungal infections, may confound thyroid function testing. The clinical presentation of different varieties of fungal infections is similar.
Aspergillus
A review of 28 cases of aspergillus thyroiditis by Tan et al. revealed that 12 (43%) patients had a primary thyroid infection. The rest had aspergillus infection elsewhere (usually lungs and airways). Fever, dyspnea, and neck swelling were the usual presentation. Dysphagia and airway obstruction resulted from mass effect and was fatal in two cases. The overall mortality rate was high (64%) (24).
Pneumocystis
Zavascki et al. described 15 cases of P. jirovecii thyroiditis. Most of the cases were reported in individuals with AIDS. It should be suspected if neck pain and swelling occur in presence of a CD4 count < 200/µL. Compressive symptoms such as odynophagia, dysphagia, dysarthria, and hoarseness have been reported. Extra-thyroid disease was present in 53% (8/15) of cases and documented usually on post-mortem studies. Most of the cases were euthyroid, three were hypothyroid, and one developed transient thyrotoxicosis (25).
Others
There are reports of infection of the thyroid with candida, histoplasma, coccidiodes, and, paracoccidiodes in immunocompromised hosts (37–41). The different varieties of fungal thyroiditis are clinically indistinguishable from each other.
DIAGNOSIS
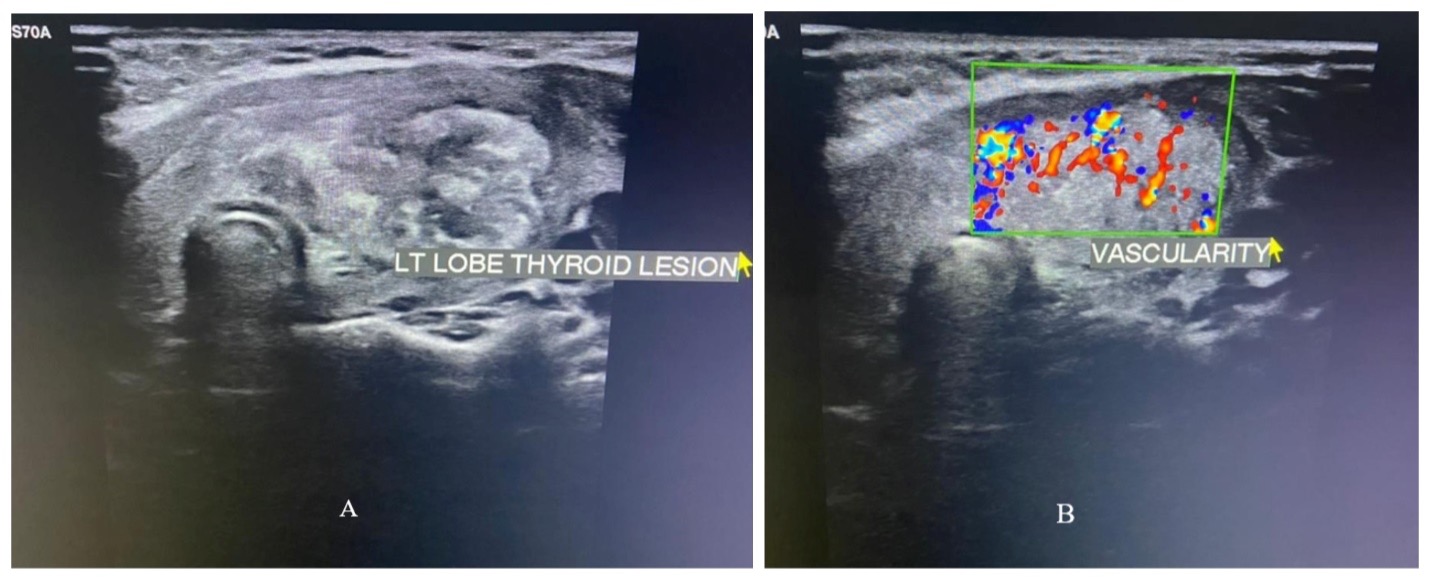
Thyroid infection should be suspected in immunocompromised hosts who present with swelling and pain in the region of the thyroid gland. The thyroid involvement not uncommonly remains asymptomatic and gets detected post-mortem (42). Imaging of the neck by ultrasonography can be useful to define the morphology of the lesion. Computed tomography of the chest additionally identifies fungal lesions in the lungs, the usual site of primary or secondary infection. Fungal staining and culture of the lesion obtained by fine needle aspiration (FNA) of the thyroid gland can confirm the diagnosis. Results of thyroid function testing can be normal or may reveal thyrotoxicosis or hypothyroidism.
TREATMENT
Antifungal therapy is the mainstay of treatment. Voriconazole is the first line agent for invasive aspergillus infection. Adding echinocandin (capsofungin or antidulafungin) along with voriconazole may provide marginally better outcomes in patients who are immunocompromised (44,45). Cotrimoxazole is the preferred therapy for pneumocystis infection. The choice of antifungal therapy depends on the type of fungus and the prevalent pattern of antifungal resistance. Surgical debridement may be required especially if there is a possibility of tracheal compression due to mass effect. Symptomatic treatment may be required in the thyrotoxic phase resulting from acute damage to the gland. The thyroid gland fails to recover in a minority of patients. They should be treated with thyroid hormone replacement. Outcome of fungal thyroiditis has improved over the last two decades with advances in antifungal therapy (43).
Fungal infections can alter calcium and vitamin D metabolism. The common metabolic bone disorders are described in the following section.
Etiology and Pathogenesis
Conversion to the active 1,25-dihydroxyvitamin D [1,25(OH)2D] from 25-hydroxyvitamin D [25(OH)D] occurs primarily in the kidney. The renal enzyme 25(OH)D-1α hydroxylase (CYP27B1) responsible for the conversion, is tightly regulated by parathyroid hormone (PTH), fibroblast growth factor 23 (FGF-23), and the serum 1,25(OH)2D concentration. The activated mononuclear cells and macrophages also exhibit 25(OH)D-1α-hydroxylase activity. The 1,25(OH)2D synthesized in these cells normally exert a paracrine effect on growth and differentiation of cells. In granulomatous disorders, such as sarcoidosis, tuberculosis, and fungal infections, the 1,25(OH)2D production in monocytes is dysregulated resulting in hypercalcemia. The monocyte 25(OH)D-1α-hydroxylase is resistant to the regulatory mechanisms and the lack of calcium-mediated negative feedback predisposes to hypercalcemia (46). PTH-independent hypercalcemia is described in chronic fungal infections, such as histoplasmosis, coccidioidomycosis, para-coccidioidomycosis, candidiasis, cryptococcosis, and pneumocystis.
Clinical Profile
The fungal infections associated with 1α-hydroxylase mediated hypercalcemia can occur in both immunocompromised and immunocompetent hosts. In a review summarizing 16 cases of histoplasmosis induced hypercalcemia, 68.7% (11/16) were immunosuppressed. The common presentations were with polyuria, constipation, altered sensorium, and renal insufficiency (47). Hypercalcemia is also reported in cryptococcus and pneumocystis infections in individuals with HIV/AIDS (48–50). Hypercalcemia can be an early marker of pneumocystis pneumonia in renal transplant recipients (51,52).
Laboratory Features
Patients present with elevated serum calcium and phosphate levels, suppressed PTH values, normal 25(OH)D, and increased 1,25(OH)2D concentrations. Serum angiotensin-converting enzyme (ACE) levels can be elevated (47).
Treatment
Hypercalcemia resolves with resolution of the infection after institution of successful antifungal therapy. Hydration, calcitonin, and bisphosphonates can be considered to lower calcium till the effect of antifungal medication occurs (47). Steroids can be used in resistant cases but should be initiated only under appropriate antifungal coverage. Fatalities have been reported when the cases have been misdiagnosed as sarcoidosis and steroids initiated without antifungal drugs (53,54). Some cases show transient worsening of hypercalcemia probably mediated by immune reconstitution inflammatory syndrome (55). Also, initiation of antiretroviral therapy in patients with HIV/AIDS infected with cryptococcus, might cause hypercalcemia. This may be due to restoration of granulomatous host response (56).
Coccidioidomycosis infection is associated with hypercalcemia. However, the mechanism of hypercalcemia in coccidioidomycosis is not related to autonomous 1,25(OH)2D production. It could be due to osseous coccidioidomycosis in some cases, but in the majority of cases it occurs without bony lesions. Serum PTH levels and 1,25(OH2)D levels were either suppressed or normal (57). Expression of PTHrP by the granulomatous tissue has been documented in coccidioidomycosis. The serum PTHrP levels are elevated in cases with hypercalcemia and presumed to be the possible mechanism. The PTHrP levels return to normal along with resolution of hypercalcemia after successful antifungal treatment (58).
Histoplasmosis-induced hypercalcemia has been postulated to result from excess expression and secretion of osteopontin by histiocytes in granulomas (59). Osteopontin can activate osteoclasts and subsequently lead to bone resorption (60). However, currently there is insufficient evidence to support this hypothesis.
Hypoparathyroidism has also been described in HIV/AIDS with pneumocystis infiltrating the parathyroid glands. It causes hypocalcemia and hyperphosphatemia (61).
Fungal Infection of the Adrenal Gland
The adrenal gland is the commonest endocrine organ to be affected by infections including mycosis. Adrenal fungal infection can be asymptomatic and get detected as an incidental finding during radiological imaging, or can manifest with symptoms of adrenal insufficiency (62,63).
ETIOLOGY AND PATHOGENESIS
Unlike the other endocrine organs, isolated adrenal involvement can be seen as a manifestation of endemic mycoses in immunocompetent hosts by histoplasmosis, paracoccidioidomycosis, blastomycosis, and other fungal organisms (64–66). The susceptibility to develop primary adrenal infection or disseminated fungal disease is however more often seen in the immunocompromised individuals with HIV/AIDS, or in those receiving immunosuppressive therapy such as solid organ transplant recipients (67). Predisposition of the adrenal glands to fungal infections is postulated to be due to suppression of cell-mediated local immunity caused by high local glucocorticoid levels (68). More often than isolated involvement, the adrenal gland is involved as a part of disseminated infection. Histoplasmosis and paracoccidioidomycosis are the commonest fungal infections reported to have adrenal disease at autopsy (67,69).
Affinity for different adrenal zones might vary for different fungal infections. Paracoccidioides species has affinity for zona reticularis as well as zona glomerulosa leading to decreased dehydroepiandrosterone sulfate and aldosterone levels, respectively (59,70,71). The large fungal cells cause embolic infection of the small vessels of the gland subsequently leading to endovasculitis, granuloma formation and caseous necrosis (67,72). In patients with histoplasmosis, zona fasciculata and reticularis are preferentially affected owing to the presence of high concentration of cortisol (73). Vasculitis of downstream medullary vessels starting from zona fasciculata induce glandular destruction and subsequent caseation necrosis (68,74).
CLINICAL FEATURES
The spectrum of manifestations of fungal adrenal involvement can vary from asymptomatic cases detected incidentally to frank adrenal crisis. Occasionally, adrenal involvement can get masked by the disseminated fungal disease or the underlying immunocompromised state (67). Many of the patients despite bilateral adrenal infection do not develop adrenal insufficiency, as destruction of more than 90% of adrenal cortex is required for the disease to manifest (59). Some studies have observed lower prevalence of adrenal involvement in immunocompromised hosts, presumably due to the inability to launch a granulomatous response in the gland (75,76).
Addison’s disease is most frequently reported with histoplasmosis and paracoccidioidomycosis, given their high affinity for adrenal glands. In a review of 252 cases of adrenal histoplasmosis, adrenal hypofunction was confirmed in 41.3%. Almost all the cases were secondary to chronic disseminated pulmonary histoplasmosis although isolated adrenal involvement has also been reported (77). A study of 546 cases of paracoccidioidomycosis from Brazil documented adrenal involvement in only 5% (n = 27) (78). Another review revealed partial adrenal insufficiency in 33–40% of cases, and frank symptoms in 3–10% cases (79). Patients with diminished adrenal reserve often require glucocorticoid supplementation during periods of stress or after initiating antifungal agents known to affect steroidogenesis. There are reports of blastomycosis, pneumocystis, and cryptococcus causing adrenal insufficiency as well (80–82). The clinical features of primary adrenal insufficiency include fatigue, loss of appetite, weight loss, orthostatic hypotension, and hyperpigmentation (66,83).
DIAGNOSIS
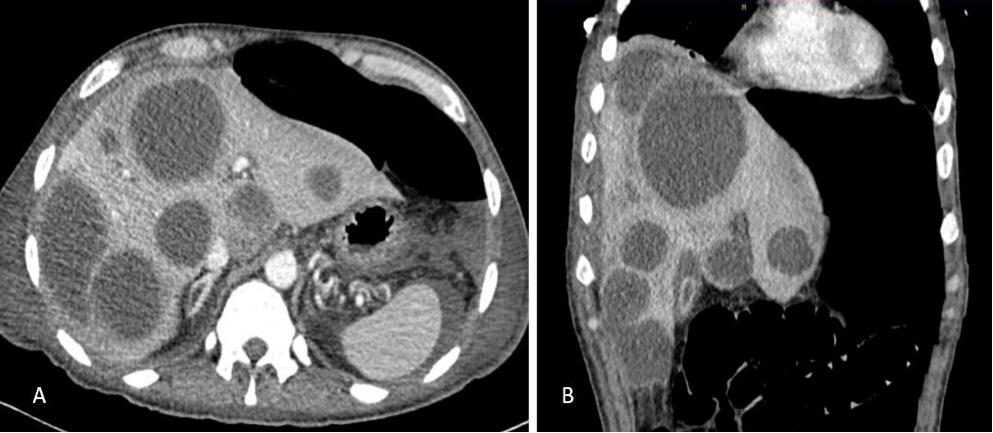
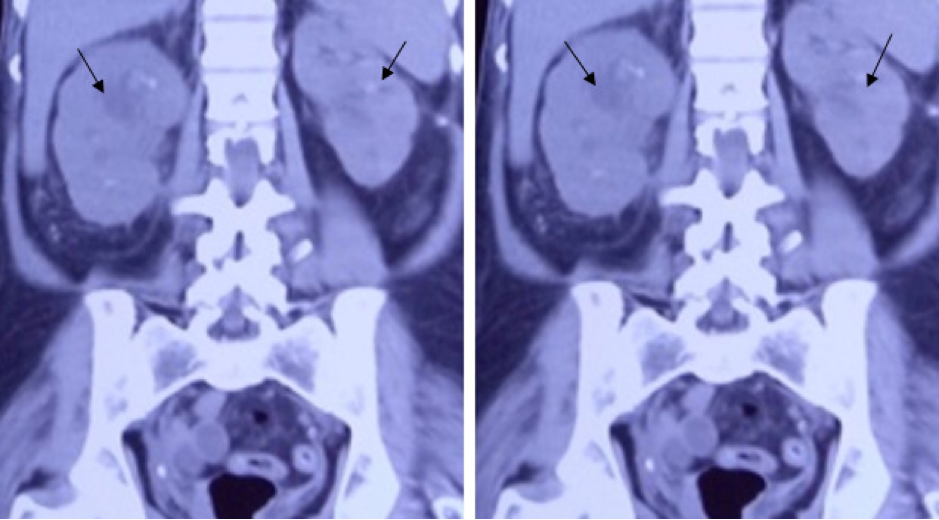
Fungal infection of the adrenal glands can be asymptomatic and detected incidentally on abdominal imaging. Radiographically bilateral symmetric adrenal enlargement is seen with histoplasmosis whereas paracoccidioidomycosis and blastomycosis cause asymmetric and occasionally unilateral involvement (81,84–86). Other radiographical features include peripheral enhancement, central hypoattenuation, preserved contour, and calcifications (66,67). These features help to differentiate from other disorders such as metastatic disease where the adrenal contour is distorted and autoimmune adrenalitis, where the glands are atrophic (66,67,87,88).
The laboratory findings such as hyponatremia and hyperkalemia are often seen but the diagnosis of adrenal insufficiency is confirmed with the short Synacthen test (SST) or cosyntropin test (250 ug of Synacthen, im or iv) in chronic and stable cases. In a patient with suspected Addisonian crisis, a blood sample collected for estimation of serum cortisol and adrenocorticotrophic hormone (ACTH) before initiating glucocorticoid replacement can be helpful. A formal evaluation by SST can be performed later. Simultaneous estimation of plasma renin and aldosterone to determine mineralocorticoid reserve can be considered. (66).
The confirmation of fungal etiology might necessitate fungal staining or culture of the biopsied material. In disseminated disease, a more accessible site like skin lesion or affected lymph node can be biopsied instead of the adrenal gland.
MANGEMENT AND PROGNOSIS
Initiation of antifungal therapy at the earliest is essential to salvage adrenal function. Recovery has been reported in a few cases with histoplasmosis and paracoccidioidomycosis (59). However, frequently adrenal insufficiency is irreversible and lifelong glucocorticoid replacement is required. Mineralocorticoid replacement with fludrocortisone may additionally be necessary (83). Onset of adrenal insufficiency in paracoccidioidomycosis can occur after initiation of antifungal therapy from the fibrosis that occurs during recovery (79,89).
Fungal Infection of the Pancreas
The pancreas is normally resistant to fungal infection. Fungal affection of the pancreas usually occurs in an inflamed gland in the presence of underlying necrosis. Although rare, the prevalence of fungal pancreatitis is on the rise.
ETIOLOGY AND PATHOGENESIS
Candida (C. albicans and C. glabrata) is the most common etiology responsible for fungal pancreatic infections (90). Pneumocystis, aspergillosis, and cryptococcosis have also been reported to affect the pancreas (91–93). The risk factors for fungal infection are necrotizing pancreatitis, use of broad-spectrum antibiotics, abdominal surgery, prolonged total parenteral nutrition, indwelling catheters, and an immunosuppressed state. The mode of spread could be translocation from the gut, hematogenous spread, or external seeding (90).
CLINICAL COURSE AND MANAGEMENT
The clinical features of fungal infection of the pancreas are non-specific. Abdominal pain, fever, and a palpable abdominal mass can occur (94). Most cases of fungal pancreatitis occur on the backdrop of recent necrotizing pancreatitis (90,94). In a study of 92 patients with necrotizing pancreatitis, 22 (24%) had evidence of candida infection in the surgical necrosectomy material (95). Candida was demonstrated in 27% of aspirates from walled-off necrosis occurring after acute pancreatitis (96). Rare cases of recurrent pancreatitis from candida have also been described (97,98).
Fungal culture and staining of percutaneous aspirates, or necrosed tissue obtained during surgery, are necessary to establish the diagnosis. Antifungal therapy and surgical drainage and debridement are the mainstay of therapy. Mortality rates are higher if candida infection is present (95).
Fungal Infection of the Testis
ETIOLOGY AND PATHOGENESIS
Fungal epididymo-orchitis can occur in isolation or as a part of disseminated infection. The fungi reported to infect testis and epididymis include candida, blastomycosis, histoplasma, aspergillus, and cryptococcus (99–103). Both C. albicans and C. glabatra can cause epididymo-orchitis by retrograde transport from infection in the urinary tract. Risk factors comprise diabetes mellitus, instrumentation of the urinary tract, urinary obstruction, or recent antibiotic usage (104). The majority of blastomycosis infections were associated with systemic diseases (105). Granulomatous epididymo-orchitis can also occur as a part of disseminated histoplasmosis in immunocompromised state (106).
CLINICAL COURSE AND MANAGEMENT
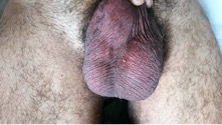
Most patients present with unilateral or bilateral pain and swelling of the scrotum. Onset can be acute or insidious with duration of symptoms lasting for days to months (104). In contrast, bacterial infection is almost always unilateral with an acute onset of scrotal swelling, redness, and pain. Some fungal infections may remain asymptomatic and get detected on autopsy (102). Fungal epididymo-orchitis is also recognized as a cause of azoospermia and infertility (107). This is mainly due to direct gonadal invasion but can also be due to anti-sperm effects induced by fungi and by secreted mycotoxins (59). C. guilliermondii and C. albicans can affect sperm viability and motility (108). Antifungal agents are the mainstay of treatment. Surgery may be required in some cases.
Fungal Infection of the Ovary
ETIOLOGY AND PATHOGENESIS
Pelvic inflammatory disease (PID) refers to infection of the upper genital tract usually occurring in reproductive age females. A tubo-ovarian abscess (TOA) is a sequela of PID. It is a complex adnexal mass resulting from ascent of the infection through the fallopian tube (109). Though the common causative organisms are bacteria such as Chlamydia trachomatis and Neisseria gonorrhoeae, fungal infections are also recognized as an important etiological agent (110). It can also be a part of disseminated infection (111–113). C. albicans as well as other candida species such as C. glabrata and C. keyfr have been described to cause TOA (114–116). Intrauterine devices, diabetes, and morbid obesity are the typical risk factors (114,117). There are rare reports of female genital coccidioidomycosis (112,113,118).
CLINICAL COURSE AND MANAGEMENT
The usual presentation is that of a pelvic infection not responding to conventional antibiotics (117). Presenting symptoms can be dysmenorrhea, menstrual irregularities, menorrhagia, anovulation, and infertility. Occasional patients present with severe lower abdominal pain, fever and vomiting (116).
Fusarium toxin zearalenone and its metabolite zearalenol can be present as a contaminant in cereals and usually enter the food chain as pesticide. It is a non-steroidal estrogen mycotoxin with strong affinity for estrogen receptors (119). The resulting hyperestrogenism has the potential to cause infertility by suppressing luteinizing hormone (LH) and progesterone secretion and also can have a carcinogenic effect on the breast (120).
FUNGAL INFECTIONS OCCURING IN ENDOCRINE DISORDERS
Individuals with certain endocrine disorders such as diabetes mellitus and Cushing’s syndrome are predisposed to fungal infections as a result of the associated immune dysfunction. Both pathogenic and opportunistic fungi can cause infection in these conditions. APS1 is an endocrine syndrome characterized by CMC (121). The common fungal infections occurring in individuals with endocrine dysfunction are discussed below. Other fungal infections like coccidioidomycosis and aspergillosis are also known to occur at a higher frequency in individuals with diabetes.
Fungal Infections in Patients with Diabetes
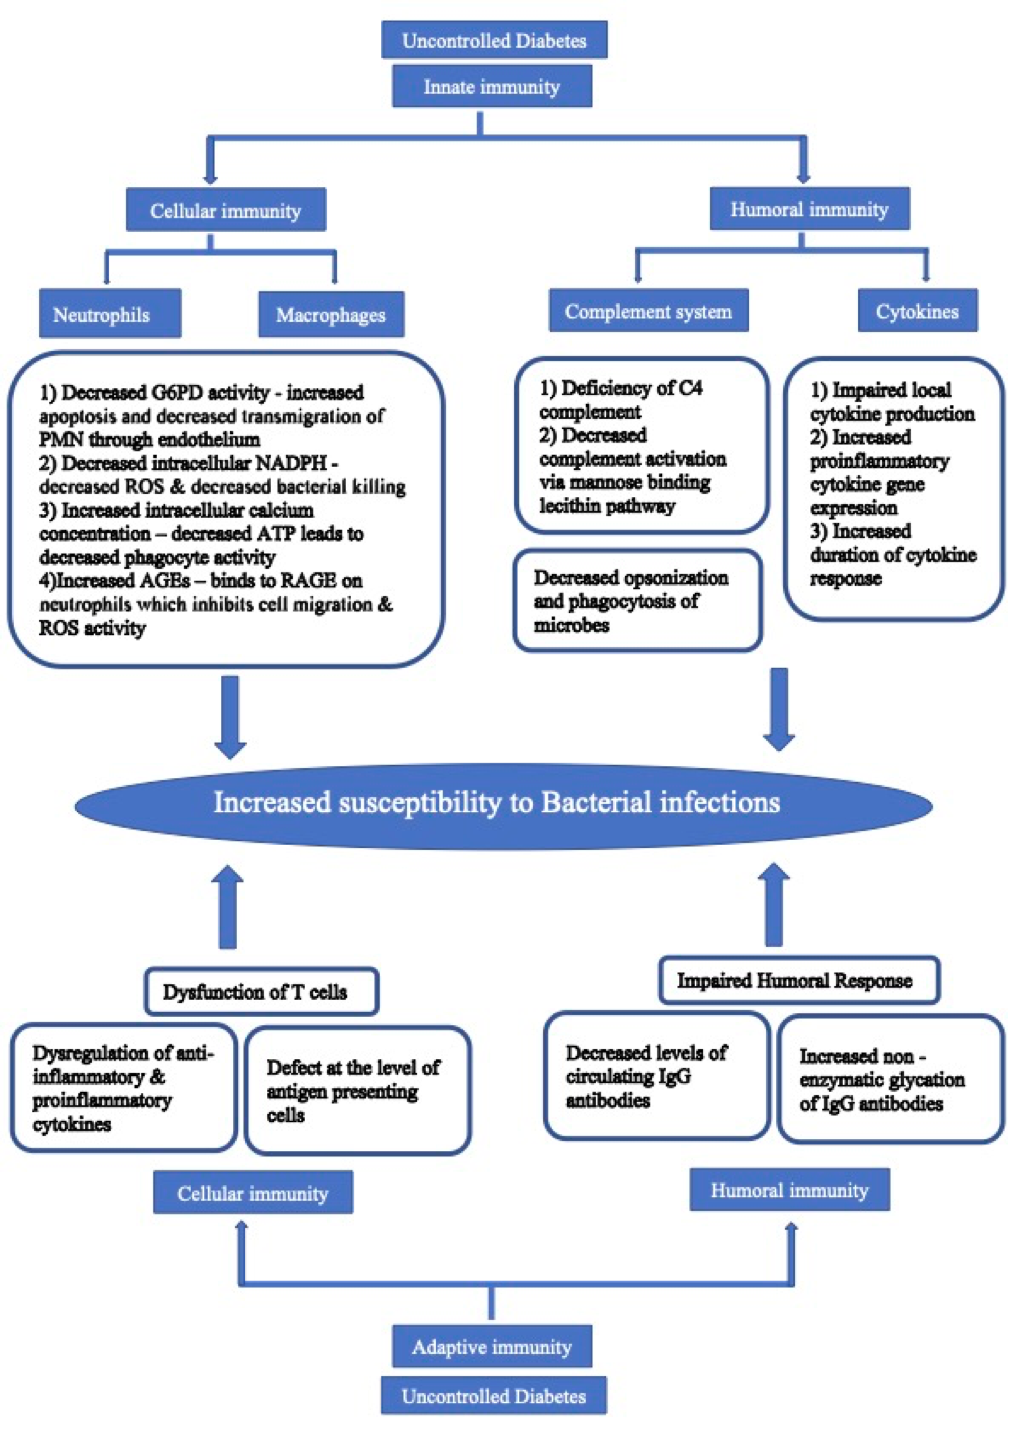
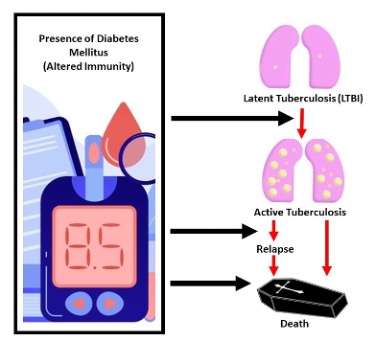
Diabetes is known to affect both innate and adaptive immunity. Hyperglycemia also induces critical alterations in cytokine signaling (122). Fungal infections in general occur at a slightly increased frequency in diabetes, especially if glycemic control is poor. However, certain fungal infections like mucocutaneous candidiasis and invasive mucormycosis have a strong association with diabetes (123).
CANDIDIASIS
Infection with candida is common in individuals with diabetes (124) . Genital candidiasis is often an indicator for undetected or poorly controlled diabetes. Increased hydrolytic enzyme activity and hydrophobicity along with altered biofilm formation have been proposed as possible mechanisms that favor candida infection in diabetes (125,126). The common sites and clinical characteristics of candida infection in diabetes are summarized in table 5.
|
Table 5. Candida Infections in Diabetes
|
|
Site
|
Usual species
|
Predisposing factors
|
Clinical features
|
Diagnosis
|
Treatment
|
|
Oral candidiasis
|
C. albicans
C. glabrata
C. tropicalis
C. krusei
C. dubliniensis C. parapsilosis
(124)
|
Uncontrolled hyperglycemia, dentures, xerostomia, inhaled corticosteroids (127)
|
Types of lesions: Pseudo-membranous
Hyperplastic
Erythematous
Atrophic (denture stomatitis)
Angular cheilitis
Median rhomboid glossitis (128)
|
Compatible clinical findings; Confirmation by Gram stain or KOH preparation or fungal culture of the scrapings (129)
|
Oral hygiene
Topical: Clotrimazole, miconazole, nystatin, amphotericin B suspension
Oral: Fluconazole, itraconazole
(129)
|
|
Vulvo-vaginal candidiasis
|
C. albicans
C. glabrata (124)
|
Uncontrolled hyperglycemia, pregnancy and hyper-estrogenemic state, SGLT2 inhibitor therapy, immunosuppression (130)
|
Thick white cottage cheese-like discharge, itching, pain, redness, burning, edema and dyspareunia
|
Clinical findings, Vaginal swab – acidic pH, KOH or fungal staining, fungal culture in selected cases
|
Glycemic control
Vaginal: Clotrimazole, miconazole, tioconazole, terconazole, butoconazole
Oral: Fluconazole (150 mg single dose ) (131)
|
|
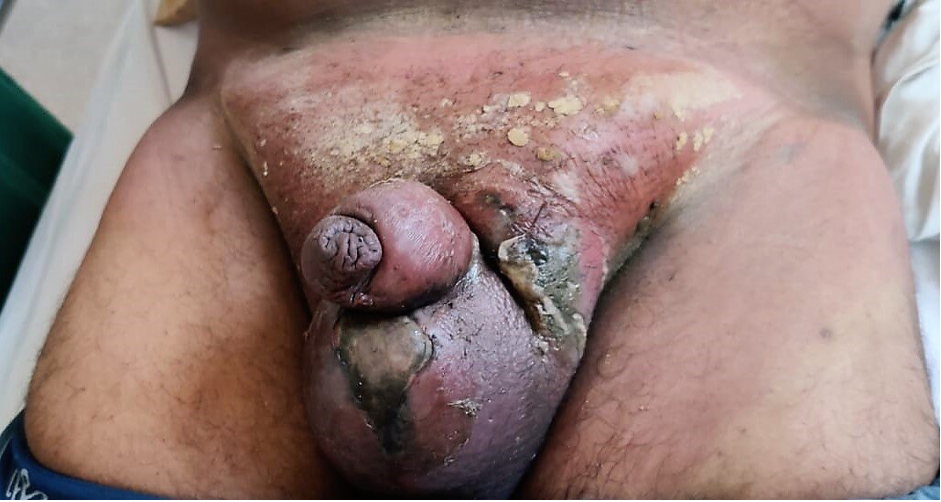
Balanoposthitis
|
C. albicans
C. glabrata
|
Uncontrolled hyperglycemia, SGLT2 inhibitor therapy, uncircumcised men, immunosuppression (132,133)
|
Sore, pruritic erythematous rash with small papules, erosions or dry dull areas with glazed appearance (134)
|
Clinical findings, KOH or fungal stain of scrapings in rare cases
|
Glycemic control
Topical: Clotrimazole, miconazole
Oral: Fluconazole (150 mg single dose), Itraconazole
|
|
Esophageal candidiasis
|
C. albicans, C. dubliniensis (124)
|
Old age, HIV/AIDS, corticosteroid use, COPD, PPI use, esophageal dysmotility (135)
|
Odynophagia, dysphagia, retrosternal pain, usually associated with oral thrush (136)
|
Endoscopy - white mucosal plaque-like lesions. Biopsy – confirmatory. Culture rarely required (136)
|
Initial therapy: Oral fluconazole
Second-line therapy: Itraconazole,
voriconazole
isavuconazole,
echinocandin,
liposomal amphotericin B
|
|
Urinary tract candidiasis
|
C. albicans,
C. glabrata,
C. tropicalis (137)
|
Hyperglycemia, urinary retention and stasis, renal transplantation, long-term urinary catheterization, hospitalization (138)
|
Asymptomatic, symptoms of lower and upper urinary tract involvement mimic bacterial infection (139)
|
Urinalysis and culture of urine, Imaging when indicated (139)
|
Asymptomatic candiduria needs treatment in neutropenic patients, before urological procedures.
First line: Fluconazole
Second line: Flucytosine, amphotericin B (138)
|
|
Onychomycosis
|
C. albicans,
C. parapsilosis
C. tropicalis (124)
|
Age, nail disorders, frequent exposure to moisture (124)
|
Nail discoloration, subungual hyperkeratosis, onycholysis, splitting, and nail plate destruction
|
Clinical findings, KOH preparations, fungal cultures, histopathologic examination with a PAS stain and PCR testing (140)
|
Oral itraconazole treatment of choice.
Terbinafine might also be efficacious (141)
|
|
Systemic candidiasis
|
C. albicans,
C. parapsilosis, C. krusei,
C. tropicalis,
C. glabrata (142)
|
New onset hemodialysis, use of TPN, or receipt of broad-spectrum antibiotic (143)
|
Can vary from minimal fever to a full-blown sepsis
|
Blood culture. 1,3-β-d-glucan assay may assist in the diagnosis
|
Preferred therapy Echinocandin: anidulafungin, capsofungin, micofungin
Alternative: Amphotericin B
Step down therapy: Fluconazole if susceptibility results support (144)
|
KOH - potassium hydroxide, SGLT2 - Sodium-glucose cotransporter-2, COPD – chronic obstructive pulmonary disease, PPI – proton-pump inhibitor, PAS – Periodic Acid Schiff, PCR – polymerase chain reaction, TPN – total parenteral nutrition.
MUCORMYCOSIS
Mucormycosis refers to a group of infections caused by fungi of the order Mucorales present ubiquitously in the environment. Individuals with uncontrolled diabetes or those who are immunosuppressed are characteristically affected. The most common presentation is rhino-orbital-cerebral mucormycosis, though pulmonary, gastrointestinal, cutaneous, and renal infection can also occur (145). Several cases of mucormycosis have been reported recently following SARS COV-2 disease (146). Around 40% of the patients had received corticosteroids within the month before the diagnosis of mucormycosis. Diabetes with ketoacidosis (DKA) is 50% more likely to develop mucormycosis than without DKA. The prognosis is poor and mortality rates remain high. The rhino-orbital-cerebral form is characteristically associated with diabetes and detailed below.
Pathogenic Organisms
The pathogenic fungi belonging to order Mucorale customarily associated with human infections are Rhizopus, Mucor,and Lichtheimia (formerly Absidia and Mycocladus). The rarer pathogens include Rhizomucor, Cunninghamella, Apophysomyces, and Saksenaea (147). Infection occurs presumably from inhalation of spores.
Pathogenesis
Patients with diabetes, defects in phagocytic function (such as neutropenia or glucocorticoid treatment), and/or elevated levels of free iron which supports fungal growth in serum and tissues are prone to mucormycosis. DKA is a risk factor for developing rhino-orbital-cerebral mucormycosis, as acidosis leads to dissociation of iron from sequestering proteins, which aids increased fungal survival and virulence (148). Moreover, the ketoacid -hydroxybutyrate facilitates fungal adherence and penetration into tissues, by increased expression of fungal receptors (149). Apart from ketoacidosis, hyperglycemia itself may contribute to the risk of mucormycosis by four possible mechanisms: (i) disruption of normal iron sequestration due to hyper-glycation of iron-sequestering proteins; (ii) phagocytic dysfunction; (iii) enhanced expression of a mammalian cell receptor (GRP78) that binds to Mucorales, enabling tissue penetration; (iv) enhanced expression of CotH, a Mucorales-specific protein that binds to GRP78 and mediates host cell invasion (150). The risk factors for mucormycosis are summarized in table 6.
|
Table 6. Risk Factors for Mucormycosis
|
|
Uncontrolled diabetes mellitus especially if associated with ketoacidosis
|
|
Underlying malignancy receiving chemotherapy or immunotherapy
|
|
Solid organ transplant
|
|
Hematopoietic stem cell transplant
|
|
Treatment with deferoxamine
|
|
Iron overload
|
|
Corticosteroid therapy
|
|
Trauma or burns
|
|
Malnutrition
|
|
Coronavirus disease 2019
|
Clinical Features
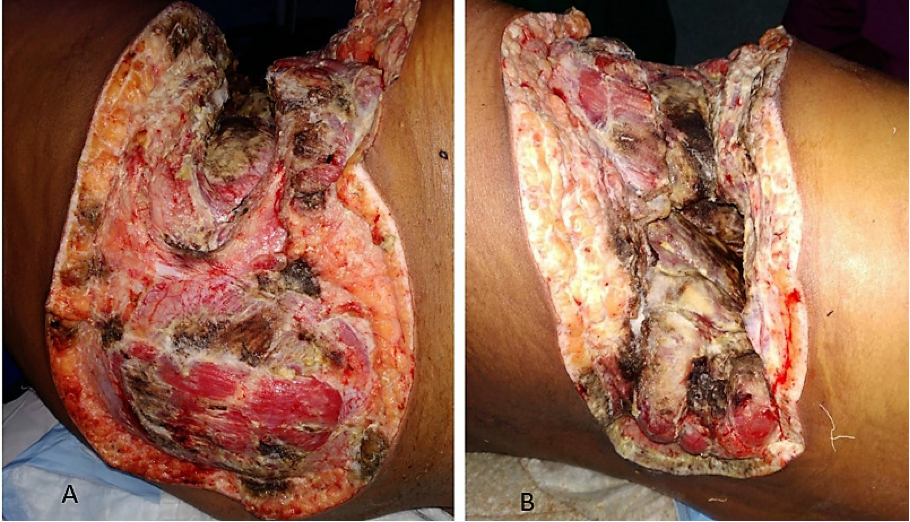
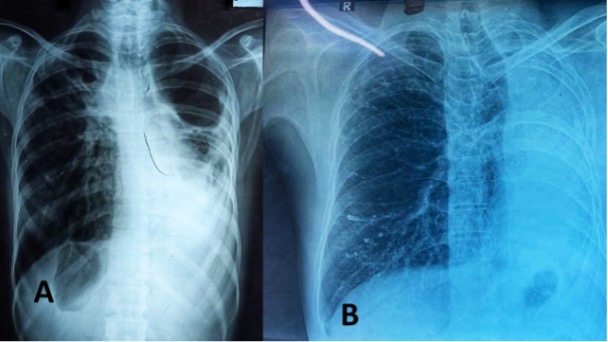
Rhino-orbital-cerebral mucormycosis is the most common form of the disease whereas lung, gastrointestinal, renal, and cutaneous involvement are less frequent (145). Initial symptoms of rhino-orbital-cerebral mucormycosis include eye or facial pain and facial numbness followed by conjunctival suffusion and blurring of vision. Facial erythema with or without edema may be present. Fever occurs in only half of the cases (151). Black, necrotic eschar develops over the palate or in the nasal mucosa. In untreated cases, infection spreads from the ethmoid sinus to the orbit which involvement of extra-ocular muscles. It results in proptosis, typically with chemosis. Infection might further extend from the orbit to the frontal lobe of the brain via hematogenous route or contiguous dissemination. It may extend to cavernous sinus as well via venous drainage (147). The clinical features are summarized in table 7.
|
Table 7. Clinical Features of Rhino-Orbital-Cerebral Mucormycosis
|
|
Site
|
Symptoms
|
Signs
|
|
Paranasal sinuses
|
Nasal congestion, purulent nasal discharge or post-nasal drip, loss of smell, headache, pain over the sinuses
|
Swelling, redness, ulceration and blackening of overlying skin and nasal mucosa
|
|
Systemic features
|
Fever
|
Fever
|
|
Orbit
|
Red eyes, pain, visual blurring, loss of vision, bulging of eyes
|
Periorbital swelling, chemosis, proptosis, loss of visual acuity
|
|
Cavernous sinus
|
Headache, periorbital swelling and pain, diplopia, and visual loss
|
Periorbital swelling, chemosis, ptosis, proptosis, restricted or painful eye movement, diminished facial sensation
|
|
Palate
|
Ulceration, pain, swelling
|
Ulceration, eschar formation
|
|
Central nervous system
|
Headache, drowsiness, seizures, hemiparesis, obtundation, coma
|
Focal seizures, hemiparesis, altered sensorium
|
|
Vascular invasion
|
Black eschars over skin, nasal mucosa, palate and involved areas, symptoms related to stroke
|
Black eschars (from cutaneous necrosis), focal neurological deficit (also from mycotic aneurysm)
|
Diagnosis
Clinical features, mycological, and histological investigations and imaging with CT or MRI are necessary for establishing the diagnosis and assessing the extent of spread. If sinusitis is suspected, endoscopy should be performed. Histopathological examination of infected tissue demonstrates characteristic wide, thick walled, ribbon like, aseptate hyphal elements that branch at right angles. Fungal culture of specimens is strongly recommended for genus and species identification, and for antifungal susceptibility testing (145). PCR-based technique and matrix-assisted laser desorption ionization-time of flight (MALDI-TOF) can assist to confirm fungal etiology if cultures are negative (145,152). MRI of the cranium including the sinuses and orbit should be done to delineate the extent of involvement (145). CT scan can help to assess the extent of bony erosion and can be considered if MRI is not readily available.
Treatment and Prognosis
Surgical debridement of the necrotic tissue in combination with intravenous lipid preparations of amphotericin B are the mainstay of therapy. It is also important to restore euglycemia and correct acidosis as soon as possible. The recommended dose of lipid formulation amphotericin B is 5mg/kg/day. There is evidence to support a higher dose of 10 mg/kg/day in cases of CNS involvement. There is no consensus on total duration of therapy but it usually takes weeks to months for completely cure these infections. It is critically important to monitor for adverse effects of amphotericin B especially nephrotoxicity and electrolyte imbalance. Posaconazole or isavuconazole can be considered as oral step down therapy, as salvage therapy, or if amphotericin B related adverse effects precludes its further use (145). Repeat surgery may be necessary if the infection progresses. Prognosis is poor especially if there is associated CNS involvement.
DERMATOPHYTES
Dermatophytosis are caused by filamentous fungi belonging to the genera Microsporum, Epidermophyton, and Trichophyton. Dermatophytes cause infection of skin, hairs, and nails and derive nutrition from keratin present in these tissues. Dermatophytosis is known to occur commonly in individuals with diabetes. Infection of the hair is referred to as tinea capitis (scalp) and tinea barbae (beard). Infection of the body surface in general is called tinea corporis while that of groin is known as tinea cruris.
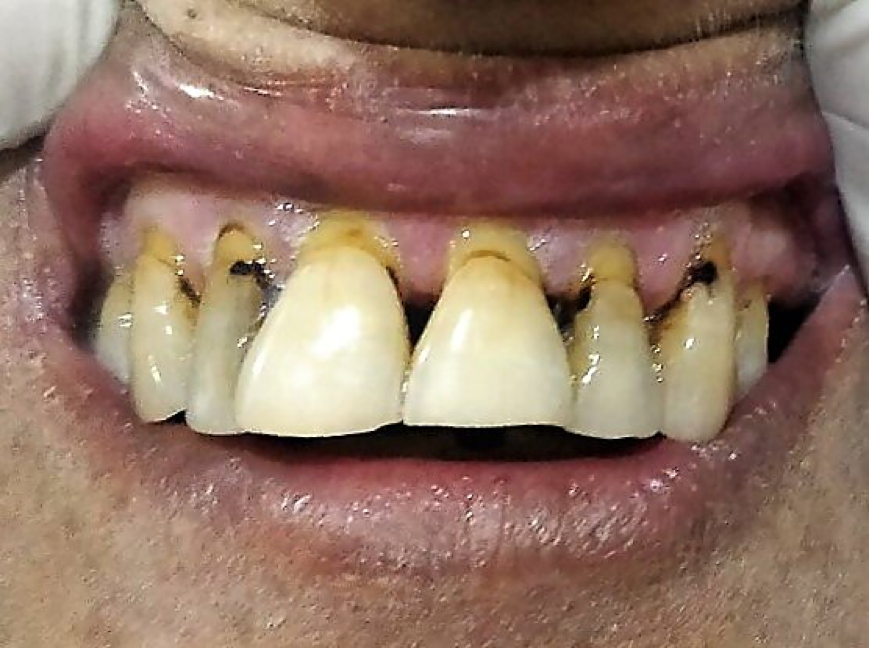
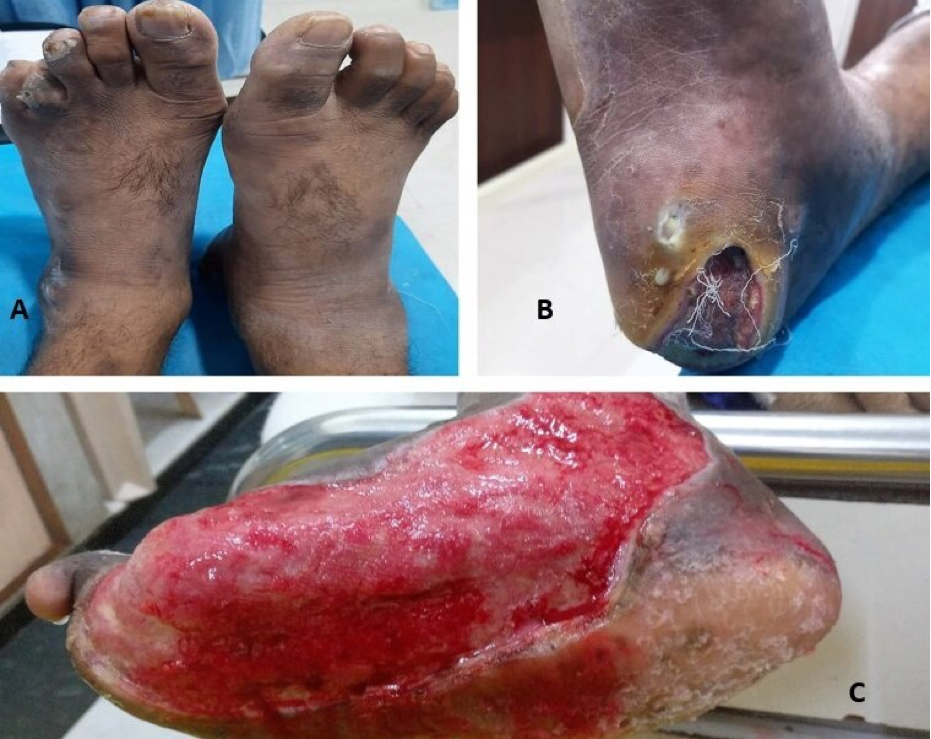
Skin infection with dermatophytes occurring over the feet is called tinea pedis. It can cause micro-fissuring that may predispose to secondary bacterial infection and subsequently to diabetic foot. The other form of dermatophyte infection affecting feet is onychomycosis or tinea unguium (153). Tinea pedis and onychomycosis are commonly causes by the anthropophilic dermatophytes T. rubrum, T. interdigitale and E. floccosum (154). Uremic patients on hemodialysis more often have dystrophic nail changes and are at increased risk of developing onychomycosis (155). Dystrophic nails in onychomycosis look thick, brittle and discolored, often with a yellow shade. It may also lead to separation of the nail plate from the nail bed (onycholysis). Paronychial inflammation of the nail edge surrounding skin is a characteristic feature (156). Early recognition and treatment of tinea pedis and onychomycosis can prevent ominous complications like diabetic foot.
Clinical features along with KOH preparation of scrapings from affected area are usually adequate to establish the diagnosis. Treatment mainly includes topical and oral agents with activity against dermatophytes. The commonly applied topical agents includes azoles, allylamines, butenafine, ciclopirox, and tolnaftate. Oral therapy usually involves use of terbinafine, itraconazole or fluconazole (157).
Fungal Infections in Cushing’s Syndrome
The susceptibility of individuals with Cushing’s syndrome to fungal infection is well recognized. Both endogenous and exogenous hypercortisolism are associated with opportunistic fungal diseases. Hypercortisolism induces immune dysfunction by multiple mechanisms (158). The major defects induced by excess cortisol are depicted in table 8. Among the subtypes of endogenous Cushing’s syndrome, fungal infections are more commonly seen in the syndrome of ectopic ACTH secretion. Propensity for fungal infections in exogenous Cushing’s syndrome depends on both, the intensity of glucocorticoid therapy and relative virulence of the offending fungus. With respect to glucocorticoids, it depends on administration route, dose, potency, and duration of treatment (159). The commonly reported fungal infections in Cushing’s syndrome are discussed below.
|
Table 8. Hypercortisolemia-Induced Immune Dysfunctions Increasing Susceptibility to Fungal Infections
|
|
Cell/Mediator
|
Dysfunction
|
|
Innate immunity
|
|
Neutrophils
|
Impaired neutrophil adherence to endothelium
|
|
Monocytes and macrophages
|
Decreased circulating monocytes
Decreased degranulation capacity
Decreased phagocyte function
|
|
Natural Killer cells
|
Suppressed cytotoxic activity
|
|
Adaptive immunity
|
|
T Cells
|
Lymphopenia due to a reduction in CD4+ subset
|
|
|
Influences the Th1/Th2 balance
|
|
|
Induces apoptosis in mature T lymphocytes
|
|
Cytokines
|
|
Cytokines
|
Down-regulates multiple cytokines by inactivating key proinflammatory transcription factors (e.g., NF kappa B)
|
CD - cluster of differentiation, Th – T helper cells, NF – nuclear factor
CANDIDIASIS
In immunocompromised states such as Cushing’s syndrome, candida species may cause superficial infections like cutaneous candidiasis, oropharyngeal candidiasis, esophagitis, or vulvovaginitis. Cases of candida endophthalmitis have also been described (160). It may also disseminate in the bloodstream to cause candidemia. Glucocorticoid may augment biological fitness of candida species, by enhancing its adhesion to epithelial cells. C. albicans is the most common species reported though infection with C. glabrata, C. parapsilosis and C. tropicalis can also occur (159).
ASPERGILLUS
Aspergillus is associated with invasive fungal infection in endogenous Cushing’s syndrome as well as in those receiving exogenous glucocorticoids (161) . Most common species to cause invasive infection are A. fumigatus, followed by A. flavus, A. terreus, and A. niger. The usual portal of entry for aspergillus is typically the pulmonary tract. However, later it might get disseminated systemically and severe cases requiring emergency bilateral adrenalectomy for control of hypercortisolism has been reported (162). Apart from immune dysfunction, glucocorticoids can induce alterations in the biology of aspergillus species to increase its invasiveness. For example A. fumigatus and A. flavusshowed increased growth on in-vitro exposure to pharmacological doses of hydrocortisone (163).
PNEUMOCYSTIS
P. jirovecii is usually seen in immunocompromised patients. Severe P. jirovecii pneumonia even leading to fatal outcome are described in cases of endogenous Cushing’s syndrome (164). The infection is often unmasked once treatment for hypercortisolism is commenced. The restoration of immune response with lowering of cortisol levels presumably induce the inflammatory changes and result in manifest disease (165,166). A review of 15 cases of P. jirovecii pneumonia, reiterated the same observation of immune reconstitution related worsening of symptoms after treatment initiation. In 13 of these cases symptoms were triggered after cortisol-lowering therapy was started. Interestingly, all but one if these patients had ectopic Cushing’s syndrome. All the cases were characterized by severe hypercortisolemia and the outcome was fatal in 11 cases (167). Patients with Cushing’s syndrome, especially those with severe hypercortisolemia might benefit from prophylaxis with cotrimoxazole before beginning cortisol-lowering therapy.
CRYPTOCOCCOSIS
C. neoformans is another opportunistic infection where Cushing’s syndrome is a predisposing factor. The route of entry is inhalational. It may cause pneumonitis or disseminate systemically to cause more severe infections, such as meningitis and meningoencephalitis (168). Fatal cases have been reported (169,170). The presence of coexisting diabetes might further increase the risk of infection (171).
Glucocorticoid-induced immunosuppression has a few unique characteristics noted with cryptococcosis. For example, alveolar macrophage capacity to attach to and ingest is diminished by cortisone acetate, which potentially may lead to dissemination of the fungus (172). Moreover, chemotactic activity of cerebrospinal fluid toward polymorphonuclear (PMN) leucocytes and monocytes, is substantially reduced by glucocorticoid administration. This leads to lack of PMN leucocyte influx in cerebrospinal fluid and subsequent inability to eradicate fungi like C. neoformans with tropism for the CNS. Glucocorticoid-induced abnormalities of microglial cells further intensify this attenuation. Thus, individuals with hypercortisolemia are predisposed to cryptococcal meningitis (173).
HISTOPLASMOSIS
Pulmonary histoplasmosis has been reported in association with endogenous Cushing’s syndrome (174). Patients receiving glucocorticoids may develop primary or reactivated infections by endemic fungi (175). There are reports of pulmonary histoplasmosis after prolonged glucocorticoid therapy from non-endemic countries as well (176). H. capsulatum, the usual pathogen in most cases of histoplasmosis, enters through the respiratory tract and causes pulmonary histoplasmosis but can also disseminate to cause systemic infection. Pathological features of histoplasmosis are atypical in patients treated with glucocorticoids. Discrete granuloma formation is prevented by the anti-inflammatory properties of glucocorticoids (175).
OTHER FUNGAL INFECTIONS
Other fungal infections reported with hypercortisolemia are C. immitis, mucor, fusarium and blastomyces (159). Besides the heightened risk of fungal inspection in hypercortisolemia, the other concerning issue is masking of the signs and symptoms of infections due to the anti-inflammatory properties of glucocorticoids. Recognition of infections may be delayed in presence of hypercortisolemia, and a high index of suspicion is required for early diagnosis. Treatment of fungal infection must include prompt correction of hypercortisolism and aggressive antifungal therapy.
Chronic Mucocutaneous Candidiasis in Autoimmune Polyendocrine Syndrome Type 1
Autoimmune polyendocrine syndrome type 1 (APS1) is characterized by the classical triad of chronic mucocutaneous candidiasis (CMC), autoimmune hypoparathyroidism, and Addison’s disease. Two of the three classic features should be present to establish the diagnosis of APS1. However, there is a risk of the development of autoimmune diseases affecting almost every organ. APS1 is also known as autoimmune polyendocrinopathy-candidiasis-ectodermal dystrophy (APECED) with ectodermal dysplasia occurring in a third of the patients. Ectodermal dystrophy is not related to candidiasis (121). CMC commonly occurs sporadically secondary to AIDS, diabetes, and immunosuppressive treatment (177). C. albicans is the predominant pathogen but infection with other candida species is also described.
PATHOGENESIS
APS1 is an autosomal recessive disease caused by mutations in the autoimmune regulator (AIRE) gene, located on the short arm of chromosome 21. The functioning of following pathways can be altered in APS1, though the specific contribution in increasing susceptibility to candida infection is not well defined.
- Defects in AIRE gene are associated with autoantibodies to interleukin (IL) 17A, IL17F and IL22, which are key cytokines for the function of the T-helper (Th) 17 cell subset. Loss of function of these cytokines increase susceptibility to candida infections (177).
- Autoimmunity to mediators involved in antigen presentation by B cells may be an additional factor responsible for susceptibility. This is further corroborated by the response to rituximab (anti-CD 20 antibody that prevents B cell function) to certain components of the disease in individuals with AIRE deficiency (178).
- A defect in Dectin-1, a β-glucan receptor, has been shown to diminish tumor necrosis factor α production in APS-1. Innate immune response is affected as a result (179).
CLINICAL SPECTRUM
CMC is the most common component of APS-1. It has been reported in 80-100% of cases in different series (121,177). Onset of CMC is usually in the first decade and cases can be seen in the very first year of life. Mouth, nails and, less frequently, skin, vagina and the esophagus are affected. The infection tends to be persistent or recurrent. Severity of the infection in variable, however disseminated disease is rare (177).
The oral mucosa is the usual site of infection. All spectra of infection starting from localized ulceration, and redness in mild cases to involvement of entire mouth is described. White or grey membrane covering the tongue or mucosa are visible in the hyperplastic form. Cracks (angular cheilitis or perlèche) occurring at the angle of the mouth is common. The atrophic form has areas of leukoplakia, which is a significant risk factor for carcinoma of the oral mucosa. The finger nails are the other site which is commonly affected. There can be an associated paronychia. Onychomycosis in CMC is particularly resistant to treatment (121,180).
TREATMENT
Oral fluconazole is the preferred therapy. Some patients require suppressive treatment with fluconazole 100 mg three times a week. Emergence of resistance remains a possibility with suppressive therapy. Alternatives for fluconazole refractory disease includes itraconazole, Posaconazole, or voriconazole. Rare cases of systemic disease not responding to azoles might require a lipid formulation of amphotericin B or echinocandins (144).
ADVERSE ENDOCRINE EFFECTS OF ANTIFUNGAL AGENTS
The antifungal drugs such as polyenes, azoles and echinocandins can impact the function of endocrine glands. Azoles are recognized for their adverse effect on adrenal cortex and the gonads. The other drugs are also known to cause endocrine dysfunction though less frequently. These important adverse endocrine consequences of the different antifungal agents are discussed below.
Azoles
The azoles are the one of the most frequently administered systemic antifungal agents. They can be divided into two groups on the basis of their structure. Ketoconazole, which belongs to the imidazole group, is associated with multiple endocrine adverse effect, but seldom used orally as an antifungal agent currently. The newer azoles belonging to the triazole group include fluconazole, itraconazole, voriconazole, posaconazole, and isavuconazole. Endocrine dysfunction also occurs with the triazoles but is less frequent (181).
ADRENAL GLAND
The azoles exert their antifungal effect by inhibiting the cytochrome P450 (CYP450) enzyme lanosterol 14-α-demethylase (CYP51) mediated conversion of lanosterol to ergosterol, a critical constituent of fungal cell wall. Mammals do not have this enzyme, but azoles can block the synthesis of glucocorticoids, mineralocorticoids, and sex steroids by blocking CYP450 dependent enzymes involved in steroidogenesis (182).
Ketoconazole
Ketoconazole is a dose-dependent reversible inhibitor of cholesterol desmolase, 17,20-lyase, 11β-hydroxylase, 17α-hydroxylase, and 18-hydroxylase (183). Ketoconazole at doses of more than 200 mg daily can impair glucocorticoid synthesis. Overt adrenal insufficiency is relatively infrequent however it can be seen with doses of 600 to 1200 mg/day, which are often used in the medical management of Cushing’s syndrome (59,184,185). Apart from inhibiting enzymes involved in steroidogenesis, ketoconazole is also a dose-dependent, reversible, competitive antagonist at the glucocorticoid receptor level (186). The inhibitory effect of ketoconazole on adrenal steroid synthesis has been utilized for the medical management of Cushing’s syndrome (187).
Fluconazole and Posaconazole
Adrenal insufficiency has been reported with the imidazole derivatives itraconazole, fluconazole, voriconazole, and posaconazole (188–192). Primary adrenal insufficiency induced by fluconazole has been observed in critically ill patient as a result of CYP450 inhibition (193). Fluconazole has been employed for the medical management of Cushing’s syndrome (194). Posaconazole-induced primary adrenal insufficiency resulting from a similar mechanism has been described (190,192).
Itraconazole and Voriconazole
Itraconazole and voriconazole (also ketoconazole) are potent inhibitors of CYP3A4, the enzyme that partially metabolizes glucocorticoids. The resultant decrease in glucocorticoid clearance produces supraphysiological levels of glucocorticoid from inhaled, nasal or oral steroids (195). The clinical profile resembles that of an iatrogenic Cushing’s syndrome later progressing to secondary or central adrenal insufficiency consequent to suppression of the hypothalamic-pituitary-adrenal (HPA) axis (196). Secondary adrenal insufficiency following combined use of glucocorticoids and itraconazole or voriconazole have been described (188,191). Steroids that are predominantly metabolized by the CYP3A4 pathway include methylprednisolone, fluticasone, budesonide and triamcinolone. It may be prudent to consider alternative glucocorticoids such as prednisolone, beclomethasone, or flunisolide that are not predominantly metabolized by CYP3A4 enzymes when voriconazole or itraconazole is being administered (190,191).
Pseudohyperaldosteronism
Posaconazole and itraconazole has been associated with a syndrome of mineralocorticoid excess manifested by low-renin low-aldosterone hypertension and hypokalemia (197). Two distinct mechanisms are implicated in the pathogenesis with significant interindividual differences. Posaconazole can inhibit the enzyme 11 β-hydroxylase (CYP11B1) and prevent the conversion of 11-deoxycortisol to cortisol. Diminished cortisol synthesis triggers adrenal steroidogenesis as a result of loss of feedback inhibition of the HPA axis and causes accumulation of 11-deoxycortisol (and 11-deoxycorticosterone). Even though aldosterone production is reduced due to posaconazole-induced aldosterone synthase (CYP11B2) inhibition, very high levels of 11-deoxycortisol and 11-deoxycorticosterone can overcome that and produce a state of mineralocorticoid excess (197,198). The other mechanism incriminated is blockage of the peripheral cortisol metabolizing enzyme 11 β-hydroxysteroid dehydrogenase 2 (11β-HSD2) leading to an increased ratio of active to inactive cortisol metabolite. Elevated ratios of cortisol to corticosterone and their tetrahydro-metabolites are observed in such individuals (198). There are few case reports of itraconazole and several reports of posaconazole-induced pseudohyperladosteronism (199–202). Therapeutic options include lowering the dose of azoles or changing to alternatives like isavuconazole (198).
GONADS
Male Sexual Dysfunction
Inhibition of 17,20-lyase by ketoconazole impairs production of testosterone in the male gonads (203). The effect can be seen even at a single dose of 200mg, however lower testosterone levels and longer duration of suppression can be seen with an increasing dose (204). Oligospermia and azoospermia as well as decreased libido and impotence have been reported at doses more than 800mg/day (181). Reversible gynecomastia is another manifestation seen due to increase in the estradiol:testosterone ratio partially attributed to displacement of estrogen from sex-hormone binding globulin by the drug (205).
Ketoconazole also binds to androgen receptors thereby blocking androgen signaling (206). Antiandrogenic properties of ketoconazole have been used in the treatment of prostate cancer, autonomous Leydig cell hyperactivity in children with precocious puberty, and topical therapy for androgenetic alopecia (207–209).
Fluconazole in contrast to ketoconazole does not affect testosterone synthesis (210). A single case of posaconazole induced gynecomastia has been reported. Inhibition of the CYP11B1 enzyme by the drug stimulates compensatory adrenal steroidogenesis. Increased peripheral conversion of adrenal androgens to estrogen was presumed to induce gynecomastia after posaconazole use. The other possible hypothesis could be reduced catabolism of estrogen in the liver due to blocking of CYP3A4 and CYP3A7 (211).
Female Reproductive Dysfunction
Ketoconazole reduces estrogen levels in females. Reduction of estrogen levels could be due to aromatase inhibition or androgen synthesis blockade. Estrogen precursor deprivation from decreased androgen synthesis is likely to be the predominant mechanism (59). In animal studies, ovarian progesterone production is impaired thereby preventing uterine implantation (212). Ketoconazole has been used in treatment of polycystic ovarian syndrome and ovarian hyperthecosis, given its ability to substantially block ovarian androgen synthesis (213). Itraconazole when co-prescribed with simvastatin, induced metrorrhagia in a 69-year old lady, presumably occurring as result of low-estrogen breakthrough bleeding (214). Itraconazole can also enhance estrogen metabolism interfering with efficacy of oral contraceptives (215). Fluconazole on the other hand can increase estrogen levels by inhibiting its metabolism and is not associated with risk of contraceptive failure (216).
HYPONATREMIA
Voriconazole use has been associated with severe hyponatremia. The median time to onset of hyponatremia is 6-26 days (217). Severe hyponatremia, volume depletion, elevated antidiuretic hormone (ADH), and plasma renin activity along with high urinary sodium suggestive of salt-losing nephropathy were observed after voriconazole administration (218). Syndrome of inappropriate ADH secretion (SIADH) has been implicated as another possible mechanism and euvolemia is the critical distinguishing feature from salt-losing nephropathy (219). The toxic effect of voriconazole is concentration-dependent and therapeutic drug monitoring has been found to be useful for prevention and dose adjustment for hyponatremia (220). The risk of hyponatremia increased with trough concentrations > 7 mg/L and the dose should be modified to maintain levels below that threshold (181). An interesting observation was predisposition to develop voriconazole induced hyponatremia among Asians, in whom polymorphism of CYP2C19 is more common (221). CYP2C19 is the enzyme that metabolizes voriconazole and dosing depending on genotype has been proposed as a means to avert its adverse effects including hyponatremia (222,223).
FLUORIDE-INDUCED PERIOSTITIS
There are several reports of voriconazole-induced periostitis presumably related to excess fluoride released from the three fluorine atoms present in the molecule (224–228). A 400 mg tablet of voriconazole contains approximately 65 mg of fluoride, however only 5% of the fluoride is generated from the drug in free form (181,224). The other fluorinated azoles fluconazole and posaconazole contain two atoms of fluorides and have not been associated with fluorosis and periostitis (225).
A review summarizing 98 cases of periostitis, reported the median age to be 59 years with onset of symptoms between 6 weeks to 8 years after drug exposure. Presenting features are muscle and bone pain. Affection of almost any skeletal site has been described (229). Ribs and ulna are the most common site of involvement. The other involved sites include tibia, clavicle, femur, radius, fibula, scapula, and humerus (224,229).
The serum fluoride and alkaline phosphatase levels are significantly higher in those with periostitis compared to those without (224). The plain radiograph reveals multiple areas of periosteal thickening along with formation of new bones which may take the form of an exostoses or can be fluffy. The radiological findings are analogous to periostitis deformans observed in fluoride intoxication (230). Bone scan shows increased tracer uptake but unlike hypertrophic osteoarthropathy tend to be asymmetric (224). Discontinuation of voriconazole usually results in improvement in the majority of cases. Substitution by a non-fluorinated azole such as itraconazole can be considered when continued antifungal coverage is necessary. Replacement by posaconazole has also been beneficial (228).
OTHER ENDOCRINE ABNORMALITIES
High dose ketoconazole (1200mg/day) may rarely cause hypothyroidism by interference with iodine and thyroid peroxidase (231). Ketoconazole is also an inhibitor of 25(OH)D-1α hydroxylase (CYP27B1) leading to decreased 1,25(OH)2D levels (232). Hypercalcemia induced by sarcoidosis, tuberculosis and other granulomatous disorders respond to treatment with ketoconazole (233,234). Both ketoconazole and fluconazole are treatment options for idiopathic infantile hypercalciuria that occurs from CYP24A1 (24-hydroxylase) gene mutations (235,236). The effects of ketoconazole on enzymes regulating vitamin D has also been explored for treatment of prostate cancer (208,237).
There are rare reports of pancreatitis with fluconazole, itraconazole, and voriconazole (181). Voriconazole, ketoconazole, and fluconazole have been implicated as a cause of hypoglycemia (238,239). The hypoglycemia could be due to hyperinsulinemia resulting from decreased degradation of insulin (240). The metabolism of sulfonylureas can be inhibited by fluconazole thereby increasing the risk of hypoglycemia in individuals receiving both these drugs (241,242).
Polyenes
The polyenes currently in medical use are nystatin and amphotericin B. Use of nystatin is limited to topical application. Amphotericin B deoxycholate is associated with higher risk of toxicity as compared to its lipid preparation. The lipid formulations of amphotericin B are expensive but the risk of adverse effect is less. Electrolyte abnormalities resulting from tubular damage is the predominant endocrine dysfunction described with amphotericin B. Rare cases of pancreatitis have occurred with liposomal amphotericin B (243).
TUBULAR DAMAGE
Clinical manifestations of amphotericin B induced nephrotoxicity include renal insufficiency, hypokalemia, hypomagnesemia, metabolic acidosis resulting from distal renal tubular acidosis, and polyuria due to nephrogenic diabetes insipidus (DI) (244–246). The mechanism for DI involves a decrease in aquaporin 2 expression in the kidney medulla, that makes the collecting tubules insensitive to ADH (244). Although the risk of nephrogenic DI with lipid preparations of amphotericin B is significantly less, cases have still been described (247). Nephrogenic DI can be managed by amiloride plus hydrochlorothiazide, or indomethacin (248).
Nephrogenic DI can also be induced by hypokalemia caused by amphotericin B (249). Hypokalemia is more common with amphotericin B deoxycholate but is also recognized with lipid preparations of amphotericin B (250). Amphotericin B can induce apoptosis of renal tubular cells and also enhance tubular permeability by damage to lining epithelium (251). Renal magnesium loss can also result from amphotericin B. PTH secretion is affected by hypomagnesemia and that may subsequently lead to hypocalcemia (252). Monitoring and supplementing potassium and magnesium is an important adjunct to prevent adverse consequences of amphotericin B therapy (253).
Echinocandins
Capsofungin, micofungin and antidulafungin are the three echinocandins currently in clinical use. These agents, unlike azoles or amphotericin B, do not usually cause adverse endocrine effects. Micafungin is rarely reported to cause pancreatitis (254). Caspofungin has been reported to induce hypercalcemia in an infant by an undefined mechanism (255).
Other Agents
Oral potassium iodide is used in treatment of cutaneous sporotrichosis (256). It may precipitate thyrotoxicosis in patients with incipient Graves’ disease or multinodular goiter in areas of relative iodine deficiency (Jod-Basedow disease). Hypothyroidism can occur in those with excessive autoregulation on prolonged exposure (Wolff-Chaikoff effect) (257).
CONCLUSION
Although fungi are ubiquitous within the environment, very few are considered true pathogens and affect healthy individuals only in limited circumstances. The majority of fungi are opportunistic and immune dysfunction in endocrine disorders increase susceptibility to fungal infection. On the other hand, fungal diseases especially in immunocompromised host can disseminate and affect various endocrine glands thereby impairing their function. Antifungal therapies too contribute to endocrine adverse effects. Moreover, in few endocrinological conditions like Cushing’s syndrome, signs and symptoms of fungal infection can be masked due to effect of hypercortisolemia. A high index of suspicion is mandated in such cases, as delayed or missed diagnosis could dramatically influence the outcome. An understanding of the complex relationship between fungal infection and endocrine disorders is necessary in modern-day medicine as both these conditions are increasingly prevalent.
REFERENCES
- Qin J, Li R, Raes J, Arumugam M, Burgdorf KS, Manichanh C, et al. A human gut microbial gene catalogue established by metagenomic sequencing. Nature. 2010 Mar 4;464(7285):59–65.
- Havlickova B, Czaika VA, Friedrich M. Epidemiological trends in skin mycoses worldwide. Mycoses. 2008 Sep;51 Suppl 4:2–15.
- Bitar D, Lortholary O, Le Strat Y, Nicolau J, Coignard B, Tattevin P, et al. Population-based analysis of invasive fungal infections, France, 2001-2010. Emerg Infect Dis. 2014 Jul;20(7):1149–55.
- Pekic S, Miljic D, Popovic V. Infections of the Hypothalamic-Pituitary Region. In: Feingold KR, Anawalt B, Boyce A, Chrousos G, de Herder WW, Dungan K, et al., editors. Endotext [Internet]. South Dartmouth (MA): MDText.com, Inc.; 2000 [cited 2021 Mar 12]. Available from: http://www.ncbi.nlm.nih.gov/books/NBK532083/
- Catarino D, Ribeiro C, Gomes L, Paiva I. Corticotroph adenoma and pituitary fungal infection: a rare association. Endocrinol Diabetes Metab Case Rep. 2020 Mar 25;2020.
- Al-Mendalawi MD. Pituitary aspergillosis: A report and review of the literature. Neurol India. 2018 Oct;66(5):1525.
- Iplikcioglu AC, Bek S, Bikmaz K, Ceylan D, Gökduman CA. Aspergillus pituitary abscess. Acta Neurochir (Wien). 2004 May;146(5):521–4.
- Moore LA, Erstine EM, Prayson RA. Pituitary aspergillus infection. J Clin Neurosci Off J Neurosurg Soc Australas. 2016 Jul;29:178–80.
- Strickland BA, Pham M, Bakhsheshian J, Carmichael J, Weiss M, Zada G. Endoscopic Endonasal Transsphenoidal Drainage of a Spontaneous Candida glabrata Pituitary Abscess. World Neurosurg. 2018 Jan;109:467–70.
- Heary RF, Maniker AH, Wolansky LJ. Candidal pituitary abscess: case report. Neurosurgery. 1995 May;36(5):1009–12; discussion 1012-1013.
- Sano T, Kovacs K, Scheithauer BW, Rosenblum MK, Petito CK, Greco CM. Pituitary pathology in acquired immunodeficiency syndrome. Arch Pathol Lab Med. 1989 Sep;113(9):1066–70.
- Bartlett JA, Hulette C. Central nervous system pneumocystosis in a patient with AIDS. Clin Infect Dis Off Publ Infect Dis Soc Am. 1997 Jul;25(1):82–5.
- Scanarini M, Rotilio A, Rigobello L, Pomes A, Parenti A, Alessio L. Primary intrasellar coccidioidomycosis simulating a pituitary adenoma. Neurosurgery. 1991 May;28(5):748–51.
- Vijayvargiya P, Javed I, Moreno J, Mynt MA, Kotapka M, Zaki R, et al. Pituitary aspergillosis in a kidney transplant recipient and review of the literature. Transpl Infect Dis Off J Transplant Soc. 2013 Oct;15(5):E196-200.
- Choi E, Kim SB, Kim JH, Yoon YK. Lung aspergilloma with pituitary invasive aspergillosis presenting as headache and hyponatraemia. BMJ Case Rep. 2021 Jan 27;14(1).
- Saffarian A, Derakhshan N, Taghipour M, Eghbal K, Roshanfarzad M, Dehghanian A. Sphenoid Aspergilloma with Headache and Acute Vision Loss. World Neurosurg. 2018 Jul;115:159–61.
- Stalldecker G, Molina HA, Antelo N, Arakaki T, Sica RE, Basso A. [Hypopituitarism caused by colonic carcinoma metastasis associated with hypophysial aspergillosis]. Medicina (Mex). 1994;54(3):248–52.
- Ouyang T, Zhang N, Wang L, Jiao J, Zhao Y, Li Z, et al. Primary Aspergillus sellar abscess simulating pituitary tumor in immunocompetent patient. J Craniofac Surg. 2015 Mar;26(2):e86-88.
- Hong W, Liu Y, Chen M, Lin K, Liao Z, Huang S. Secondary headache due to aspergillus sellar abscess simulating a pituitary neoplasm: case report and review of literature. SpringerPlus. 2015;4:550.
- Fontana C, Gaziano R, Favaro M, Casalinuovo I, Pistoia E, Di Francesco P. (1-3)-β-D-Glucan vs Galactomannan Antigen in Diagnosing Invasive Fungal Infections (IFIs). Open Microbiol J. 2012 Aug 24;6:70–3.
- Patterson TF, Thompson GR, Denning DW, Fishman JA, Hadley S, Herbrecht R, et al. Practice Guidelines for the Diagnosis and Management of Aspergillosis: 2016 Update by the Infectious Diseases Society of America. Clin Infect Dis Off Publ Infect Dis Soc Am. 2016 Aug 15;63(4):e1–60.
- Miceli MH. Central Nervous System Infections Due to Aspergillus and Other Hyaline Molds. J Fungi [Internet]. 2019 Aug 30 [cited 2021 Mar 21];5(3). Available from: https://www.ncbi.nlm.nih.gov/pmc/articles/PMC6787746/
- Shrestha RT, Hennessey J. Acute and Subacute, and Riedel’s Thyroiditis. In: Feingold KR, Anawalt B, Boyce A, Chrousos G, de Herder WW, Dungan K, et al., editors. Endotext [Internet]. South Dartmouth (MA): MDText.com, Inc.; 2000 [cited 2021 Mar 21]. Available from: http://www.ncbi.nlm.nih.gov/books/NBK285553/
- Tan J, Shen J, Fang Y, Zhu L, Liu Y, Gong Y, et al. A suppurative thyroiditis and perineal subcutaneous abscess related with aspergillus fumigatus: a case report and literature review. BMC Infect Dis. 2018 Dec 27;18(1):702.
- Zavascki AP, Maia AL, Goldani LZ. Pneumocystis jiroveci thyroiditis: report of 15 cases in the literature. Mycoses. 2007 Nov;50(6):443–6.
- Mori T, Matsumura M, Yamada K, Irie S, Oshimi K, Suda K, et al. Systemic aspergillosis caused by an aflatoxin-producing strain of Aspergillus flavus. Med Mycol. 1998 Apr;36(2):107–12.
- Cicora F, Mos F, Paz M, Roberti J. Successful treatment of acute thyroiditis due to Aspergillus spp. in the context of disseminated invasive aspergillosis in a kidney transplant patient. Nefrol Publicacion Of Soc Espanola Nefrol. 2013;33(4):618–9.
- Solak Y, Atalay H, Nar A, Ozbek O, Turkmen K, Erekul S, et al. Aspergillus thyroiditis in a renal transplant recipient mimicking subacute thyroiditis. Transpl Infect Dis Off J Transplant Soc. 2011 Apr;13(2):178–81.
- Badawy SM, Becktell KD, Muller WJ, Schneiderman J. Aspergillus thyroiditis: first antemortem case diagnosed by fine-needle aspiration culture in a pediatric stem cell transplant patient. Transpl Infect Dis Off J Transplant Soc. 2015 Dec;17(6):868–71.
- Phulware RH, Gupta B, Sahoo B, Agarwal S, Mathur S. Aspergillus thyroiditis: In an immunocompromised young adult. Diagn Cytopathol. 2019 Apr;47(4):362–4.
- Santiago M, Martinez JH, Palermo C, Figueroa C, Torres O, Trinidad R, et al. Rapidly growing thyroid mass in an immunocompromised young male adult. Case Rep Endocrinol. 2013;2013:290843.
- Kishi Y, Negishi M, Kami M, Hamaki T, Miyakoshi S, Ueyama J, et al. Fatal airway obstruction caused by invasive aspergillosis of the thyroid gland. Leuk Lymphoma. 2002 Mar;43(3):669–71.
- Marui S, de Lima Pereira AC, de Araújo Maia RM, Borba EF. Suppurative thyroiditis due to aspergillosis: a case report. J Med Case Reports. 2014 Nov 21;8:379.
- Nicolè S, Lanzafame M, Cazzadori A, Vincenzi M, Mangani F, Colato C, et al. Successful Antifungal Combination Therapy and Surgical Approach for Aspergillus fumigatus Suppurative Thyroiditis Associated with Thyrotoxicosis and Review of Published Reports. Mycopathologia. 2017 Oct;182(9–10):839–45.
- Erdem H, Uzunlar AK, Yildirim U, Yildirim M, Geyik MF. Diffuse infiltration of Aspergillus hyphae in the thyroid gland with multinodular goiter. Indian J Pathol Microbiol. 2011 Dec;54(4):814–6.
- Rahimi SA. Disseminated Pneumocystis carinii in thymic alymphoplasia. Arch Pathol. 1974 Mar;97(3):162–5.
- Niles D, Boguniewicz J, Shakeel O, Margolin J, Chelius D, Gupta M, et al. Candida tropicalis Thyroiditis Presenting With Thyroid Storm in a Pediatric Patient With Acute Lymphocytic Leukemia. Pediatr Infect Dis J. 2019 Oct;38(10):1051–3.
- Fernandez JF, Anaissie EJ, Vassilopoulou-Sellin R, Samaan NA. Acute fungal thyroiditis in a patient with acute myelogenous leukaemia. J Intern Med. 1991 Dec;230(6):539–41.
- Berry CZ, Goldberg LC, Shepard WL. Systemic lupus erythematosus complicated by coccidioidomycosis. JAMA. 1968 Oct 28;206(5):1083–5.
- Smilack JD, Argueta R. Coccidioidal infection of the thyroid. Arch Intern Med. 1998 Jan 12;158(1):89–92.
- Goldani LZ, Klock C, Diehl A, Monteiro AC, Maia AL. Histoplasmosis of the thyroid. J Clin Microbiol. 2000 Oct;38(10):3890–1.
- Goldani LZ, Zavascki AP, Maia AL. Fungal thyroiditis: an overview. Mycopathologia. 2006 Mar;161(3):129–39.
- Nguyen J, Manera R, Minutti C. Aspergillus thyroiditis: a review of the literature to highlight clinical challenges. Eur J Clin Microbiol Infect Dis Off Publ Eur Soc Clin Microbiol. 2012 Dec;31(12):3259–64.
- Lee D-G, Lee H-J, Yan JL, Lin SS-F, Aram JA. Efficacy and safety of combination antifungal therapy in Korean haematological patients with invasive aspergillosis. Mycoses. 2019 Oct;62(10):969–78.
- Marr KA, Schlamm HT, Herbrecht R, Rottinghaus ST, Bow EJ, Cornely OA, et al. Combination antifungal therapy for invasive aspergillosis: a randomized trial. Ann Intern Med. 2015 Jan 20;162(2):81–9.
- Goltzman D. Approach to Hypercalcemia. In: Feingold KR, Anawalt B, Boyce A, Chrousos G, de Herder WW, Dhatariya K, et al., editors. Endotext [Internet]. South Dartmouth (MA): MDText.com, Inc.; 2000 [cited 2021 May 18]. Available from: http://www.ncbi.nlm.nih.gov/books/NBK279129/
- Gurram PR, Castillo NE, Esquer Garrigos Z, Vijayvargiya P, Abu Saleh OM. A Dimorphic Diagnosis of a Pleomorphic Disease: An Unusual Cause of Hypercalcemia. Am J Med. 2020 Nov;133(11):e659–62.
- Spindel SJ, Hamill RJ, Georghiou PR, Lacke CE, Green LK, Mallette LE. Case report: vitamin D-mediated hypercalcemia in fungal infections. Am J Med Sci. 1995 Aug;310(2):71–6.
- Ahmed B, Jaspan JB. Case report: hypercalcemia in a patient with AIDS and Pneumocystis carinii pneumonia. Am J Med Sci. 1993 Nov;306(5):313–6.
- Huang J-C, Kuo M-C, Hwang S-J, Hwang D-Y, Chen H-C. Vitamin D-mediated hypercalcemia as the initial manifestation of pulmonary cryptococcosis in an HIV-uninfected patient. Intern Med Tokyo Jpn. 2012;51(13):1793–6.
- Hamroun A, Lenain R, Bui Nguyen L, Chamley P, Loridant S, Neugebauer Y, et al. Hypercalcemia is common during Pneumocystis pneumonia in kidney transplant recipients. Sci Rep. 2019 Aug 29;9(1):12508.
- Giordani MC, Villamil Cortez SK, Diehl M, Barcan LA, Rosa-Diez G, Groppa SR, et al. Hypercalcemia as an Early Finding of Opportunistic Fungal Pneumonia in Renal Transplantation: A Case Series Report. Transplant Proc. 2020 May;52(4):1178–82.
- Walker JV, Baran D, Yakub N, Freeman RB. Histoplasmosis with hypercalcemia, renal failure, and papillary necrosis. Confusion with sarcoidosis. JAMA. 1977 Mar 28;237(13):1350–2.
- Murray JJ, Heim CR. Hypercalcemia in disseminated histoplasmosis. Aggravation by vitamin D. Am J Med. 1985 May;78(5):881–4.
- Chalhoub E, Elhomsy G, Brake M. Hypercalcemia in histoplasmosis aggravated with antifungal treatment. J Med Liban. 2012 Sep;60(3):165–8.
- Lawn SD, Macallan DC. Hypercalcemia: a manifestation of immune reconstitution complicating tuberculosis in an HIV-infected person. Clin Infect Dis Off Publ Infect Dis Soc Am. 2004 Jan 1;38(1):154–5.
- Caldwell JW, Arsura EL, Kilgore WB, Reddy CM, Johnson RH. Hypercalcemia in patients with disseminated coccidioidomycosis. Am J Med Sci. 2004 Jan;327(1):15–8.
- Fierer J, Burton DW, Haghighi P, Deftos LJ. Hypercalcemia in disseminated coccidioidomycosis: expression of parathyroid hormone-related peptide is characteristic of granulomatous inflammation. Clin Infect Dis Off Publ Infect Dis Soc Am. 2012 Oct;55(7):e61-66.
- Lionakis MS, Samonis G, Kontoyiannis DP. Endocrine and Metabolic Manifestations of Invasive Fungal Infections and Systemic Antifungal Treatment. Mayo Clin Proc. 2008 Sep;83(9):1046–60.
- Reinholt FP, Hultenby K, Oldberg A, Heinegård D. Osteopontin--a possible anchor of osteoclasts to bone. Proc Natl Acad Sci U S A. 1990 Jun;87(12):4473–5.
- Siddiqi A, Goh BT, Brown CL, Hillman RJ, Monson JP. Hypothyroidism and hypoparathyroidism associated with Pneumocystis carinii infection in a patient with AIDS. Int J STD AIDS. 1998 Feb;9(2):108–10.
- Wheat LJ, Azar MM, Bahr NC, Spec A, Relich RF, Hage C. Histoplasmosis. Infect Dis Clin North Am. 2016 Mar;30(1):207–27.
- Kauffman CA. Endemic mycoses: blastomycosis, histoplasmosis, and sporotrichosis. Infect Dis Clin North Am. 2006 Sep;20(3):645–62, vii.
- Sharma B, Nehara HR, Bhavi VK, Maan P, Saran S. Adrenal histoplasmosis in immunocompetent individuals a case series from the North-Western part of India, Rajasthan province: An emerging endemic focus. Indian J Med Microbiol. 2020 Dec;38(3 & 4):485–8.
- Pereira GH, Lanzoni VPB, Beirão EM, Timerman A, Melhem M de SC. DISSEMINATED FUNGAL INFECTION WITH ADRENAL INVOLVEMENT: REPORT OF TWO HIV NEGATIVE BRAZILIAN PATIENTS. Rev Inst Med Trop Sao Paulo. 2015 Dec;57(6):527–30.
- Alexandraki KI, Grossman A. Adrenal Insufficiency. In: Feingold KR, Anawalt B, Boyce A, Chrousos G, de Herder WW, Dhatariya K, et al., editors. Endotext [Internet]. South Dartmouth (MA): MDText.com, Inc.; 2000 [cited 2021 May 23]. Available from: http://www.ncbi.nlm.nih.gov/books/NBK279122/
- Paolo WF, Nosanchuk JD. Adrenal infections. Int J Infect Dis. 2006 Sep;10(5):343–53.
- Frenkel JK. Role of corticosteroids as predisposing factors in fungal diseases. Lab Investig J Tech Methods Pathol. 1962 Nov;11:1192–208.
- Roubsanthisuk W, Sriussadaporn S, Vawesorn N, Parichatikanond P, Phoojaroenchanachai M, Homsanit M, et al. Primary adrenal insufficiency caused by disseminated histoplasmosis: report of two cases. Endocr Pract Off J Am Coll Endocrinol Am Assoc Clin Endocrinol. 2002 Jun;8(3):237–41.
- Leal AMO, Magalhães PKR, Martinez R, Moreira AC. Adrenocortical hormones and interleukin patterns in paracoccidioidomycosis. J Infect Dis. 2003 Jan 1;187(1):124–7.
- Del Negro G, Melo EH, Rodbard D, Melo MR, Layton J, Wachslicht-Rodbard H. Limited adrenal reserve in paracoccidioidomycosis: cortisol and aldosterone responses to 1-24 ACTH. Clin Endocrinol (Oxf). 1980 Dec;13(6):553–9.
- Cherri J, Freitas MA, Llorach-Velludo MA, Piccinato CE. Paracoccidioidomycotic aortitis with embolization to the lower limbs. Report of a case and review of the literature. J Cardiovasc Surg (Torino). 1998 Oct;39(5):573–6.
- Disseminated Histoplasmosis and Rare Adrenal Involvement: Evidence of Absence or Absence of Evidence. Front Cell Infect Microbiol [Internet]. 2021 Mar 15 [cited 2021 May 23];11. Available from: https://www.ncbi.nlm.nih.gov/pmc/articles/PMC8005706/
- Goodwin RA, Shapiro JL, Thurman GH, Thurman SS, Des Prez RM. Disseminated histoplasmosis: clinical and pathologic correlations. Medicine (Baltimore). 1980 Jan;59(1):1–33.
- Gupta A, Ghosh A, Singh G, Xess I. A Twenty-First-Century Perspective of Disseminated Histoplasmosis in India: Literature Review and Retrospective Analysis of Published and Unpublished Cases at a Tertiary Care Hospital in North India. Mycopathologia. 2017 Dec;182(11–12):1077–93.
- Sifuentes-Osornio J, Corzo-León DE, Ponce-de-León LA. Epidemiology of Invasive Fungal Infections in Latin America. Curr Fungal Infect Rep. 2012 Mar;6(1):23–34.
- Carvalho FP de F de, Curiati JAE, Mauad T, Incerti MM, Jacob Filho W. Bilateral adrenal [corrected] nodules due to histoplasmosis in an elderly. Braz J Infect Dis Off Publ Braz Soc Infect Dis. 2007 Feb;11(1):160–2.
- Peçanha PM, Batista Ferreira ME, Massaroni Peçanha MA, Schmidt EB, Lamas de Araújo M, Zanotti RL, et al. Paracoccidioidomycosis: Epidemiological and Clinical Aspects in 546 Cases Studied in the State of Espírito Santo, Brazil. Am J Trop Med Hyg. 2017 Sep;97(3):836–44.
- Bocca AL, Amaral AC, Teixeira MM, Sato PK, Sato P, Shikanai-Yasuda MA, et al. Paracoccidioidomycosis: eco-epidemiology, taxonomy and clinical and therapeutic issues. Future Microbiol. 2013 Sep;8(9):1177–91.
- Sharma N, Ahlawat RS, Singh H, Sharma C, Anuradha S. Pneumocystis jirovecii infection of bilateral adrenal glands in an immunocompetent adult: a case report. J R Coll Physicians Edinb. 2019 Sep;49(3):222–4.
- Kumar A, Sreehari S, Velayudhan K, Biswas L, Babu R, Ahmed S, et al. Autochthonous blastomycosis of the adrenal: first case report from Asia. Am J Trop Med Hyg. 2014 Apr;90(4):735–9.
- Ito M, Hinata T, Tamura K, Koga A, Ito T, Fujii H, et al. Disseminated Cryptococcosis with Adrenal Insufficiency and Meningitis in an Immunocompetent Individual. Intern Med Tokyo Jpn. 2017;56(10):1259–64.
- Koene RJ, Catanese J, Sarosi GA. Adrenal hypofunction from histoplasmosis: a literature review from 1971 to 2012. Infection. 2013 Aug;41(4):757–9.
- Porntharukchareon T, Khahakaew S, Sriprasart T, Paitoonpong L, Snabboon T. Bilateral Adrenal Histoplasmosis. Balk Med J. 2019 Dec;36(6):359–600.
- Ahuja A, Mathur SR, Iyer VK, Sharma SK, Kumar N, Agarwal S. Histoplasmosis presenting as bilateral adrenal masses: cytomorphological diagnosis of three cases. Diagn Cytopathol. 2012 Aug;40(8):729–31.
- de Morais RQ, Salomon MFB, Corbiceiro WCH, de Melo ASA, Corrêa DG. Imaging contribution for the diagnosis of disseminated paracoccidioidomycosis. Int J Infect Dis IJID Off Publ Int Soc Infect Dis. 2020 Dec;101:206–9.
- Gupta P, Bhalla A, Sharma R. Bilateral adrenal lesions. J Med Imaging Radiat Oncol. 2012 Dec;56(6):636–45.
- Dhamija E, Panda A, Das CJ, Gupta AK. Adrenal imaging (Part 2): Medullary and secondary adrenal lesions. Indian J Endocrinol Metab. 2015;19(1):16–24.
- Gaspar GG, Cocio TA, Guioti-Puga F, Nascimento E, Fabro AT, Kress MR von Z, et al. Paracoccidioidomycosis due to Paracoccidioides lutzii complicated with adrenal injury and pulmonary arterial hypertension. Rev Inst Med Trop São Paulo [Internet]. [cited 2021 May 24];62. Available from: https://www.ncbi.nlm.nih.gov/pmc/articles/PMC7669275/
- Shanmugam N, Isenmann R, Barkin JS, Beger HG. Pancreatic fungal infection. Pancreas. 2003 Aug;27(2):133–8.
- Karam MB, Mosadegh L. Extra-pulmonary Pneumocystis jiroveci infection: a case report. Braz J Infect Dis Off Publ Braz Soc Infect Dis. 2014 Dec;18(6):681–5.
- Guice KS, Lynch M, Weatherbee L. Invasive aspergillosis: an unusual cause of hemorrhagic pancreatitis. Am J Gastroenterol. 1987 Jun;82(6):563–5.
- Cappell MS, Hassan T. Pancreatic disease in AIDS--a review. J Clin Gastroenterol. 1993 Oct;17(3):254–63.
- Trikudanathan G, Navaneethan U, Vege SS. Intra-abdominal fungal infections complicating acute pancreatitis: a review. Am J Gastroenterol. 2011 Jul;106(7):1188–92.
- Isenmann R, Schwarz M, Rau B, Trautmann M, Schober W, Beger HG. Characteristics of infection with Candida species in patients with necrotizing pancreatitis. World J Surg. 2002 Mar;26(3):372–6.
- Sahar N, Kozarek RA, Kanji ZS, Chihara S, Gan SI, Irani S, et al. The microbiology of infected pancreatic necrosis in the era of minimally invasive therapy. Eur J Clin Microbiol Infect Dis Off Publ Eur Soc Clin Microbiol. 2018 Jul;37(7):1353–9.
- Tange K, Yokota T, Sunago K, Aono M, Ochi H, Takechi S, et al. A rare case of acute pancreatitis caused by Candida Albicans. Clin J Gastroenterol. 2019 Feb;12(1):82–7.
- Chung RT, Schapiro RH, Warshaw AL. Intraluminal pancreatic candidiasis presenting as recurrent pancreatitis. Gastroenterology. 1993 May;104(5):1532–4.
- Giannopoulos A, Giamarellos-Bourboulis EJ, Adamakis I, Georgopoulou I, Petrikkos G, Katsilambros N. Epididymitis caused by Candida glabrata: a novel infection in diabetic patients? Diabetes Care. 2001 Nov;24(11):2003–4.
- Seo R, Oyasu R, Schaeffer A. Blastomycosis of the epididymis and prostate. Urology. 1997 Dec;50(6):980–2.
- Botero-García CA, Faccini-Martínez ÁA, Uribe E, Calixto O-J, Pérez-Díaz CE, Osejo-Diago PP, et al. Epididymo-orchitis caused by Histoplasma capsulatumin a Colombian patient. Rev Soc Bras Med Trop. 2017 Dec;50(6):868–70.
- Hood SV, Bell D, McVey R, Wilson G, Wilkins EG. Prostatitis and epididymo-orchitis due to Aspergillus fumigatus in a patient with AIDS. Clin Infect Dis Off Publ Infect Dis Soc Am. 1998 Jan;26(1):229–31.
- James CL, Lomax-Smith JD. Cryptococcal epididymo-orchitis complicating steroid therapy for relapsing polychondritis. Pathology (Phila). 1991 Jul;23(3):256–8.
- Jenkin GA, Choo M, Hosking P, Johnson PD. Candidal epididymo-orchitis: case report and review. Clin Infect Dis Off Publ Infect Dis Soc Am. 1998 Apr;26(4):942–5.
- Eickenberg H-Unull, Amin M, Lich R. Blastomycosis of the genitourinary tract. J Urol. 1975 May;113(5):650–2.
- Tichindelean C, East JW, Sarria JC. Disseminated histoplasmosis presenting as granulomatous epididymo-orchitis. Am J Med Sci. 2009 Sep;338(3):238–40.
- Fijak M, Pilatz A, Hedger MP, Nicolas N, Bhushan S, Michel V, et al. Infectious, inflammatory and ‘autoimmune’ male factor infertility: how do rodent models inform clinical practice? Hum Reprod Update. 2018 Jul;24(4):416–41.
- Nagy B, Sutka P. Demonstration of antibodies against Candida guilliermondii var. guilliermondii in asymptomatic infertile men. Mycoses. 1992 Oct;35(9–10):247–50.
- Lareau SM, Beigi RH. Pelvic inflammatory disease and tubo-ovarian abscess. Infect Dis Clin North Am. 2008 Dec;22(4):693–708.
- Curry A, Williams T, Penny ML. Pelvic Inflammatory Disease: Diagnosis, Management, and Prevention. Am Fam Physician. 2019 Sep 15;100(6):357–64.
- Saccente M, Woods GL. Clinical and laboratory update on blastomycosis. Clin Microbiol Rev. 2010 Apr;23(2):367–81.
- Chowfin A, Tight R. Female genital coccidioidomycosis (FGC), Addison’s disease and sigmoid loop abscess due to Coccidioides immites; case report and review of literature on FGC. Mycopathologia. 1999;145(3):121–6.
- Bæk O, Astvad K, Serizawa R, Wheat LJ, Brenøe PT, Hansen A-BE. Peritoneal and genital coccidioidomycosis in an otherwise healthy Danish female: a case report. BMC Infect Dis. 2017 Jan 31;17(1):105.
- To V, Gurberg J, Krishnamurthy S. Tubo-Ovarian Abscess Caused by Candida Albicans in an Obese Patient. J Obstet Gynaecol Can JOGC J Obstet Gynecol Can JOGC. 2015 May;37(5):426–9.
- Toy EC, Scerpella EG, Riggs JW. Tuboovarian abscess associated with Candida glabrata in a woman with an intrauterine device. A case report. J Reprod Med. 1995 Mar;40(3):223–5.
- Okmen F, Ekici H, Ari SA. Case Report of a Tubo-ovarian Abscess Caused by Candida kefyr. J Obstet Gynaecol Can JOGC J Obstet Gynecol Can JOGC. 2018 Nov;40(11):1466–7.
- Hsu W-C, Lee Y-H, Chang D-Y. Tuboovarian abscess caused by Candida in a woman with an intrauterine device. Gynecol Obstet Invest. 2007;64(1):14–6.
- Bylund DJ, Nanfro JJ, Marsh WL. Coccidioidomycosis of the female genital tract. Arch Pathol Lab Med. 1986 Mar;110(3):232–5.
- Tatay E, Meca G, Font G, Ruiz M-J. Interactive effects of zearalenone and its metabolites on cytotoxicity and metabolization in ovarian CHO-K1 cells. Toxicol Vitro Int J Publ Assoc BIBRA. 2014 Feb;28(1):95–103.
- Minervini F, Giannoccaro A, Cavallini A, Visconti A. Investigations on cellular proliferation induced by zearalenone and its derivatives in relation to the estrogenic parameters. Toxicol Lett. 2005 Dec 15;159(3):272–83.
- Sperling MA, Angelousi A, Yau M. Autoimmune Polyglandular Syndromes. In: Feingold KR, Anawalt B, Boyce A, Chrousos G, de Herder WW, Dhatariya K, et al., editors. Endotext [Internet]. South Dartmouth (MA): MDText.com, Inc.; 2000 [cited 2021 May 30]. Available from: http://www.ncbi.nlm.nih.gov/books/NBK279152/
- Zhou K, Lansang MC. Diabetes Mellitus and Infections. In: Feingold KR, Anawalt B, Boyce A, Chrousos G, de Herder WW, Dhatariya K, et al., editors. Endotext [Internet]. South Dartmouth (MA): MDText.com, Inc.; 2000 [cited 2021 May 31]. Available from: http://www.ncbi.nlm.nih.gov/books/NBK569326/
- Higa M. [Clinical epidemiology of fungal infection in diabetes]. Nihon Rinsho Jpn J Clin Med. 2008 Dec;66(12):2239–44.
- Rodrigues CF, Rodrigues ME, Henriques M. Candida sp. Infections in Patients with Diabetes Mellitus. J Clin Med [Internet]. 2019 Jan 10 [cited 2021 May 31];8(1). Available from: https://www.ncbi.nlm.nih.gov/pmc/articles/PMC6352194/
- Tsang CSP, Chu FCS, Leung WK, Jin LJ, Samaranayake LP, Siu SC. Phospholipase, proteinase and haemolytic activities of Candida albicans isolated from oral cavities of patients with type 2 diabetes mellitus. J Med Microbiol. 2007 Oct;56(Pt 10):1393–8.
- Mba IE, Nweze EI. Mechanism of Candida pathogenesis: revisiting the vital drivers. Eur J Clin Microbiol Infect Dis Off Publ Eur Soc Clin Microbiol. 2020 Oct;39(10):1797–819.
- Rautemaa R, Ramage G. Oral candidosis--clinical challenges of a biofilm disease. Crit Rev Microbiol. 2011 Nov;37(4):328–36.
- Axéll T, Samaranayake LP, Reichart PA, Olsen I. A proposal for reclassification of oral candidosis. Oral Surg Oral Med Oral Pathol Oral Radiol Endod. 1997 Aug;84(2):111–2.
- Millsop JW, Fazel N. Oral candidiasis. Clin Dermatol. 2016 Aug;34(4):487–94.
- Unnikrishnan AG, Kalra S, Purandare V, Vasnawala H. Genital Infections with Sodium Glucose Cotransporter-2 Inhibitors: Occurrence and Management in Patients with Type 2 Diabetes Mellitus. Indian J Endocrinol Metab. 2018;22(6):837–42.
- Dovnik A, Golle A, Novak D, Arko D, Takač I. Treatment of vulvovaginal candidiasis: a review of the literature. Acta Dermatovenerol Alp Pannonica Adriat. 2015;24(1):5–7.
- Nyirjesy P, Sobel JD. Genital mycotic infections in patients with diabetes. Postgrad Med. 2013 May;125(3):33–46.
- Nyirjesy P, Sobel JD, Fung A, Mayer C, Capuano G, Ways K, et al. Genital mycotic infections with canagliflozin, a sodium glucose co-transporter 2 inhibitor, in patients with type 2 diabetes mellitus: a pooled analysis of clinical studies. Curr Med Res Opin. 2014 Jun;30(6):1109–19.
- Kalra S, Chawla A. Diabetes and balanoposthitis. JPMA J Pak Med Assoc. 2016 Aug;66(8):1039–41.
- Weerasuriya N, Snape J. Oesophageal candidiasis in elderly patients: risk factors, prevention and management. Drugs Aging. 2008;25(2):119–30.
- Mohamed AA, Lu X-L, Mounmin FA. Diagnosis and Treatment of Esophageal Candidiasis: Current Updates. Can J Gastroenterol Hepatol. 2019;2019:3585136.
- Yismaw G, Asrat D, Woldeamanuel Y, Unakal C. Prevalence of candiduria in diabetic patients attending Gondar University Hospital, Gondar, Ethiopia. Iran J Kidney Dis. 2013 Mar;7(2):102–7.
- Alfouzan WA, Dhar R. Candiduria: Evidence-based approach to management, are we there yet? J Mycol Medicale. 2017 Sep;27(3):293–302.
- Kauffman CA. Diagnosis and management of fungal urinary tract infection. Infect Dis Clin North Am. 2014 Mar;28(1):61–74.
- Saunte DML, Piraccini BM, Sergeev AY, Prohić A, Sigurgeirsson B, Rodríguez-Cerdeira C, et al. A survey among dermatologists: diagnostics of superficial fungal infections - what is used and what is needed to initiate therapy and assess efficacy? J Eur Acad Dermatol Venereol JEADV. 2019 Feb;33(2):421–7.
- Gupta AK, Gregurek-Novak T, Konnikov N, Lynde CW, Hofstader S, Summerbell RC. Itraconazole and terbinafine treatment of some nondermatophyte molds causing onychomycosis of the toes and a review of the literature. J Cutan Med Surg. 2001 Jun;5(3):206–10.
- Pfaller MA, Jones RN, Doern GV, Fluit AC, Verhoef J, Sader HS, et al. International surveillance of blood stream infections due to Candida species in the European SENTRY Program: species distribution and antifungal susceptibility including the investigational triazole and echinocandin agents. SENTRY Participant Group (Europe). Diagn Microbiol Infect Dis. 1999 Sep;35(1):19–25.
- Borg-von Zepelin M, Kunz L, Rüchel R, Reichard U, Weig M, Gross U. Epidemiology and antifungal susceptibilities of Candida spp. to six antifungal agents: results from a surveillance study on fungaemia in Germany from July 2004 to August 2005. J Antimicrob Chemother. 2007 Aug;60(2):424–8.
- Pappas PG, Kauffman CA, Andes DR, Clancy CJ, Marr KA, Ostrosky-Zeichner L, et al. Clinical Practice Guideline for the Management of Candidiasis: 2016 Update by the Infectious Diseases Society of America. Clin Infect Dis Off Publ Infect Dis Soc Am. 2016 Feb 15;62(4):e1-50.
- Cornely OA, Alastruey-Izquierdo A, Arenz D, Chen SCA, Dannaoui E, Hochhegger B, et al. Global guideline for the diagnosis and management of mucormycosis: an initiative of the European Confederation of Medical Mycology in cooperation with the Mycoses Study Group Education and Research Consortium. Lancet Infect Dis. 2019 Dec;19(12):e405–21.
- Ravani SA, Agrawal GA, Leuva PA, Modi PH, Amin KD. Rise of the phoenix: Mucormycosis in COVID-19 times. Indian J Ophthalmol. 2021 Jun;69(6):1563–8.
- Petrikkos G, Skiada A, Lortholary O, Roilides E, Walsh TJ, Kontoyiannis DP. Epidemiology and clinical manifestations of mucormycosis. Clin Infect Dis Off Publ Infect Dis Soc Am. 2012 Feb;54 Suppl 1:S23-34.
- Artis WM, Fountain JA, Delcher HK, Jones HE. A mechanism of susceptibility to mucormycosis in diabetic ketoacidosis: transferrin and iron availability. Diabetes. 1982 Dec;31(12):1109–14.
- Ibrahim AS, Kontoyiannis DP. Update on mucormycosis pathogenesis. Curr Opin Infect Dis. 2013 Dec;26(6):508–15.
- Morales-Franco B, Nava-Villalba M, Medina-Guerrero EO, Sánchez-Nuño YA, Davila-Villa P, Anaya-Ambriz EJ, et al. Host-Pathogen Molecular Factors Contribute to the Pathogenesis of Rhizopus spp. in Diabetes Mellitus. Curr Trop Med Rep. 2021 Jan 22;1–12.
- Yohai RA, Bullock JD, Aziz AA, Markert RJ. Survival factors in rhino-orbital-cerebral mucormycosis. Surv Ophthalmol. 1994 Aug;39(1):3–22.
- Skiada A, Lass-Floerl C, Klimko N, Ibrahim A, Roilides E, Petrikkos G. Challenges in the diagnosis and treatment of mucormycosis. Med Mycol. 2018 Apr 1;56(suppl_1):93–101.
- Lipner SR, Scher RK. Onychomycosis: Treatment and prevention of recurrence. J Am Acad Dermatol. 2019 Apr;80(4):853–67.
- Nenoff P, Krüger C, Ginter-Hanselmayer G, Tietz H-J. Mycology - an update. Part 1: Dermatomycoses: causative agents, epidemiology and pathogenesis. J Dtsch Dermatol Ges J Ger Soc Dermatol JDDG. 2014 Mar;12(3):188–209; quiz 210, 188–211; 212.
- Falodun O, Ogunbiyi A, Salako B, George AK. Skin changes in patients with chronic renal failure. Saudi J Kidney Dis Transplant Off Publ Saudi Cent Organ Transplant Saudi Arab. 2011 Mar;22(2):268–72.
- Westerberg DP, Voyack MJ. Onychomycosis: Current trends in diagnosis and treatment. Am Fam Physician. 2013 Dec 1;88(11):762–70.
- Ely JW, Rosenfeld S, Seabury Stone M. Diagnosis and management of tinea infections. Am Fam Physician. 2014 Nov 15;90(10):702–10.
- Hasenmajer V, Sbardella E, Sciarra F, Minnetti M, Isidori AM, Venneri MA. The Immune System in Cushing’s Syndrome. Trends Endocrinol Metab TEM. 2020 Sep;31(9):655–69.
- Lionakis MS, Kontoyiannis DP. Glucocorticoids and invasive fungal infections. Lancet Lond Engl. 2003 Nov 29;362(9398):1828–38.
- Lee EK, Kim JH, Yu HG. Candida albicans endophthalmitis in a patient with a non-functioning pituitary adenoma evolving into Cushing׳s disease: A case report. Med Mycol Case Rep. 2014 Oct;6:37–41.
- Kansagara DL, Tetrault J, Hamill C, Moore C, Olson B. Fatal factitious Cushing’s syndrome and invasive aspergillosis: case report and review of literature. Endocr Pract Off J Am Coll Endocrinol Am Assoc Clin Endocrinol. 2006 Dec;12(6):651–5.
- Joubert M, Reznik Y, Verdon R. “Rescue” bilateral adrenalectomy in paraneoplastic Cushing’s syndrome with invasive Aspergillus fumigatus infection. Am J Med Sci. 2007 Dec;334(6):497–8.
- Ng TT, Robson GD, Denning DW. Hydrocortisone-enhanced growth of Aspergillus spp.: implications for pathogenesis. Microbiol Read Engl. 1994 Sep;140 ( Pt 9):2475–9.
- Arlt A, Harbeck B, Anlauf M, Alkatout I, Klöppel G, Fölsch UR, et al. Fatal pneumocystis jirovecii pneumonia in a case of ectopic Cushing’s syndrome due to neuroendocrine carcinoma of the kidney. Exp Clin Endocrinol Diabetes Off J Ger Soc Endocrinol Ger Diabetes Assoc. 2008 Oct;116(9):515–9.
- Oosterhuis JK, van den Berg G, Monteban-Kooistra WE, Ligtenberg JJM, Tulleken JE, Meertens JHJM, et al. Life-threatening Pneumocystis jiroveci pneumonia following treatment of severe Cushing’s syndrome. Neth J Med. 2007 Jun;65(6):215–7.
- Gabalec F, Zavrelová A, Havel E, Cerman J, Radocha J, Svilias I, et al. Pneumocystis pneumonia during medicamentous treatment of Cushing’s syndrome--a description of two cases. Acta Medica (Hradec Kralove). 2011;54(3):127–30.
- van Halem K, Vrolijk L, Pereira AM, de Boer MGJ. Characteristics and Mortality of Pneumocystis Pneumonia in Patients With Cushing’s Syndrome: A Plea for Timely Initiation of Chemoprophylaxis. Open Forum Infect Dis [Internet]. 2017 Jan 30 [cited 2021 Jun 7];4(1). Available from: https://www.ncbi.nlm.nih.gov/pmc/articles/PMC5414011/
- Lu L, Zhao YY, Yang HB, Tian XL, Xu ZJ, Lu ZL. Cushing’s disease with pulmonary Cryptococcus neoformans infection in a single center in Beijing, China: A retrospective study and literature review. J Formos Med Assoc Taiwan Yi Zhi. 2019 Jan;118(1 Pt 2):285–90.
- Fujikawa H, Araki M. Disseminated cryptococcosis in a patient with adrenocortical carcinoma and Cushing’s syndrome. J Infect Chemother Off J Jpn Soc Chemother. 2020 Dec;26(12):1301–4.
- Lacativa PGS, Donangelo I, Wagman MB, Sieiro Neto L, Caldas CR, Violante AHD, et al. [Pseudotumoral pulmonary cryptococcosis in association with Cushing’s syndrome]. Arq Bras Endocrinol Metabol. 2004 Apr;48(2):318–23.
- Thangakunam B, Christopher DJ, Kurian S, Thomas R, James P. ENDOGENOUS EXCESS CORTISOL PRODUCTION AND DIABETES MELLITUS AS PREDISPOSING FACTORS FOR PULMONARY CRYPTOCOCCOSIS: A CASE REPORT AND LITERATURE REVIEW. Lung India Off Organ Indian Chest Soc. 2008;25(4):155–7.
- Gross NT, Chinchilla M, Camner P, Jarstrand C. Anticryptococcal activity by alveolar macrophages from rats treated with cortisone acetate during different periods of time. Mycopathologia. 1996;136(1):1–8.
- Nidhi A, Meena A, Sreekumar A, Daga MK. Corticosteroid-induced cryptococcal meningitis in patient without HIV. BMJ Case Rep. 2017 Jan 4;2017.
- Kosseifi SG, Nassour DN, Shaikh MA, Sarubbi FA, Jordan RM, Peiris AN. Nodular pulmonary histoplasmosis in Cushing’s disease: a case report and literature review. Tenn Med J Tenn Med Assoc. 2007 Dec;100(12):44–6.
- Dismukes WE, Royal SA, Tynes BS. Disseminated histoplasmosis in corticosteroid-treated patients. Report of five cases. JAMA. 1978 Sep 29;240(14):1495–8.
- Jung EJ, Park DW, Choi J-W, Choi WS. Chronic Cavitary Pulmonary Histoplasmosis in a Non-HIV and Immunocompromised Patient without Overseas Travel History. Yonsei Med J. 2015 May 1;56(3):871–4.
- Humbert L, Cornu M, Proust-Lemoine E, Bayry J, Wemeau J-L, Vantyghem M-C, et al. Chronic Mucocutaneous Candidiasis in Autoimmune Polyendocrine Syndrome Type 1. Front Immunol. 2018;9:2570.
- Gavanescu I, Benoist C, Mathis D. B cells are required for Aire-deficient mice to develop multi-organ autoinflammation: A therapeutic approach for APECED patients. Proc Natl Acad Sci U S A. 2008 Sep 2;105(35):13009–14.
- Pedroza LA, Kumar V, Sanborn KB, Mace EM, Niinikoski H, Nadeau K, et al. Autoimmune regulator (AIRE) contributes to Dectin-1-induced TNF-α production and complexes with caspase recruitment domain-containing protein 9 (CARD9), spleen tyrosine kinase (Syk), and Dectin-1. J Allergy Clin Immunol. 2012 Feb;129(2):464–72, 472.e1-3.
- Eyerich K, Eyerich S, Hiller J, Behrendt H, Traidl-Hoffmann C. Chronic mucocutaneous candidiasis, from bench to bedside. Eur J Dermatol EJD. 2010 Jun;20(3):260–5.
- Benitez LL, Carver PL. Adverse Effects Associated with Long-Term Administration of Azole Antifungal Agents. Drugs. 2019 Jun;79(8):833–53.
- Loose DS, Kan PB, Hirst MA, Marcus RA, Feldman D. Ketoconazole blocks adrenal steroidogenesis by inhibiting cytochrome P450-dependent enzymes. J Clin Invest. 1983 May;71(5):1495–9.
- Sonino N. The use of ketoconazole as an inhibitor of steroid production. N Engl J Med. 1987 Sep 24;317(13):812–8.
- Best TR, Jenkins JK, Murphy FY, Nicks SA, Bussell KL, Vesely DL. Persistent adrenal insufficiency secondary to low-dose ketoconazole therapy. Am J Med. 1987 Mar 23;82(3 Spec No):676–80.
- Khosla S, Wolfson JS, Demerjian Z, Godine JE. Adrenal crisis in the setting of high-dose ketoconazole therapy. Arch Intern Med. 1989 Apr;149(4):802–4.
- Duret C, Daujat-Chavanieu M, Pascussi J-M, Pichard-Garcia L, Balaguer P, Fabre J-M, et al. Ketoconazole and miconazole are antagonists of the human glucocorticoid receptor: consequences on the expression and function of the constitutive androstane receptor and the pregnane X receptor. Mol Pharmacol. 2006 Jul;70(1):329–39.
- Pivonello R, De Leo M, Cozzolino A, Colao A. The Treatment of Cushing’s Disease. Endocr Rev. 2015 Aug;36(4):385–486.
- Skov M, Main KM, Sillesen IB, Müller J, Koch C, Lanng S. Iatrogenic adrenal insufficiency as a side-effect of combined treatment of itraconazole and budesonide. Eur Respir J. 2002 Jul;20(1):127–33.
- Santhana Krishnan SG, Cobbs RK. Reversible acute adrenal insufficiency caused by fluconazole in a critically ill patient. Postgrad Med J. 2006 Sep;82(971):e23.
- Miller A, Brooks LK, Poola-Kella S, Malek R. Posaconazole-Induced Adrenal Insufficiency in a Case of Chronic Myelomonocytic Leukemia. Case Rep Endocrinol. 2018;2018:2170484.
- Duman AK, Fulco PP. Adrenal Insufficiency With Voriconazole and Inhaled/Intranasal Corticosteroids: Case Report and Systematic Review. J Pharm Pract. 2017 Aug;30(4):459–63.
- Araque DP, Zuniga G, Ayala AR. PRIMARY ADRENAL INSUFFICIENCY SECONDARY TO CHRONIC POSACONAZOLE USE. AACE Clin Case Rep. 2020 Apr;6(2):e62–4.
- Albert SG, DeLeon MJ, Silverberg AB. Possible association between high-dose fluconazole and adrenal insufficiency in critically ill patients. Crit Care Med. 2001 Mar;29(3):668–70.
- Zhao Y, Liang W, Cai F, Wu Q, Wang Y. Fluconazole for Hypercortisolism in Cushing’s Disease: A Case Report and Literature Review. Front Endocrinol. 2020;11:608886.
- Lebrun-Vignes B, Archer VC, Diquet B, Levron JC, Chosidow O, Puech AJ, et al. Effect of itraconazole on the pharmacokinetics of prednisolone and methylprednisolone and cortisol secretion in healthy subjects. Br J Clin Pharmacol. 2001 May;51(5):443–50.
- Varis T, Kivistö KT, Backman JT, Neuvonen PJ. Itraconazole decreases the clearance and enhances the effects of intravenously administered methylprednisolone in healthy volunteers. Pharmacol Toxicol. 1999 Jul;85(1):29–32.
- Beck KR, Odermatt A. Antifungal therapy with azoles and the syndrome of acquired mineralocorticoid excess. Mol Cell Endocrinol. 2021 Mar 15;524:111168.
- Thompson GR, Beck KR, Patt M, Kratschmar DV, Odermatt A. Posaconazole-Induced Hypertension Due to Inhibition of 11β-Hydroxylase and 11β-Hydroxysteroid Dehydrogenase 2. J Endocr Soc. 2019 Jul 1;3(7):1361–6.
- Hoffmann WJ, McHardy I, Thompson GR. Itraconazole induced hypertension and hypokalemia: Mechanistic evaluation. Mycoses. 2018 May;61(5):337–9.
- Boughton C, Taylor D, Ghataore L, Taylor N, Whitelaw BC. Mineralocorticoid hypertension and hypokalaemia induced by posaconazole. Endocrinol Diabetes Metab Case Rep. 2018;2018.
- Agarwal N, Apperley L, Taylor NF, Taylor DR, Ghataore L, Rumsby E, et al. Posaconazole-Induced Hypertension Masquerading as Congenital Adrenal Hyperplasia in a Child with Cystic Fibrosis. Case Rep Med. 2020;2020:8153012.
- Barton K, Davis TK, Marshall B, Elward A, White NH. Posaconazole-induced hypertension and hypokalemia due to inhibition of the 11β-hydroxylase enzyme. Clin Kidney J. 2018 Oct;11(5):691–3.
- Sikka SC, Swerdloff RS, Rajfer J. In vitro inhibition of testosterone biosynthesis by ketoconazole. Endocrinology. 1985 May;116(5):1920–5.
- Pont A, Williams PL, Azhar S, Reitz RE, Bochra C, Smith ER, et al. Ketoconazole blocks testosterone synthesis. Arch Intern Med. 1982 Nov;142(12):2137–40.
- Pont A, Goldman ES, Sugar AM, Siiteri PK, Stevens DA. Ketoconazole-induced increase in estradiol-testosterone ratio. Probable explanation for gynecomastia. Arch Intern Med. 1985 Aug;145(8):1429–31.
- Eil C. Ketoconazole binds to the human androgen receptor. Horm Metab Res Horm Stoffwechselforschung Horm Metab. 1992 Aug;24(8):367–70.
- Hugo Perez BS. Ketocazole as an adjunct to finasteride in the treatment of androgenetic alopecia in men. Med Hypotheses. 2004;62(1):112–5.
- Patel V, Liaw B, Oh W. The role of ketoconazole in current prostate cancer care. Nat Rev Urol. 2018 Oct;15(10):643–51.
- Almeida MQ, Brito VN, Lins TSS, Guerra-Junior G, de Castro M, Antonini SR, et al. Long-term treatment of familial male-limited precocious puberty (testotoxicosis) with cyproterone acetate or ketoconazole. Clin Endocrinol (Oxf). 2008 Jul;69(1):93–8.
- Hanger DP, Jevons S, Shaw JT. Fluconazole and testosterone: in vivo and in vitro studies. Antimicrob Agents Chemother. 1988 May;32(5):646–8.
- Thompson GR, Surampudi PN, Odermatt A. Gynecomastia and hypertension in a patient treated with posaconazole. Clin Case Rep. 2020 Sep 28;8(12):3158–61.
- Cummings AM, Hedge JL, Laskey J. Ketoconazole impairs early pregnancy and the decidual cell response via alterations in ovarian function. Fundam Appl Toxicol Off J Soc Toxicol. 1997 Dec;40(2):238–46.
- Pepper G, Brenner SH, Gabrilove JL. Ketoconazole use in the treatment of ovarian hyperandrogenism. Fertil Steril. 1990 Sep;54(3):438–44.
- P B, Sj G, D G, A C. Iatrogenic metrorrhagia after the use of itraconazole for onychomycosis. Indian J Pharmacol [Internet]. 2017 Dec [cited 2021 Jun 11];49(6). Available from: https://pubmed.ncbi.nlm.nih.gov/29674803/
- Pillans PI, Sparrow MJ. Pregnancy associated with a combined oral contraceptive and itraconazole. N Z Med J. 1993 Oct 13;106(965):436.
- Hilbert J, Messig M, Kuye O, Friedman H. Evaluation of interaction between fluconazole and an oral contraceptive in healthy women. Obstet Gynecol. 2001 Aug;98(2):218–23.
- Levine MT, Chandrasekar PH. Adverse effects of voriconazole: Over a decade of use. Clin Transplant. 2016 Nov;30(11):1377–86.
- Teranishi J, Nagatoya K, Kakita T, Yamauchi Y, Matsuda H, Mori T, et al. Voriconazole-associated salt-losing nephropathy. Clin Exp Nephrol. 2010 Aug;14(4):377–80.
- Isobe K, Muraoka S, Sugino K, Yamazaki Y, Kikuchi N, Hamanaka N, et al. [Case of pulmonary aspergillosis associated with inappropriate antidiuretic hormone syndrome caused by voriconazole therapy]. Nihon Kokyuki Gakkai Zasshi. 2007 Jun;45(6):489–93.
- Xu R-A, Zheng S-L, Xiao L-L, Cai X-D, Lai X-X, Lin G-Y, et al. Therapeutic drug monitoring in voriconazole-associated hyponatremia. Med Mycol Case Rep. 2013 Jun 19;2:134–6.
- Matsumoto K, Ikawa K, Abematsu K, Fukunaga N, Nishida K, Fukamizu T, et al. Correlation between voriconazole trough plasma concentration and hepatotoxicity in patients with different CYP2C19 genotypes. Int J Antimicrob Agents. 2009 Jul;34(1):91–4.
- Ho S, Rawlins M, Ingram P, Boan P. Voriconazole-induced hyponatraemia associated with homozygous CYP2C19*2 genotype. J Chemother Florence Italy. 2017 Oct;29(5):325–6.
- Lin X-B, Li Z-W, Yan M, Zhang B-K, Liang W, Wang F, et al. Population pharmacokinetics of voriconazole and CYP2C19 polymorphisms for optimizing dosing regimens in renal transplant recipients. Br J Clin Pharmacol. 2018 Jul;84(7):1587–97.
- Moon WJ, Scheller EL, Suneja A, Livermore JA, Malani AN, Moudgal V, et al. Plasma fluoride level as a predictor of voriconazole-induced periostitis in patients with skeletal pain. Clin Infect Dis Off Publ Infect Dis Soc Am. 2014 Nov 1;59(9):1237–45.
- Thompson GR, Bays D, Cohen SH, Pappagianis D. Fluoride excess in coccidioidomycosis patients receiving long-term antifungal therapy: an assessment of currently available triazoles. Antimicrob Agents Chemother. 2012 Jan;56(1):563–4.
- Wermers RA, Cooper K, Razonable RR, Deziel PJ, Whitford GM, Kremers WK, et al. Fluoride excess and periostitis in transplant patients receiving long-term voriconazole therapy. Clin Infect Dis Off Publ Infect Dis Soc Am. 2011 Mar 1;52(5):604–11.
- Skiles JL, Imel EA, Christenson JC, Bell JE, Hulbert ML. Fluorosis because of prolonged voriconazole therapy in a teenager with acute myelogenous leukemia. J Clin Oncol Off J Am Soc Clin Oncol. 2011 Nov 10;29(32):e779-782.
- Poinen K, Leung M, Wright AJ, Landsberg D. A vexing case of bone pain in a renal transplant recipient: Voriconazole-induced periostitis. Transpl Infect Dis Off J Transplant Soc. 2018 Oct;20(5):e12941.
- Adwan MH. Voriconazole-induced periostitis: a new rheumatic disorder. Clin Rheumatol. 2017 Mar;36(3):609–15.
- Chitkara M, Rackoff PJ, Beltran LS. Multiple painless masses: periostitis deformans secondary to fluoride intoxication. Skeletal Radiol. 2014 Apr;43(4):529–30, 555–6.
- Tanner AR. Hypothyroidism after treatment with ketoconazole. Br Med J Clin Res Ed. 1987 Jan 10;294(6564):125.
- Glass AR, Eil C. Ketoconazole-induced reduction in serum 1,25-dihydroxyvitamin D. J Clin Endocrinol Metab. 1986 Sep;63(3):766–9.
- G S, S B, Gi B, G DN. Ketoconazole decreases the serum ionized calcium and 1,25-dihydroxyvitamin D levels in tuberculosis-associated hypercalcemia. Am J Dis Child 1960 [Internet]. 1993 Mar [cited 2021 Jun 13];147(3). Available from: https://pubmed.ncbi.nlm.nih.gov/8438806/
- Ar G, Jm C, W E, J L, Rw G, C E. Ketoconazole reduces elevated serum levels of 1,25-dihydroxyvitamin D in hypercalcemic sarcoidosis. J Endocrinol Invest [Internet]. 1990 May [cited 2021 Jun 13];13(5). Available from: https://pubmed.ncbi.nlm.nih.gov/2166103/
- Sayers J, Hynes AM, Srivastava S, Dowen F, Quinton R, Datta HK, et al. Successful treatment of hypercalcaemia associated with a CYP24A1 mutation with fluconazole. Clin Kidney J. 2015 Aug;8(4):453–5.
- Nguyen M, Boutignon H, Mallet E, Linglart A, Guillozo H, Jehan F, et al. Infantile hypercalcemia and hypercalciuria: new insights into a vitamin D-dependent mechanism and response to ketoconazole treatment. J Pediatr. 2010 Aug;157(2):296–302.
- Peehl DM, Seto E, Feldman D. Rationale for combination ketoconazole/ vitamin D treatment of prostate cancer. Urology. 2001 Aug;58(2 Suppl 1):123–6.
- Ghatak T, Singh RK, Baronia AK. Enteral voriconazole induced hypoglycemia: A potentially life threatening complication. Indian J Pharmacol. 2012;44(1):138–9.
- Lobo BL, Miwa LJ, Jungnickel PW. Possible ketoconazole-induced hypoglycemia. Drug Intell Clin Pharm. 1988 Aug;22(7–8):632.
- Lyoen M, Rostain F, Grimault A, Minello A, Sgro C. VFEND® (voriconazole)-associated hypoglycaemia without identified drug interaction. Fundam Clin Pharmacol. 2013 Oct;27(5):570–1.
- Niemi M, Backman JT, Neuvonen M, Laitila J, Neuvonen PJ, Kivistö KT. Effects of fluconazole and fluvoxamine on the pharmacokinetics and pharmacodynamics of glimepiride. Clin Pharmacol Ther. 2001 Apr;69(4):194–200.
- Gunaratne K, Austin E, Wu PE. Unintentional sulfonylurea toxicity due to a drug-drug interaction: a case report. BMC Res Notes. 2018 May 21;11(1):331.
- Stuecklin-Utsch A, Hasan C, Bode U, Fleischhack G. Pancreatic toxicity after liposomal amphotericin B. Mycoses. 2002 Jun;45(5–6):170–3.
- Kim SW, Yeum CH, Kim S, Oh Y, Choi KC, Lee J. Amphotericin B decreases adenylyl cyclase activity and aquaporin-2 expression in rat kidney. J Lab Clin Med. 2001 Oct;138(4):243–9.
- Metzger NL, Varney Gill KL. Nephrogenic diabetes insipidus induced by two amphotericin B liposomal formulations. Pharmacotherapy. 2009 May;29(5):613–20.
- Laniado-Laborín R, Cabrales-Vargas MN. Amphotericin B: side effects and toxicity. Rev Iberoam Micol. 2009 Dec 31;26(4):223–7.
- Canada TW, Weavind LM, Augustin KM. Possible liposomal amphotericin B-induced nephrogenic diabetes insipidus. Ann Pharmacother. 2003 Jan;37(1):70–3.
- Bockenhauer D, Bichet DG. Pathophysiology, diagnosis and management of nephrogenic diabetes insipidus. Nat Rev Nephrol. 2015 Oct;11(10):576–88.
- Ishikawa S. Amphotericin B-induced nephrogenic diabetes insipidus. Intern Med Tokyo Jpn. 2005 May;44(5):403.
- Kobayashi R, Keino D, Hori D, Sano H, Suzuki D, Kishimoto K, et al. Analysis of Hypokalemia as a Side Effect of Liposomal Amphotericin in Pediatric Patients. Pediatr Infect Dis J. 2018 May;37(5):447–50.
- Zager RA, Bredl CR, Schimpf BA. Direct amphotericin B-mediated tubular toxicity: assessments of selected cytoprotective agents. Kidney Int. 1992 Jun;41(6):1588–94.
- Barton CH, Pahl M, Vaziri ND, Cesario T. Renal magnesium wasting associated with amphotericin B therapy. Am J Med. 1984 Sep;77(3):471–4.
- Johansen HK, Gøtzsche PC. Amphotericin B lipid soluble formulations versus amphotericin B in cancer patients with neutropenia. Cochrane Database Syst Rev [Internet]. 2014 Sep 4 [cited 2021 Jun 13];2014(9). Available from: https://www.ncbi.nlm.nih.gov/pmc/articles/PMC6457843/
- Sato K, Hayashi M, Utsugi M, Ishizuka T, Takagi H, Mori M. Acute pancreatitis in a patient treated with micafungin. Clin Ther. 2007 Jul;29(7):1468–73.
- Smith PB, Steinbach WJ, Cotten CM, Schell WA, Perfect JR, Walsh TJ, et al. Caspofungin for the treatment of azole resistant candidemia in a premature infant. J Perinatol Off J Calif Perinat Assoc. 2007 Feb;27(2):127–9.
- Xue S, Gu R, Wu T, Zhang M, Wang X. Oral potassium iodide for the treatment of sporotrichosis. Cochrane Database Syst Rev. 2009 Oct 7;(4):CD006136.
- Costa RO, de Macedo PM, Carvalhal A, Bernardes-Engemann AR. Use of potassium iodide in Dermatology: updates on an old drug. An Bras Dermatol. 2013;88(3):396–402.