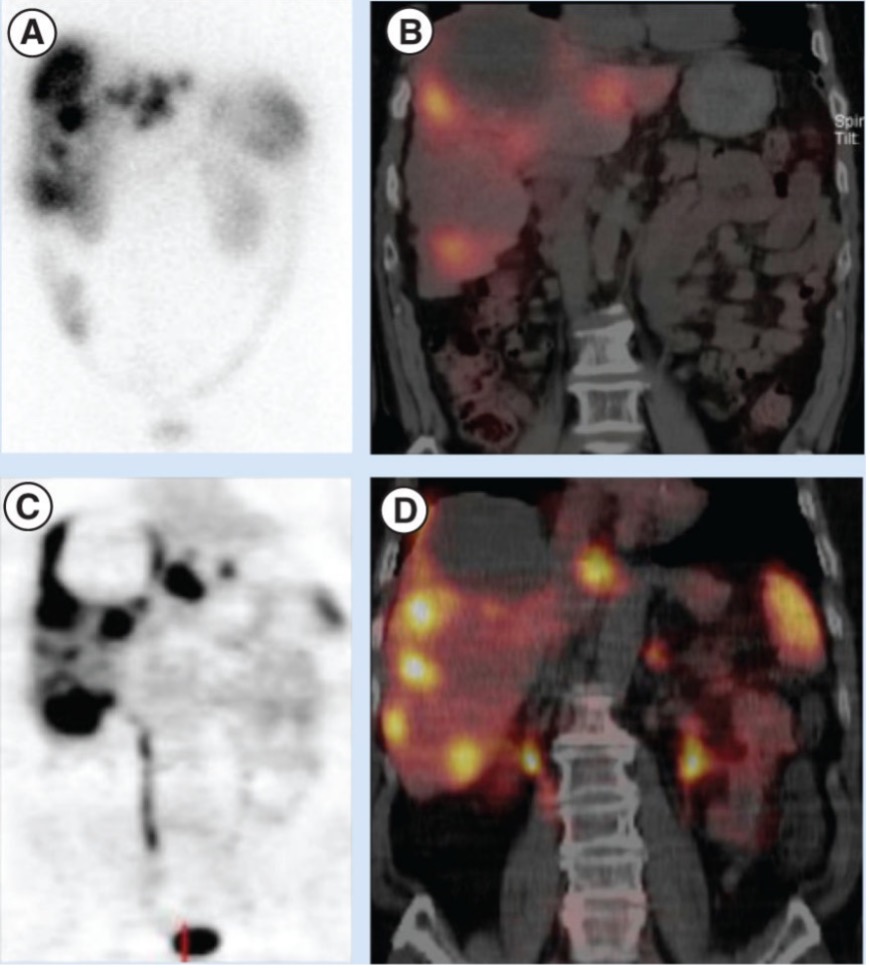
Figure 5. Comparison of (A) planar Octreoscan®, (B) Octreoscan®/SPECT/CT fusion, (C) planar 68Ga-DOTATOC-PET and (D) 68Ga-DOTATOC-PET/CT in the same patient. Images C and D clearly display a more precise delineation of the lesions. This figure has been adapted from International journal of endocrine oncology, Maxwell J. E. and Howe J. R., Imaging in neuroendocrine tumors: and update for the clinician, 2 (2): 159-68 © 2015 (82).