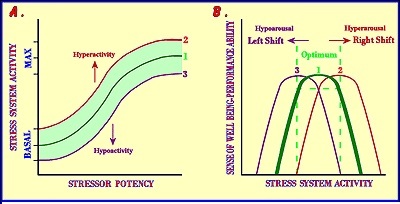
figure 13. a. the dose-response curve between the potency of a posed stressor and the activity of the components of the stress system that respond to this specific stressor. curve 1 (green) : the normal dose-response curve, curve 2 (red) : the dose-response curve that defines the upper physiologic level of stress system activity, curve 3 (purple): the dose-response curve that defines the lower physiologic level of stress system activity. any curve higher than 2 represents stress system hyperactivity and any curve lower than 3 represents stress system hypoactivity. b. the inverted u-shaped dose-response curve between the sense of well-being or performance ability and the activity of the stress system. curve 1 (green) : optimal activity curve, curve 2 (red) : excessive stress system activity curve, curve 3 (purple): defective stress system activity curve. curves 2 and 3 curtail the top of the optimal curve and represent shifts to the left (hypoarousal) and to the right (hyperarousal-anxiety) and both are associated with suboptimal sense of well-being or diminished performance (adapted from chrousos g.p. and gold p.w., jama, 267,1244,1992.)