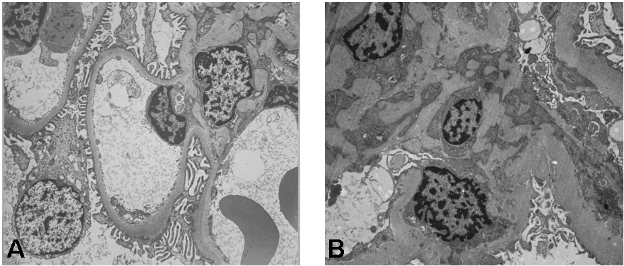
Figure 4. Electron microscopy photographs of mesangial area in normal control (A) and in type 1 diabetic patient (B) [X 3,900]. Note the increase in mesangial matrix and cell content, the glomerular basement membrane thickening and the decrease in the capillary luminal space in the diabetic patient (B). Source: Reprinted with permission from National Kidney Foundation. Pathogenesis and Pathophysiology of Diabetic Nephropathy. Caramori ML, Mauer M. Primer on Kidney Diseases, 5th Edition, Greenberg A, et al., Copyright 2009 (253).