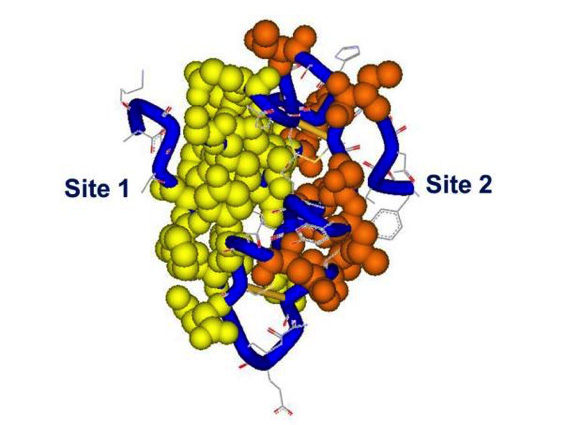
Figure 5. Receptor binding sites 1 and 2 on the insulin molecule. The residues in site 1 are mapped in yellow, site 2 in red, backbone in blue. Spheres and tube shown at 0.7 Van der Waals radius. Site 1: Gly A1, Ile A2, Val A3, Glu A4, Tyr A19, Asn 21, Gly B8, Ser B9, Leu B11, Val B12, Tyr B16, Phe B24, Phe B25, Tyr B26. Site 2: Thr A8, Ile A10, Ser A12, Leu A13, Glu A17, His B10, Glu B13, Leu B17. PDB file 9INS. Modelled using DSViewerPro from Accelrys.
Figure 5. Receptor binding sites 1 and 2 on the insulin molecule. The residues in site 1 are mapped in yellow, site 2 in red, backbone in blue. Spheres and tube shown at 0.7 Van der Waals radius. Site 1: Gly A1, Ile A2, Val A3, Glu A4, Tyr A19, Asn 21, Gly B8, Ser B9, Leu B11, Val B12, Tyr B16, Phe B24, Phe B25, Tyr B26. Site 2: Thr A8, Ile A10, Ser A12, Leu A13, Glu A17, His B10, Glu B13, Leu B17. PDB file 9INS. Modelled using DSViewerPro from Accelrys.