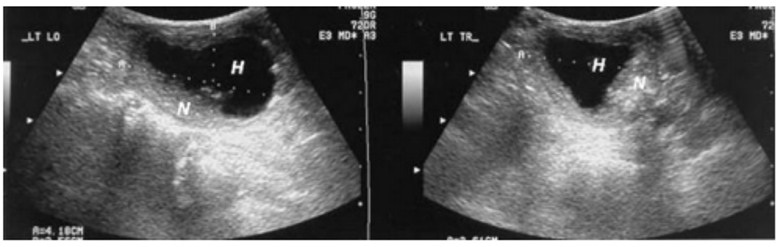
Figure 3. Sonograms showing longitudinal (left panel) and transverse (right panel) images of the left lobe containing a degenerated thyroid nodule. Note the thick wall and irregularity. N = nodule, H = hemorrhagic degenerated region.
Figure 3. Sonograms showing longitudinal (left panel) and transverse (right panel) images of the left lobe containing a degenerated thyroid nodule. Note the thick wall and irregularity. N = nodule, H = hemorrhagic degenerated region.